
21 metros below 2022 highs: Austin, San Francisco, Phoenix, San Antonio, Denver, Sacramento, Dallas-Ft. Worth, Houston, Seattle, Tampa, Atlanta, Portland, Salt Lake, Raleigh, Charlotte, Nashville, Las Vegas, Minneapolis, Orlando…
Other metros powered past 2022: Miami, San Diego & Los Angeles now losing ground. Baltimore, Kansas City, Columbus, Washington D.C., Philadelphia, Boston, Chicago, New York…
By Wolf Richter for WOLF STREET.
Prices of single-family houses, condos, and co-ops fell in January from December in 32 of the 33 large Metropolitan Statistical Area on our list here. The one exception was the San Jose MSA, where prices were roughly unchanged for the fifth month in a row.
In some markets, there is essentially no seasonality to home prices, just wobbles, squiggles, peaks, and troughs that occur at various periods of the year, and price changes in those markets are not seasonal.
In other markets, there is distinct seasonality in home prices, with annual peaks occurring at roughly the same month of the year, and price changes may be in part seasonal. The charts below, which are based on raw, not-seasonally-adjusted prices of mid-tier homes in each market, visually demonstrate that absence or presence of seasonality in prior years.
Down from the 2022 peaks: Prices in 21 metros of our 33 metros are down from their 2022 peaks. Some by a smidge, others by a lot. The list of decliners from their 2022 peaks is led by the metros of Austin (-23.3%), San Francisco (-11.0%), Phoenix (-9.8%), and San Antonio (-9.1%).
No New highs in January: No metro of the 33 metros here made a new high in January.
All data is from the “raw” mid-tier Zillow Home Value Index (ZHVI), released today. The ZHVI is based on millions of data points in Zillow’s “Database of All Homes,” including from public records (tax data), MLS, brokerages, local Realtor Associations, real-estate agents, and households across the US. It includes pricing data for off-market deals and for-sale-by-owner deals. Zillow’s Database of All Homes also has sales-pairs data.
To qualify for this list, the MSA must be one of the largest by population, and must have had a ZHVI of at least $300,000 at the peak. The metros of New Orleans, Oklahoma City, Tulsa, Cincinnati, Pittsburgh, etc. don’t qualify for this list because their ZHVI has never reached $300,000, despite the surge of home prices in recent years, but from low levels.
The first 21 metros are all below their highs in mid-2022.
The speculative mania in these markets through mid-2022 was driven by the Fed’s interest rate repression, including trillions of dollars of QE at the time, resulting in below-3% mortgages, which turned housing markets into absurdities.
But the Fed has let go of interest rate repression, and has been doing QT since mid-2022 and by now has shed $2.15 trillion in assets from its balance sheet. And mortgage rates have been around 7%, give or take some, since September 2022, which was sort of normal before the QE era started in 2008.
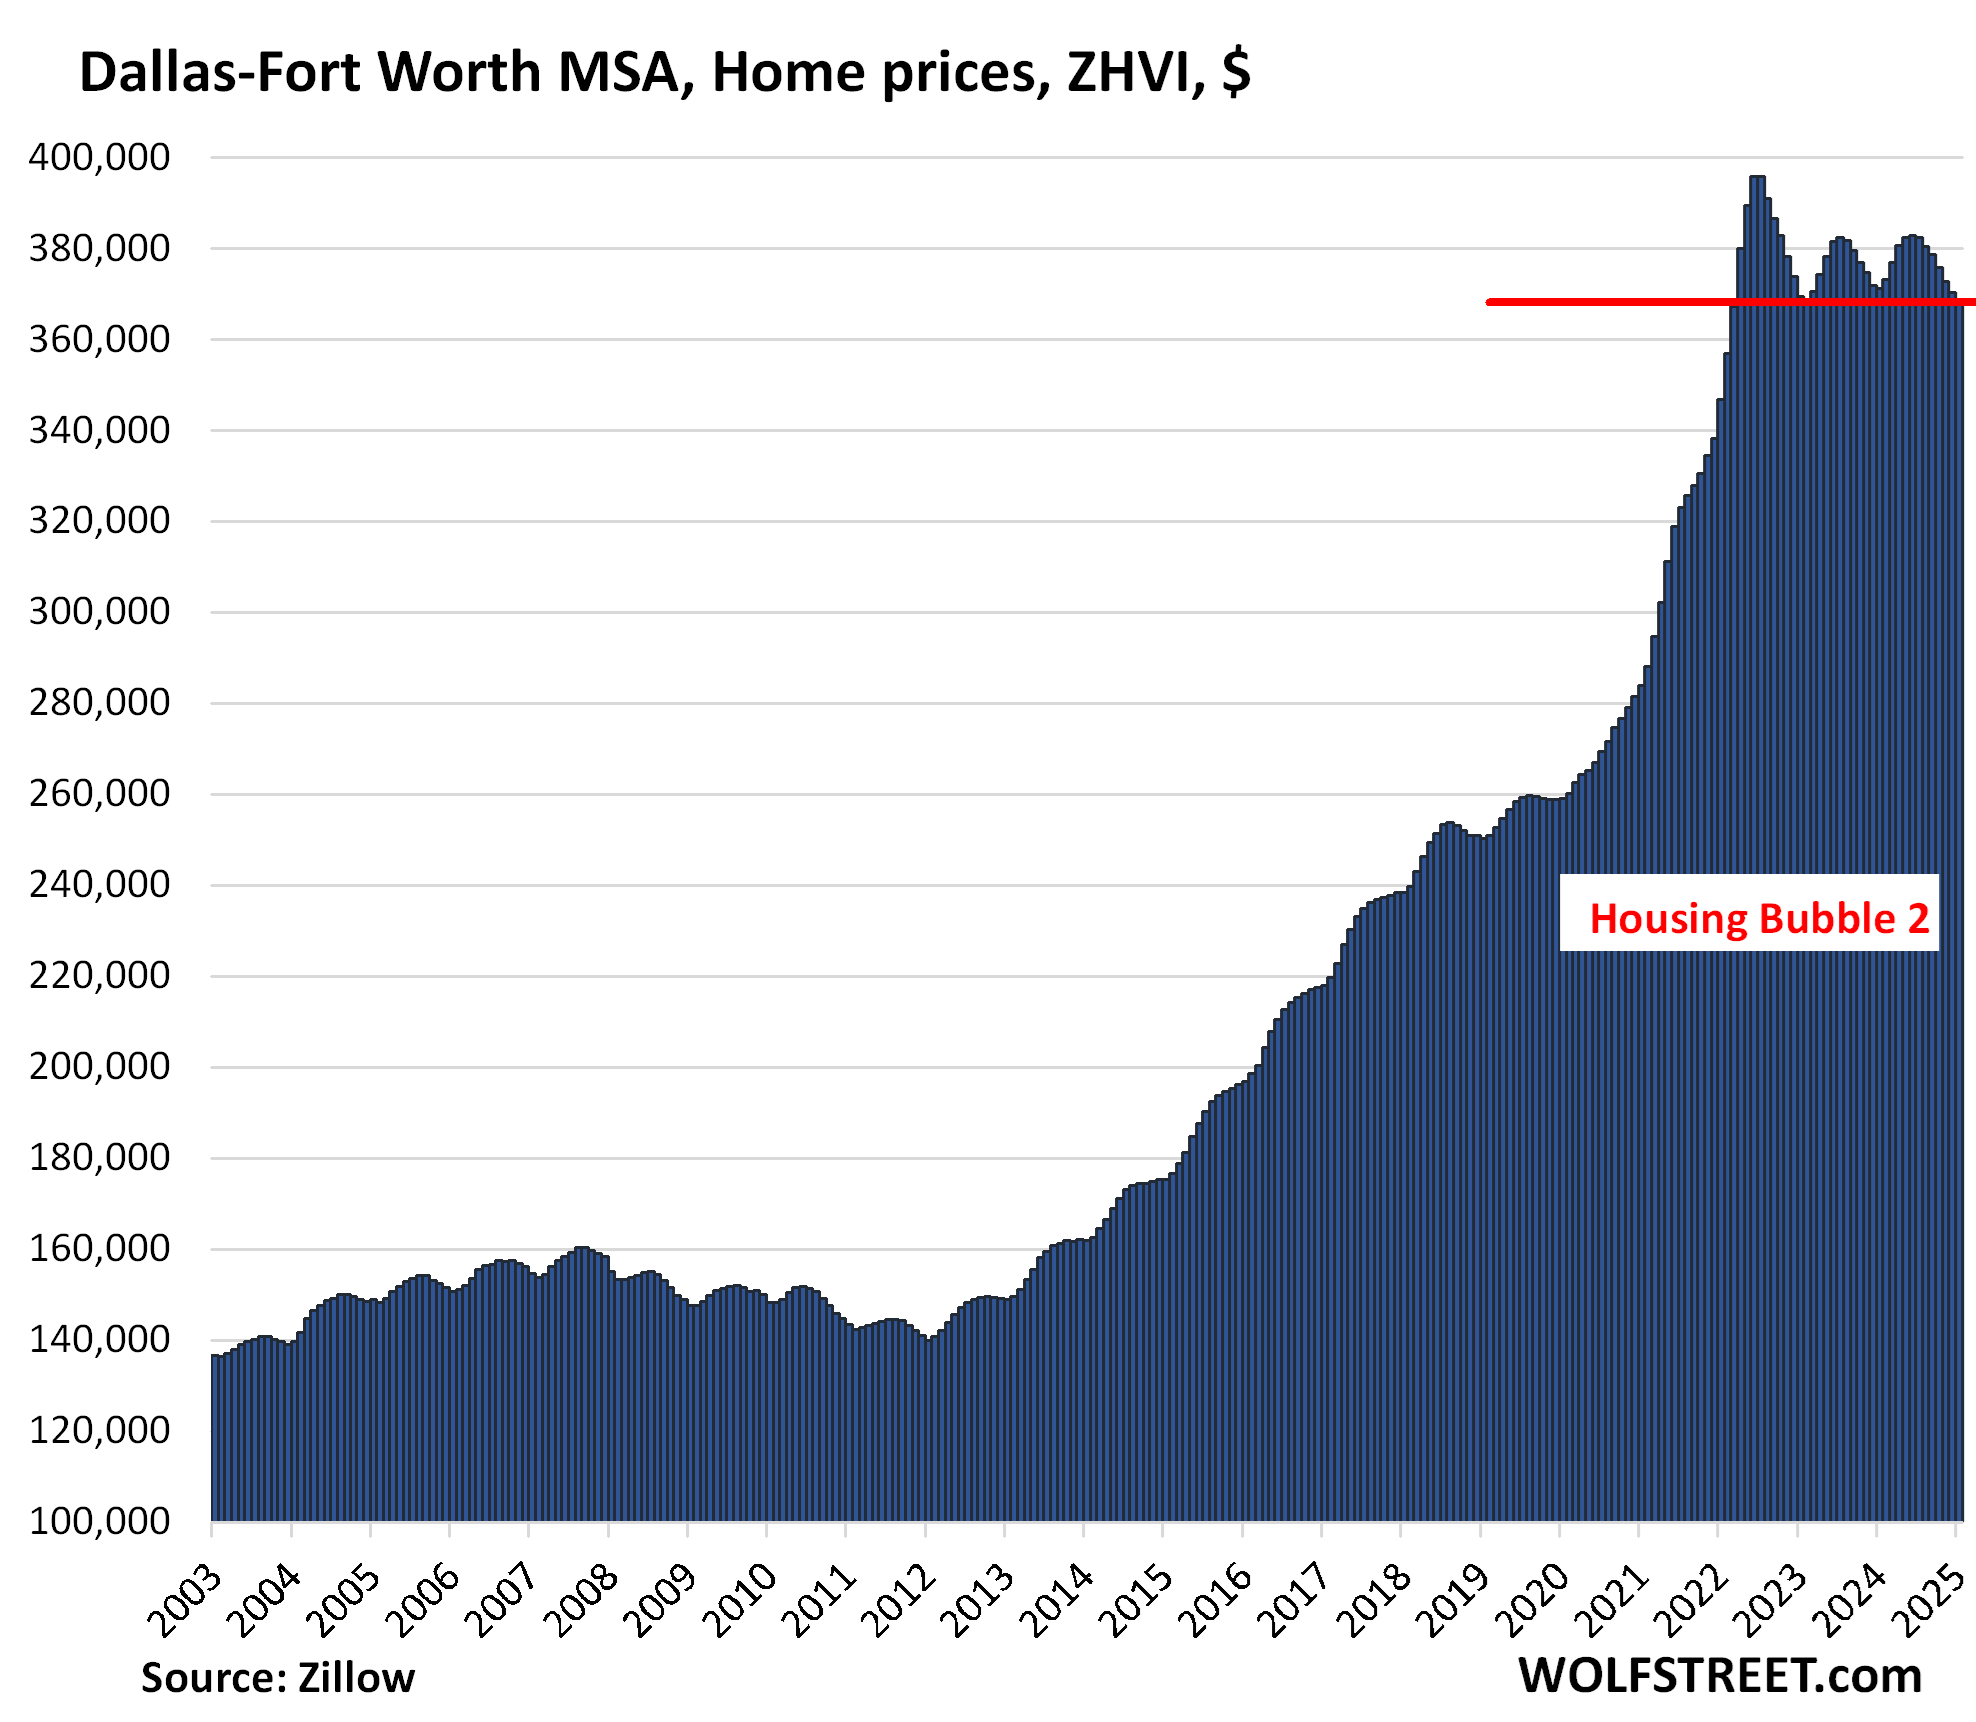
Note that Texas didn’t experience Housing Bubble 1, having finally gotten through with a huge housing bust some years earlier, and it therefore didn’t experience the big price drops in 2006 to 2012 either, just some moderate declines. But it made up for having missed out on Housing Bubble 1 this time around.
| Austin MSA, Home Prices | |||
| From Jun 2022 peak | MoM | YoY | Since 2000 |
| -23.3% | -0.8% | -3.4% | 154% |
The Austin MSA includes the five counties of Travis (Austin-Round Rock), Williamson, Hays, Caldwell, and Bastrop. The index has dropped to the lowest level since April 2021.
Over the six months from February 2021 to July 2021, prices had spiked by nearly 30%, which were then followed by additional price spikes through June 2022. Not many people bought homes at the peak of the speculative mania, and it is now getting unwound, but more slowly.

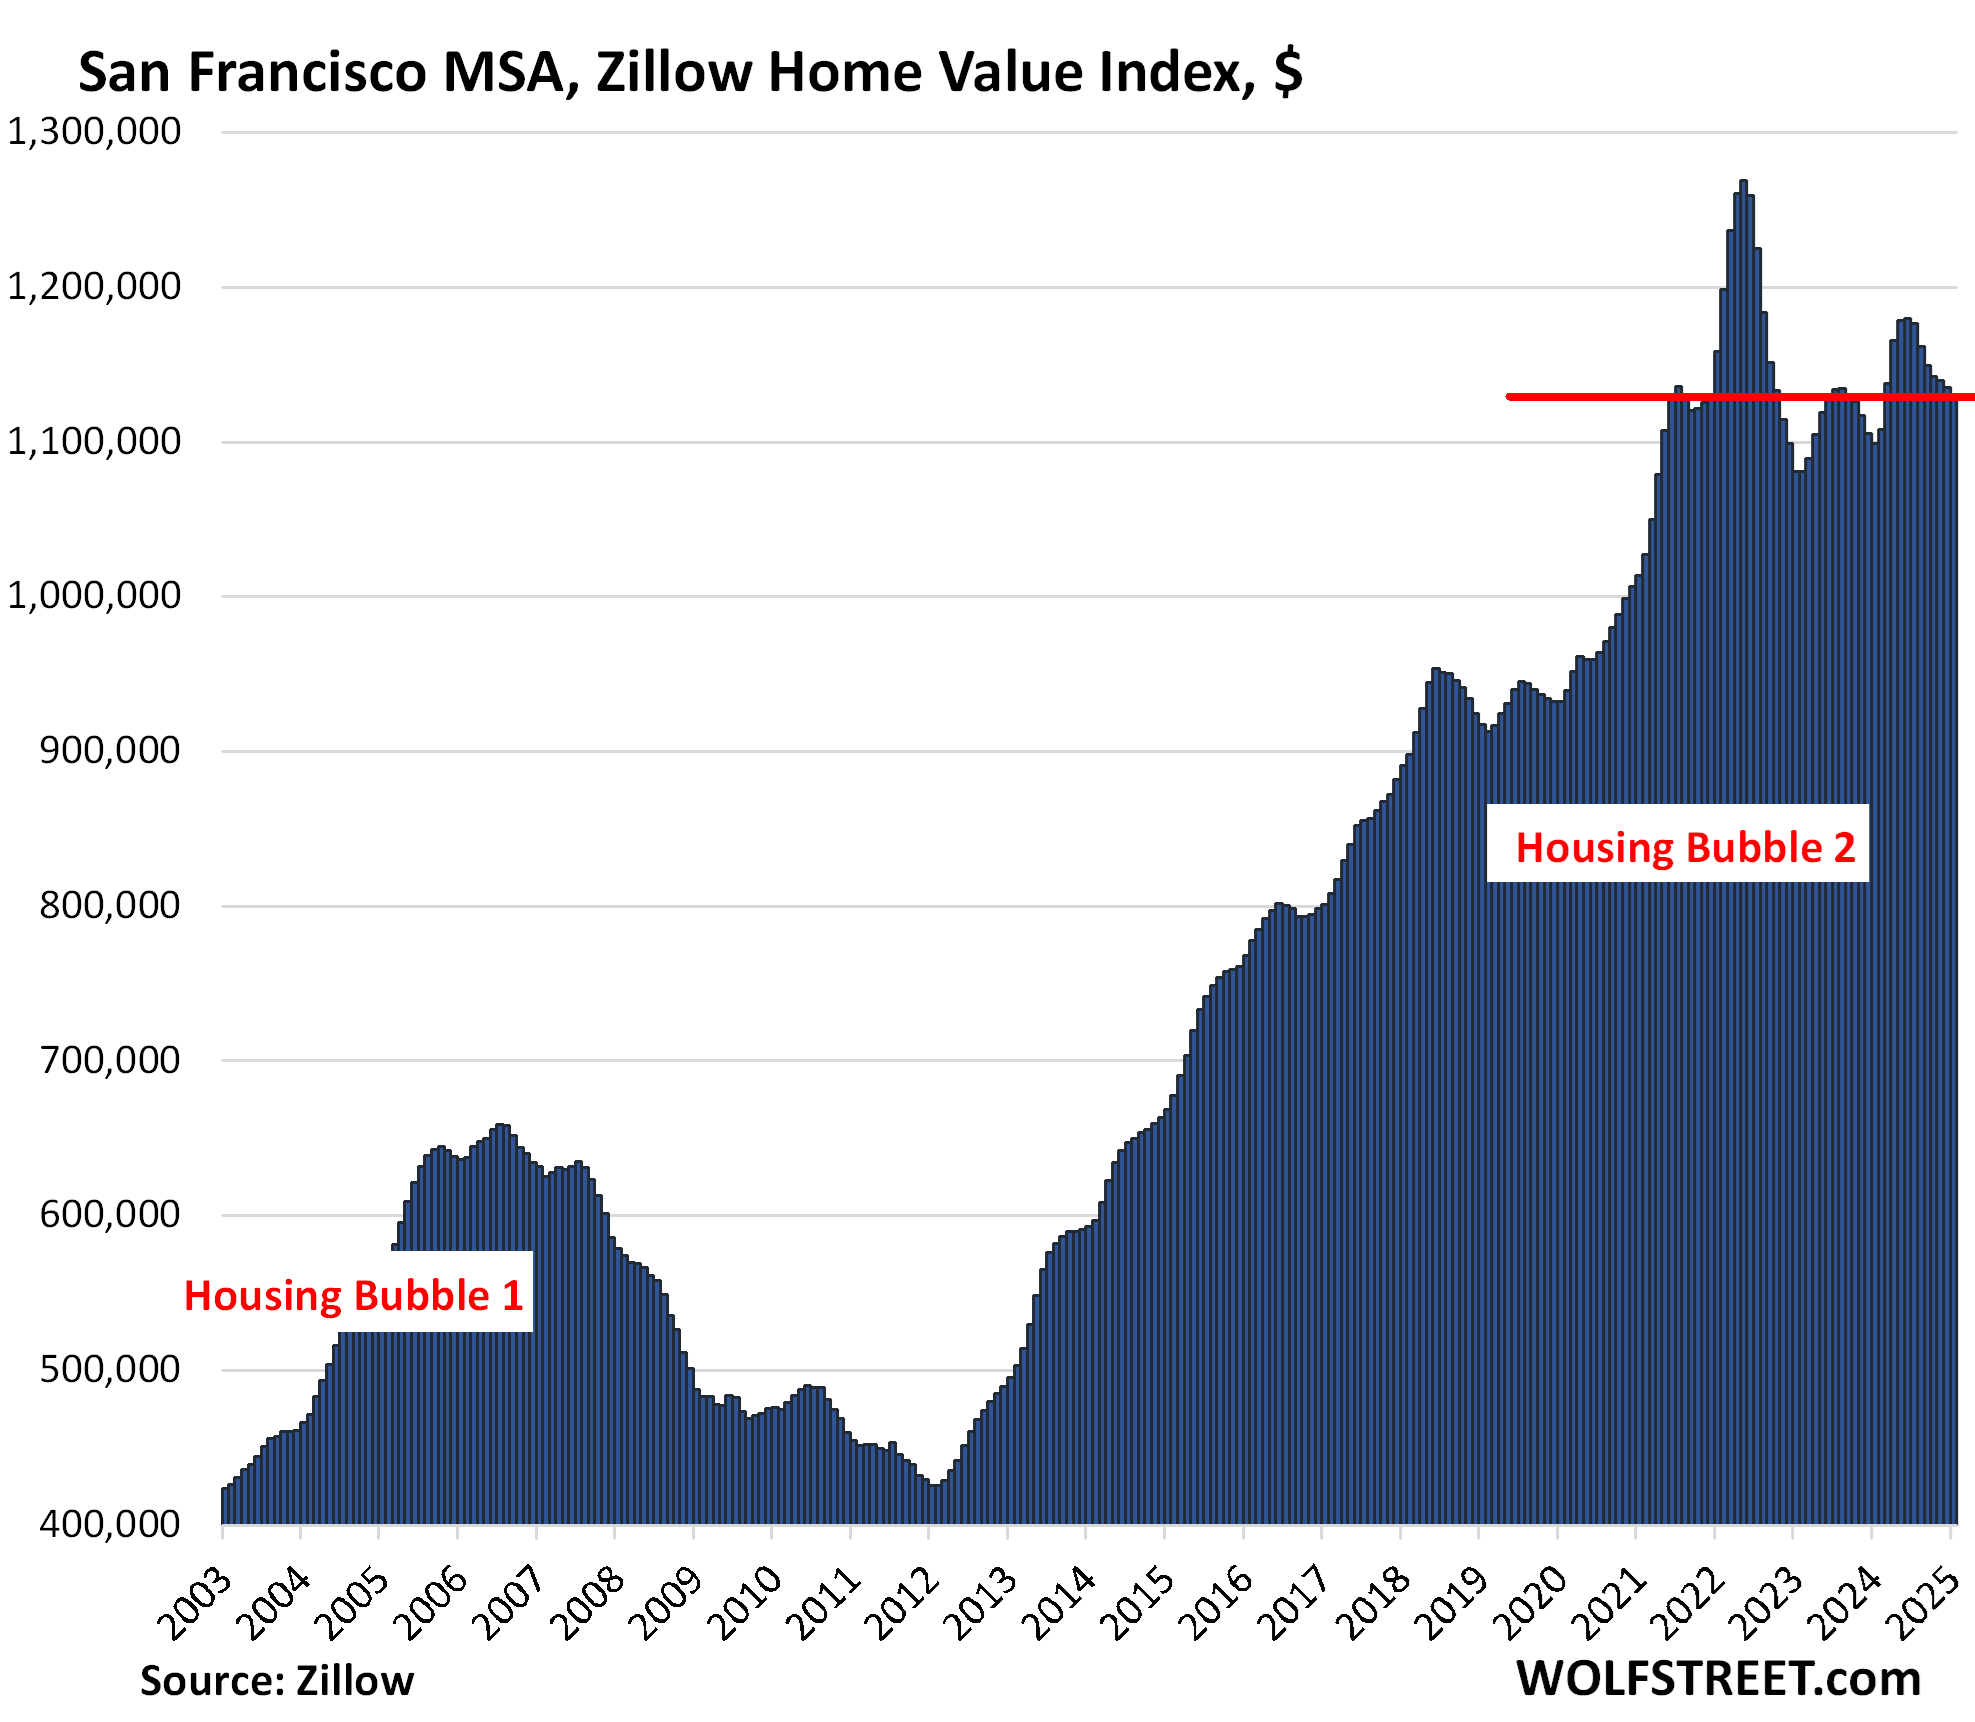
| San Francisco MSA, Home Prices | |||
| From May 2022 peak | MoM | YoY | Since 2000 |
| -11.0% | -0.5% | 2.7% | 288% |
Prices in the San Francisco metro are back where they’d first been in June 2021. The MSA includes San Francisco, Oakland, much of the East Bay, much of the North Bay, and goes south on the Peninsula into Silicon Valley through San Mateo County.
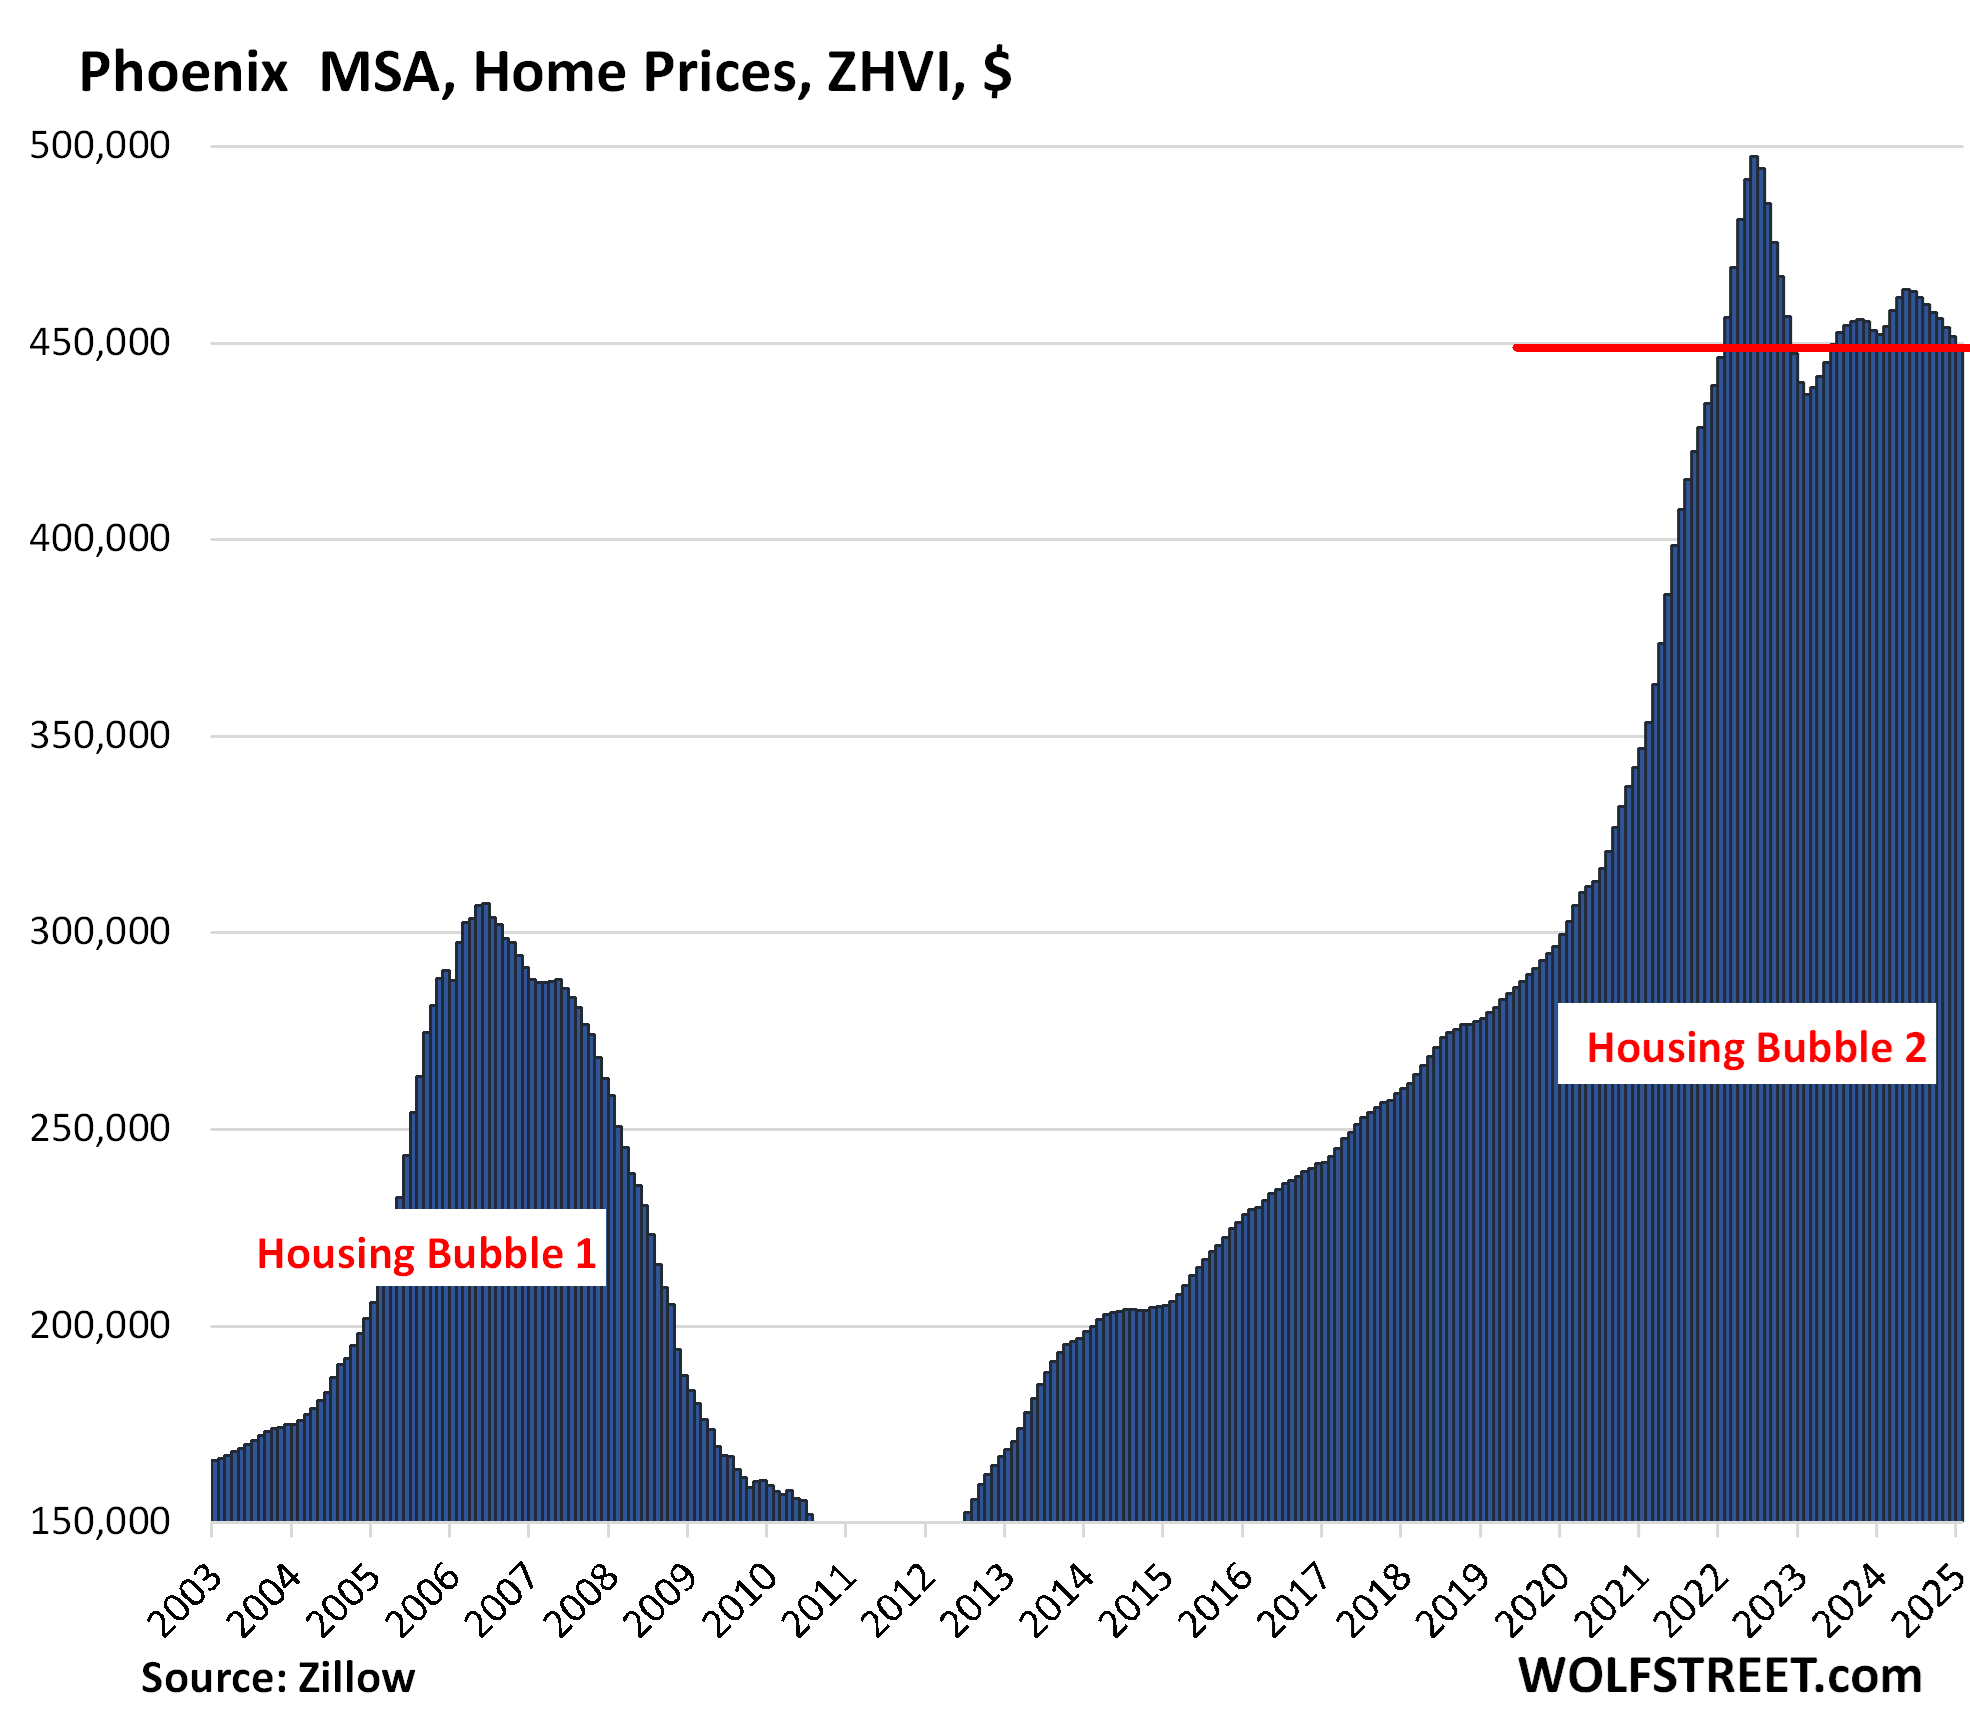
| Phoenix MSA, Home Prices | |||
| From Jun 2022 peak | MoM | YoY | Since 2000 |
| -9.8% | -0.6% | -0.8% | 217% |
Prices are back where they’d first been in February 2022:
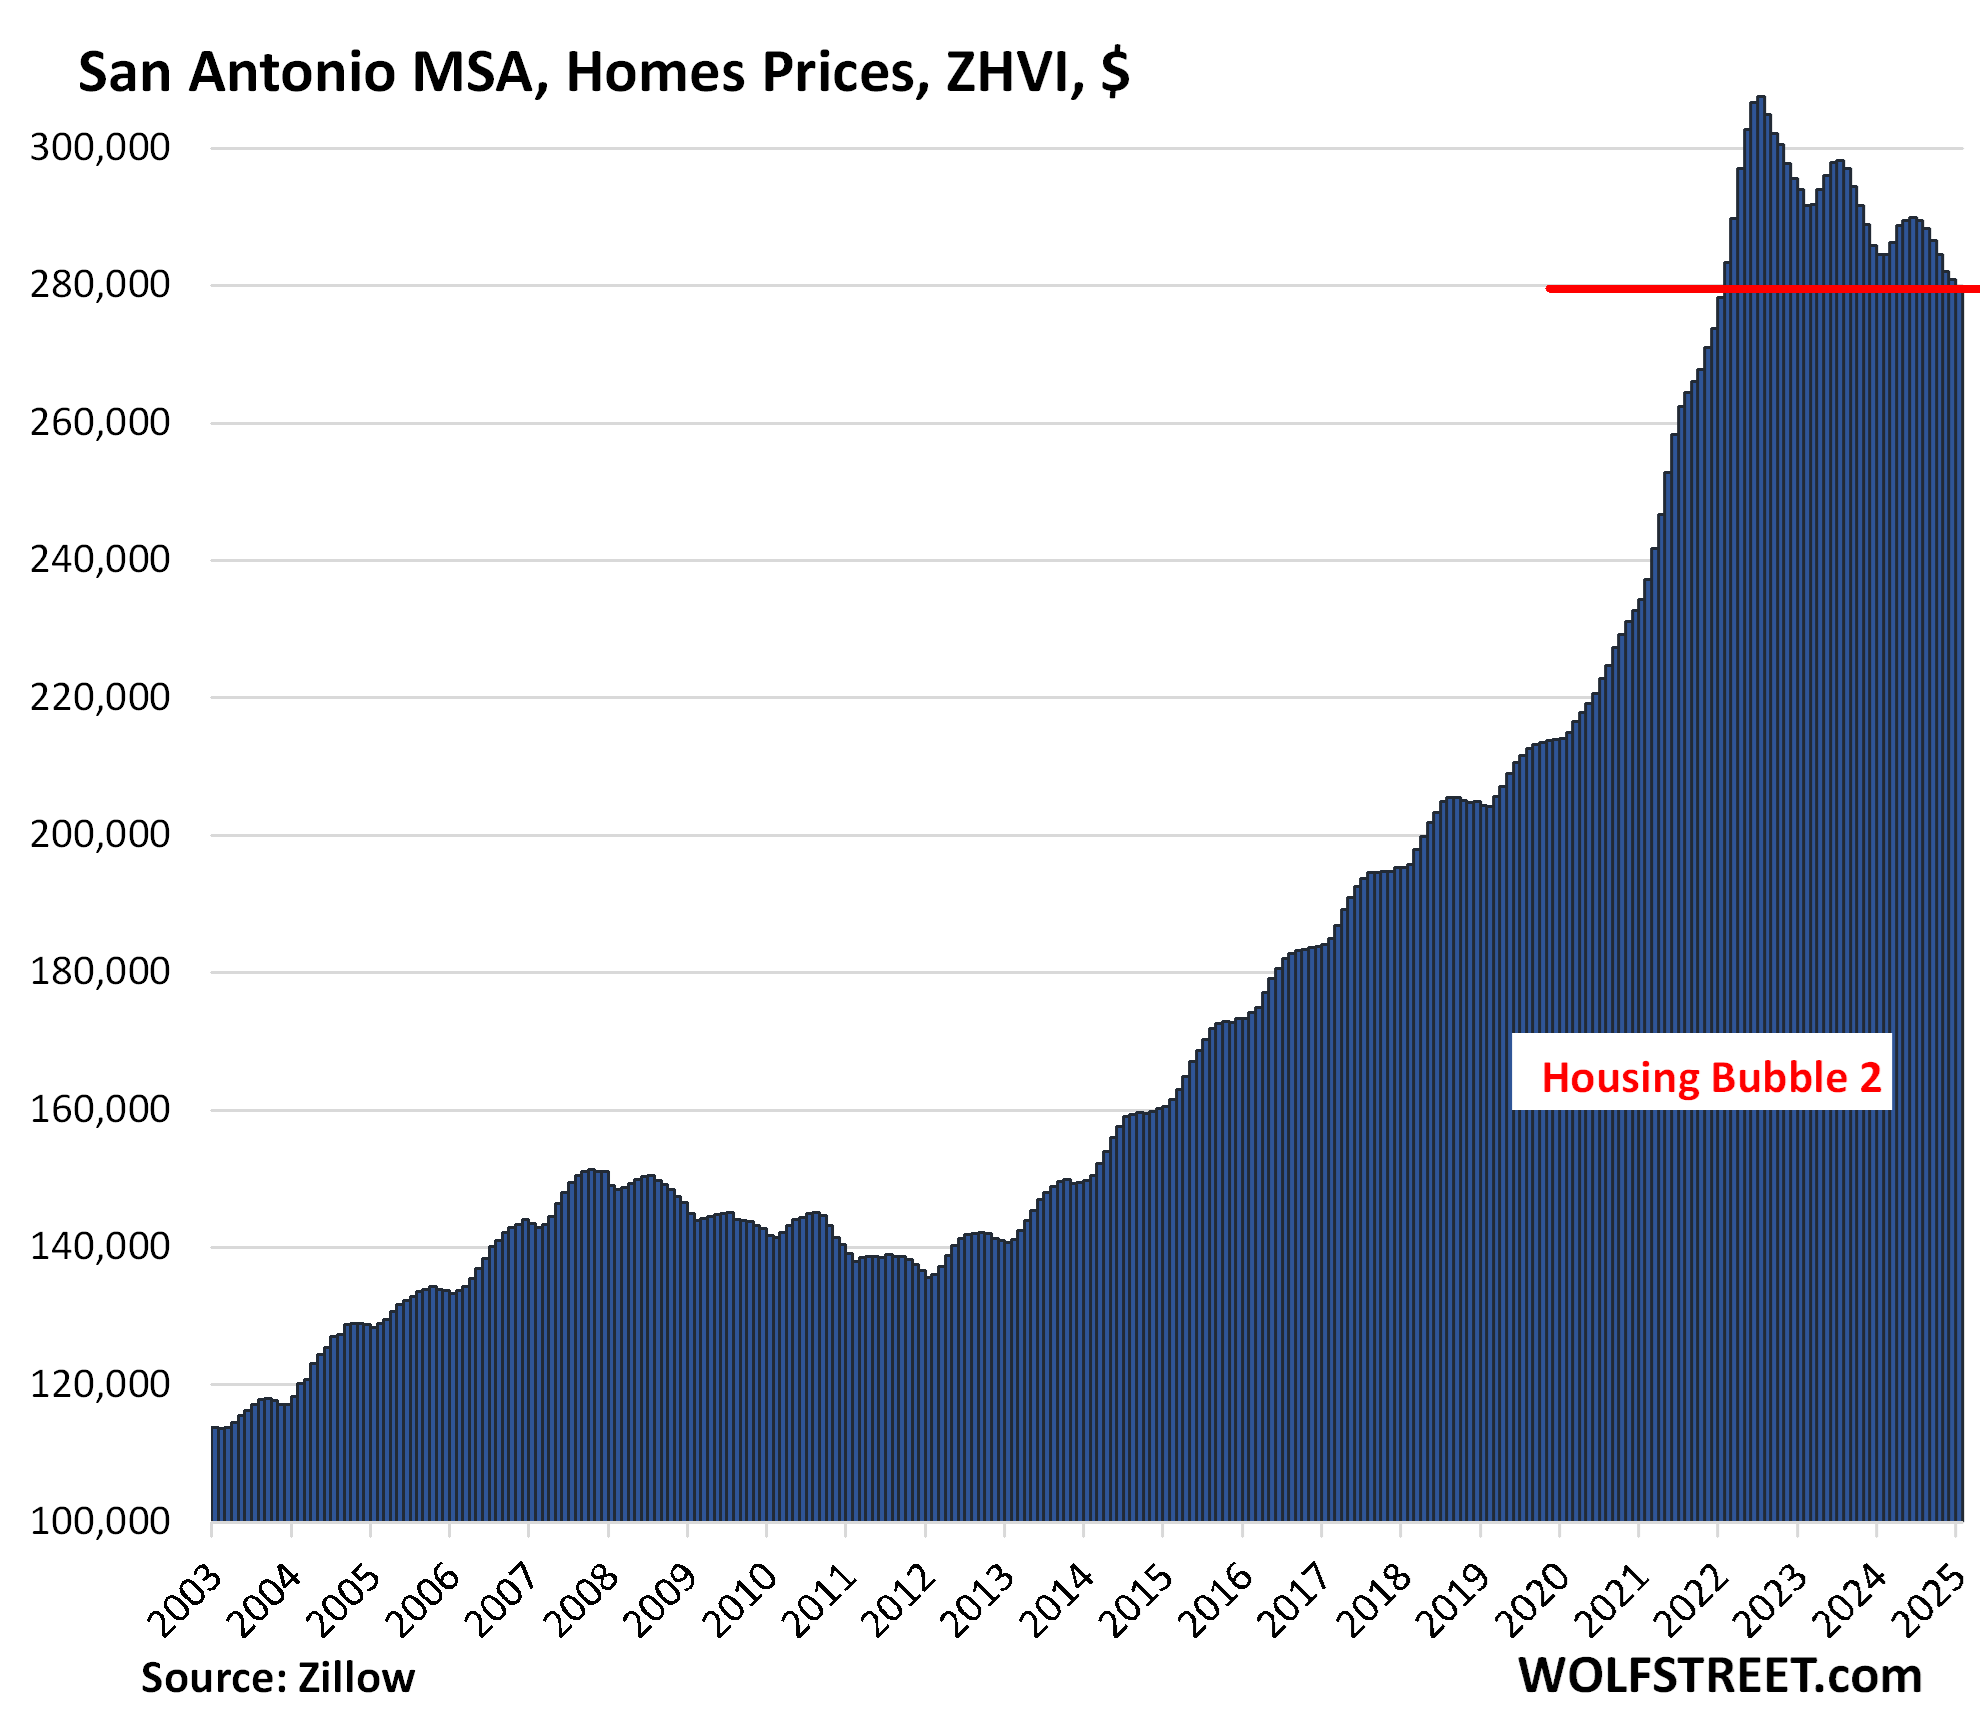
| San Antonio MSA, Home Prices | |||
| From Jul 2022 peak | MoM | YoY | Since 2000 |
| -9.1% | -0.5% | -1.8% | 146.3% |
Prices have dropped to the lowest level since January 2022.
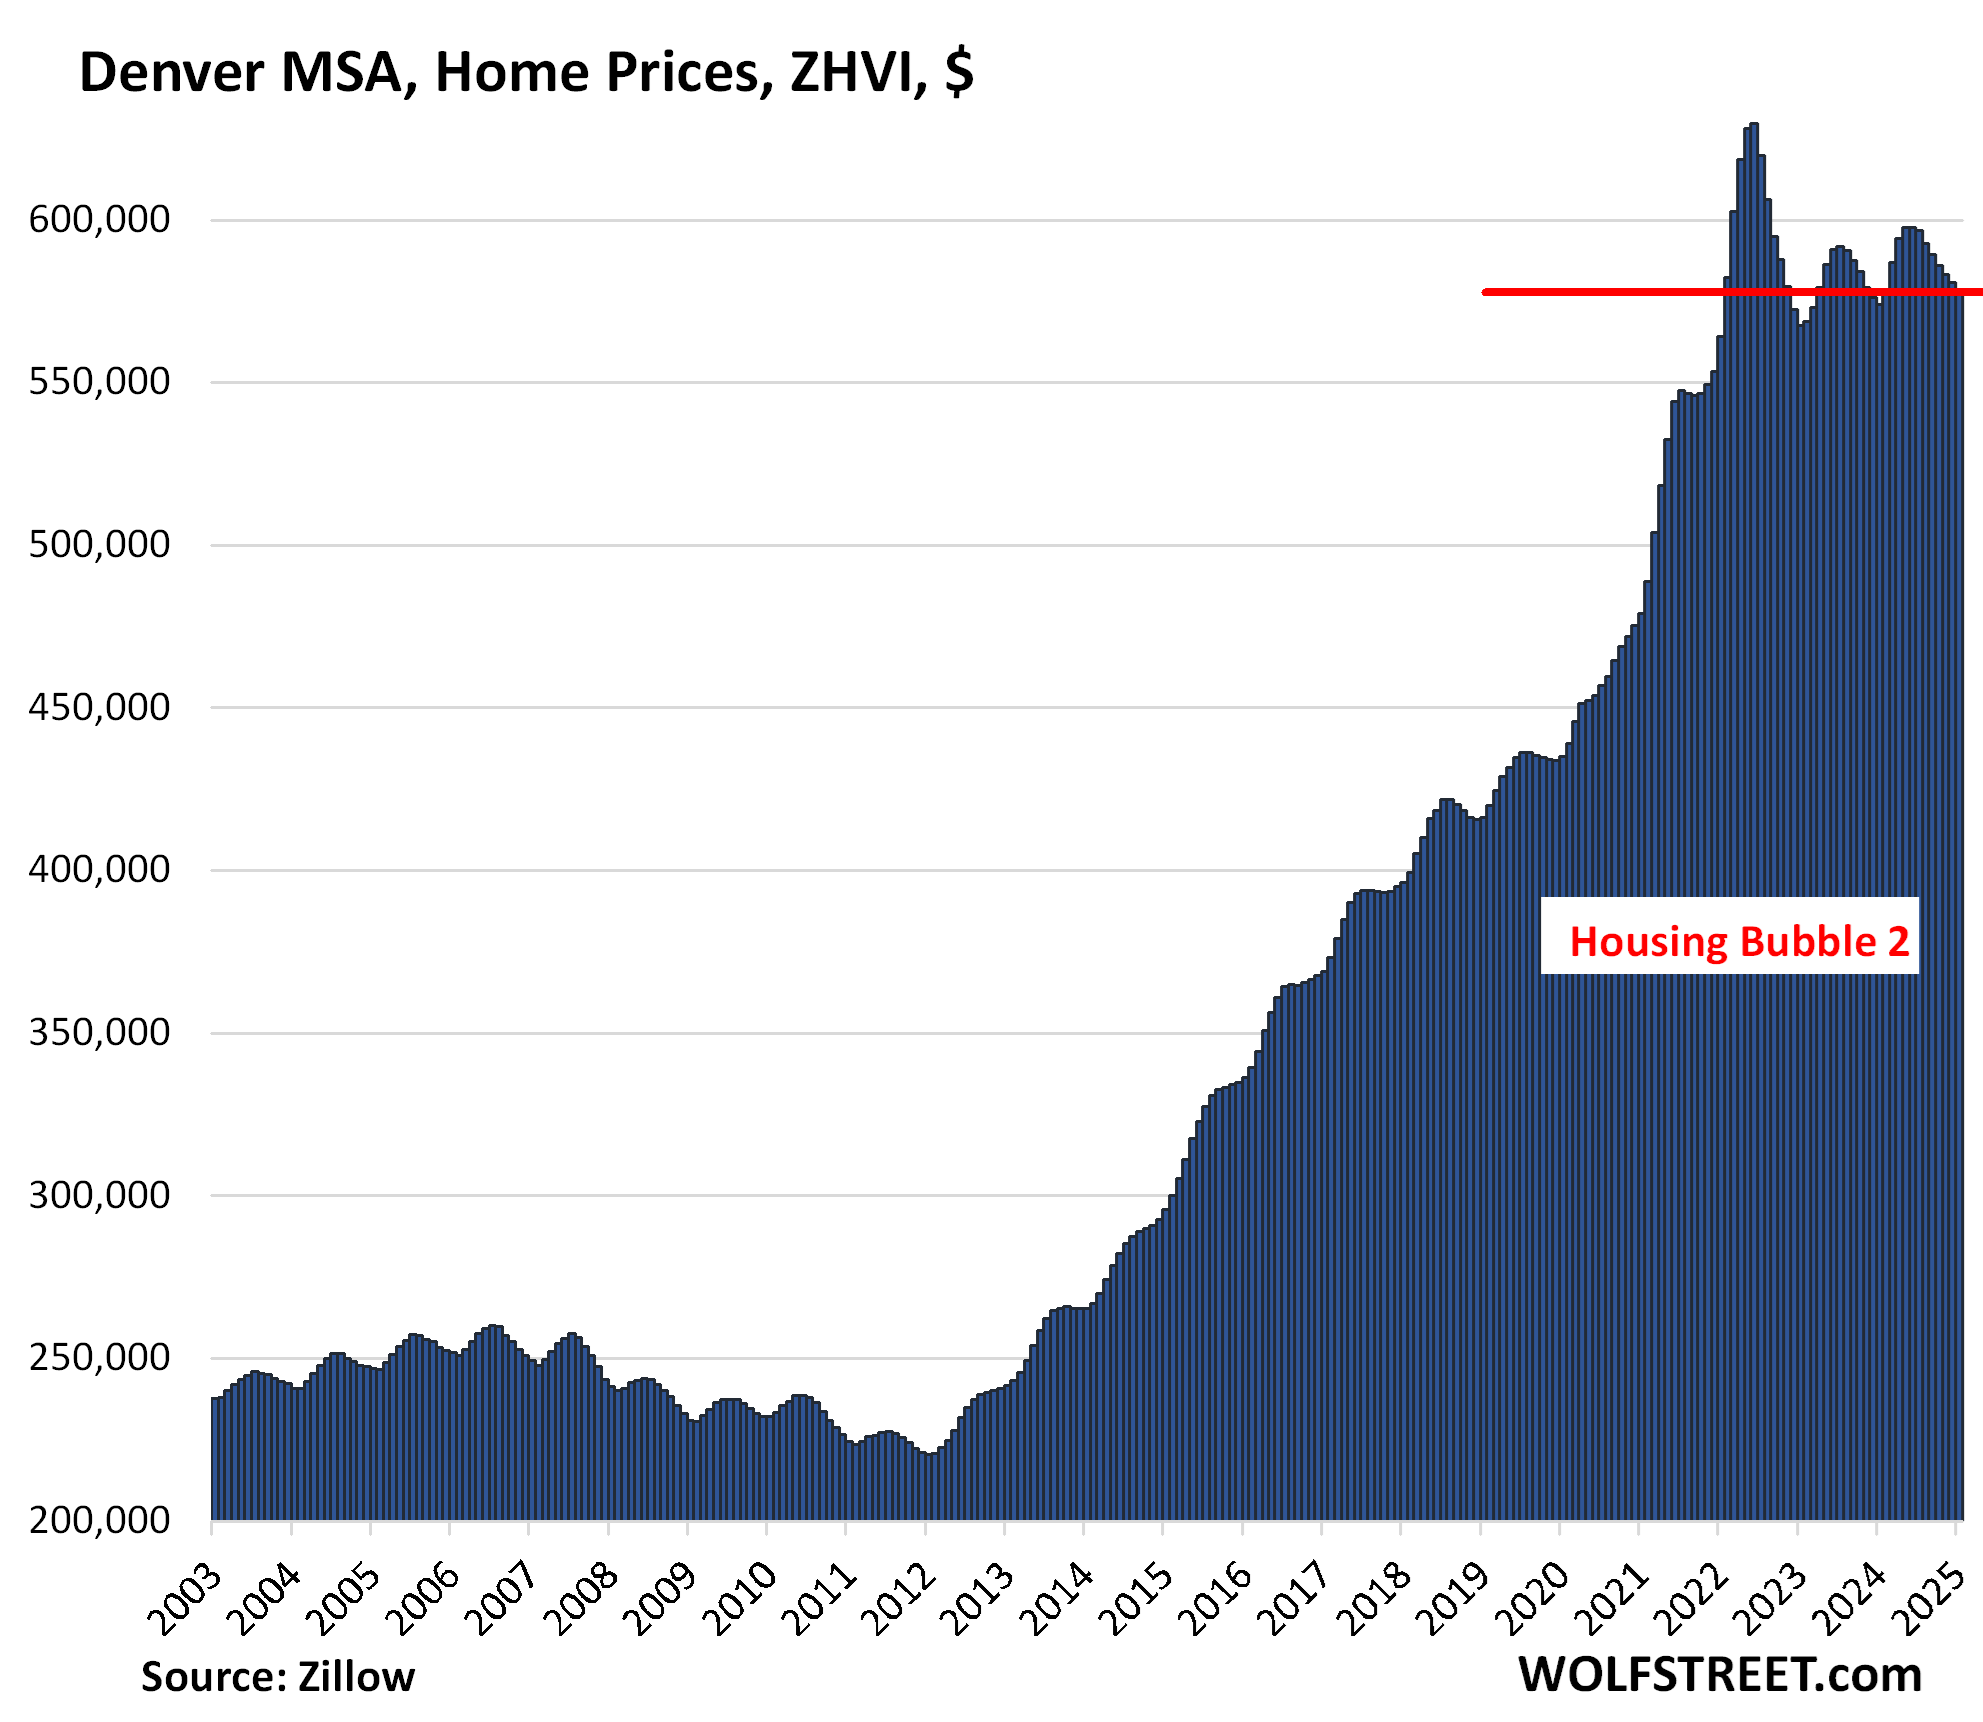
| Denver MSA, Home Prices | |||
| From Jun 2022 peak | MoM | YoY | Since 2000 |
| -8.2% | -0.5% | 0.7% | 210% |
Prices are back where they’d first been in February 2022.
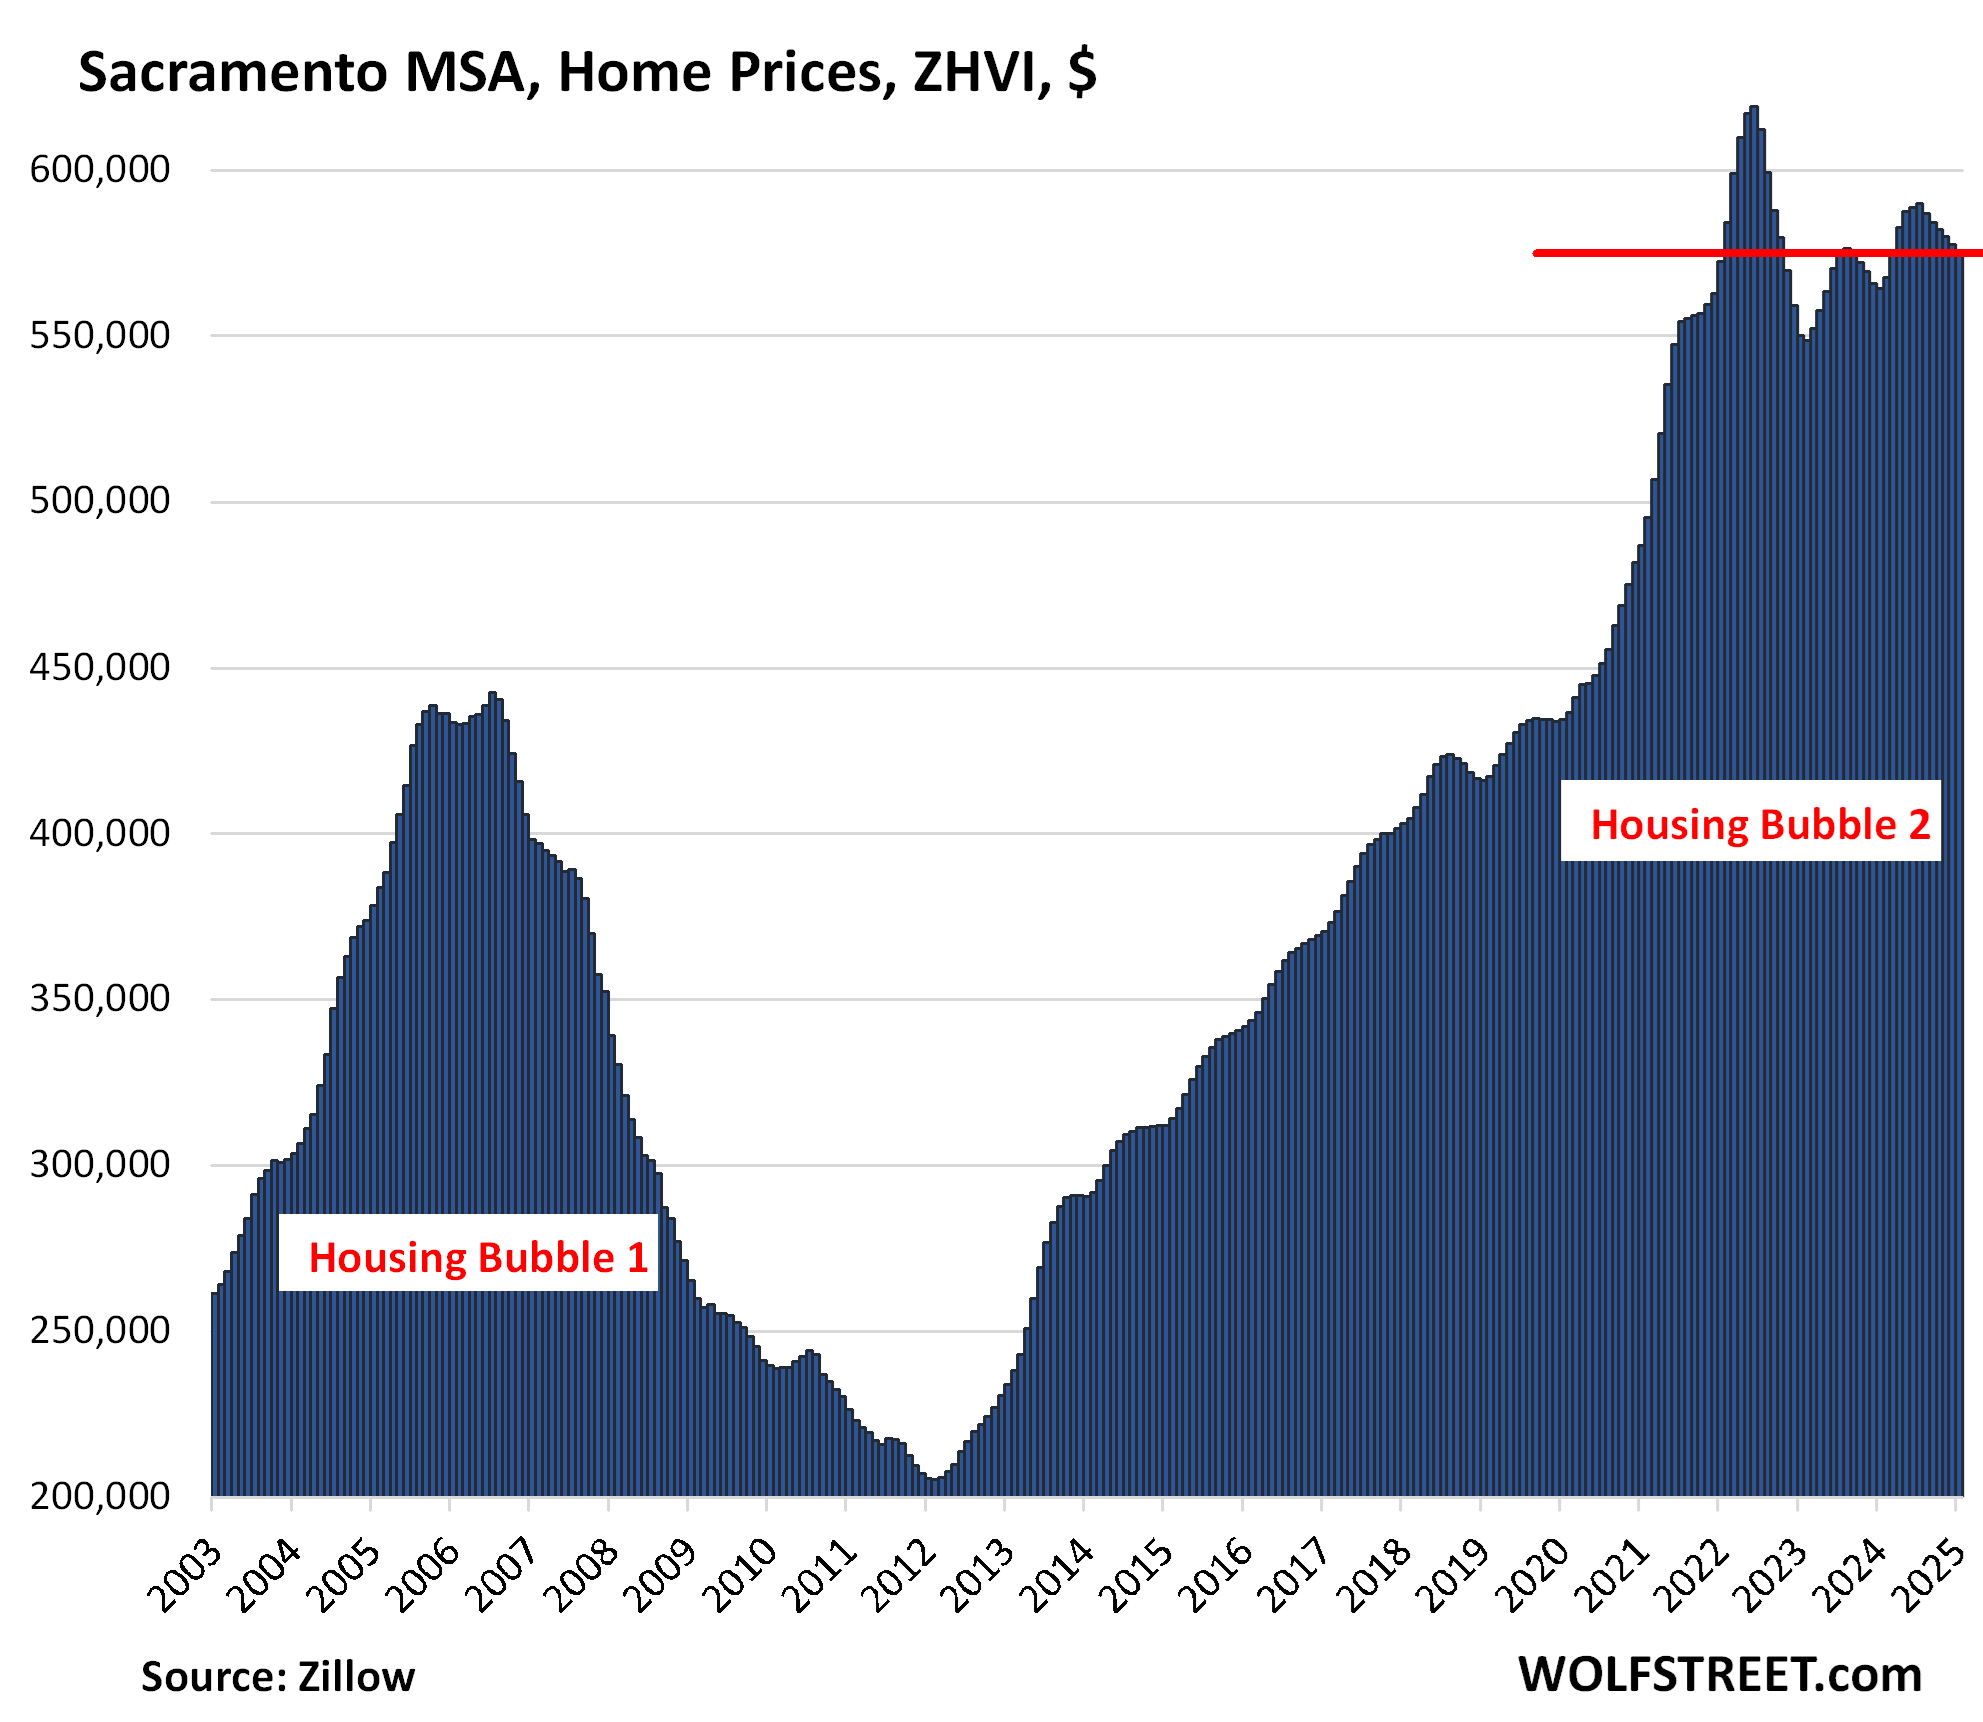
| Sacramento MSA, Home Prices | |||
| From July 2022 peak | MoM | YoY | Since 2000 |
| -7.2% | -0.5% | 1.9% | 243.1% |
| Dallas-Fort Worth MSA, Home Prices | |||
| From Jun 2022 peak | MoM | YoY | Since 2000 |
| -6.9% | -0.5% | -0.7% | 190% |
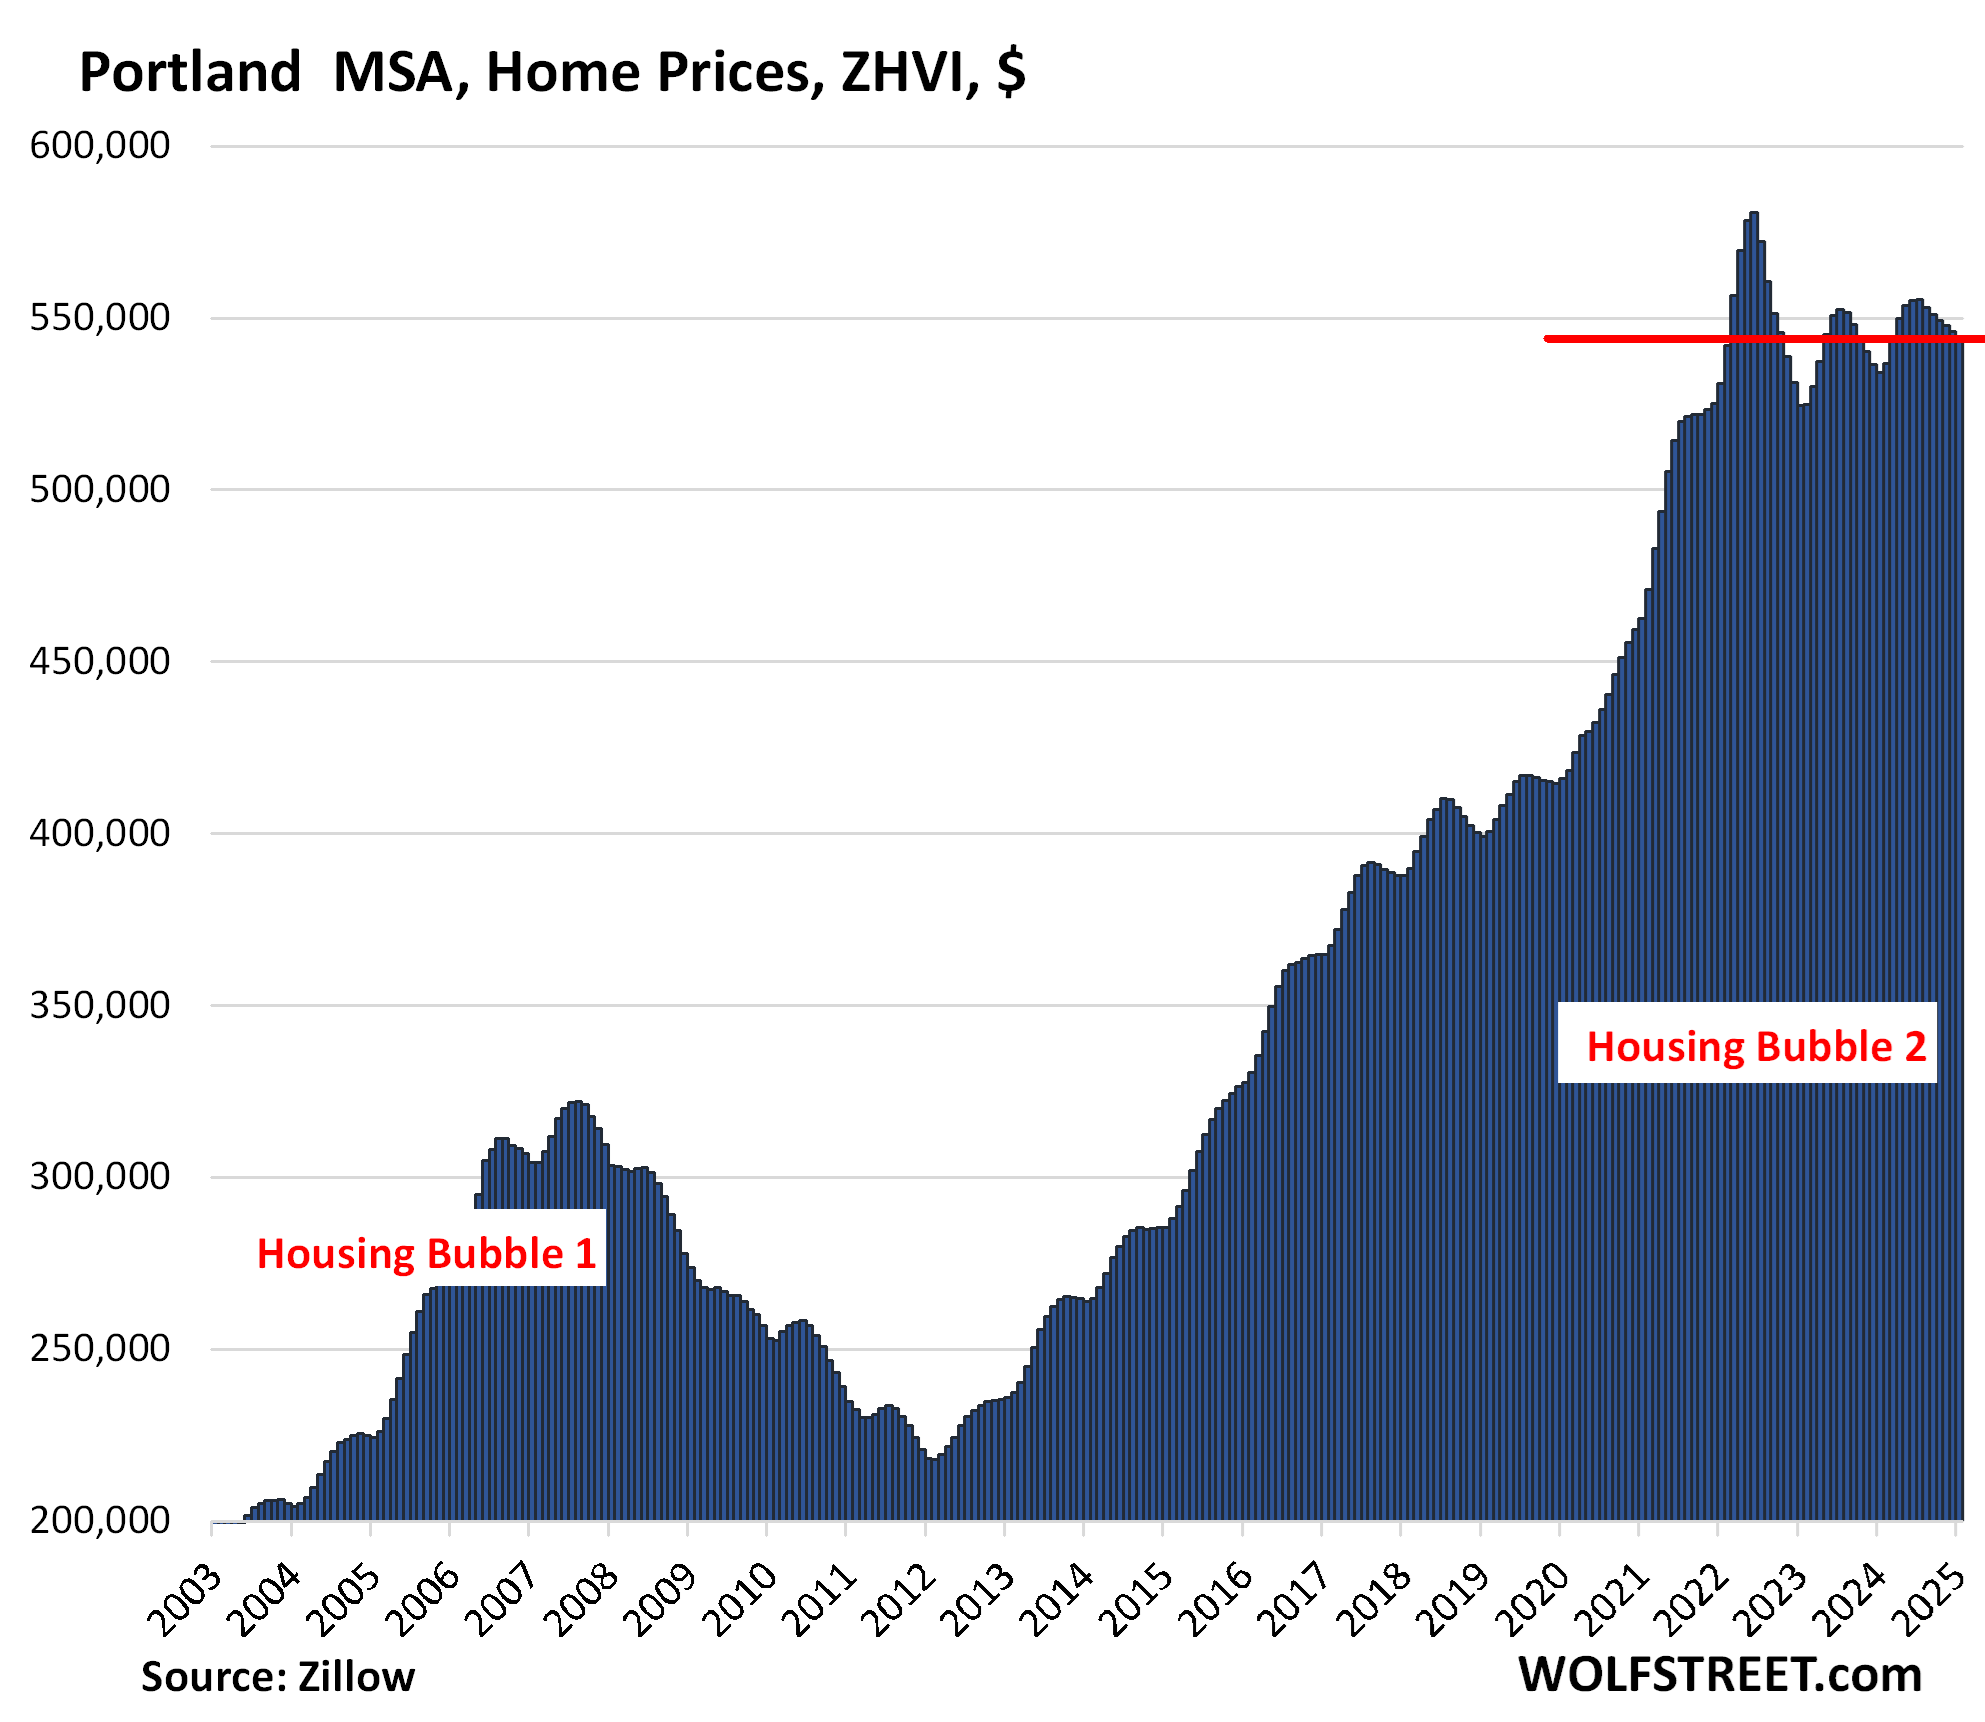
| Portland MSA, Home Prices | |||
| From May 2022 peak | MoM | YoY | Since 2000 |
| -6.4% | -0.5% | 1.7% | 215% |
Prices are back where they’d first been in January 2022.
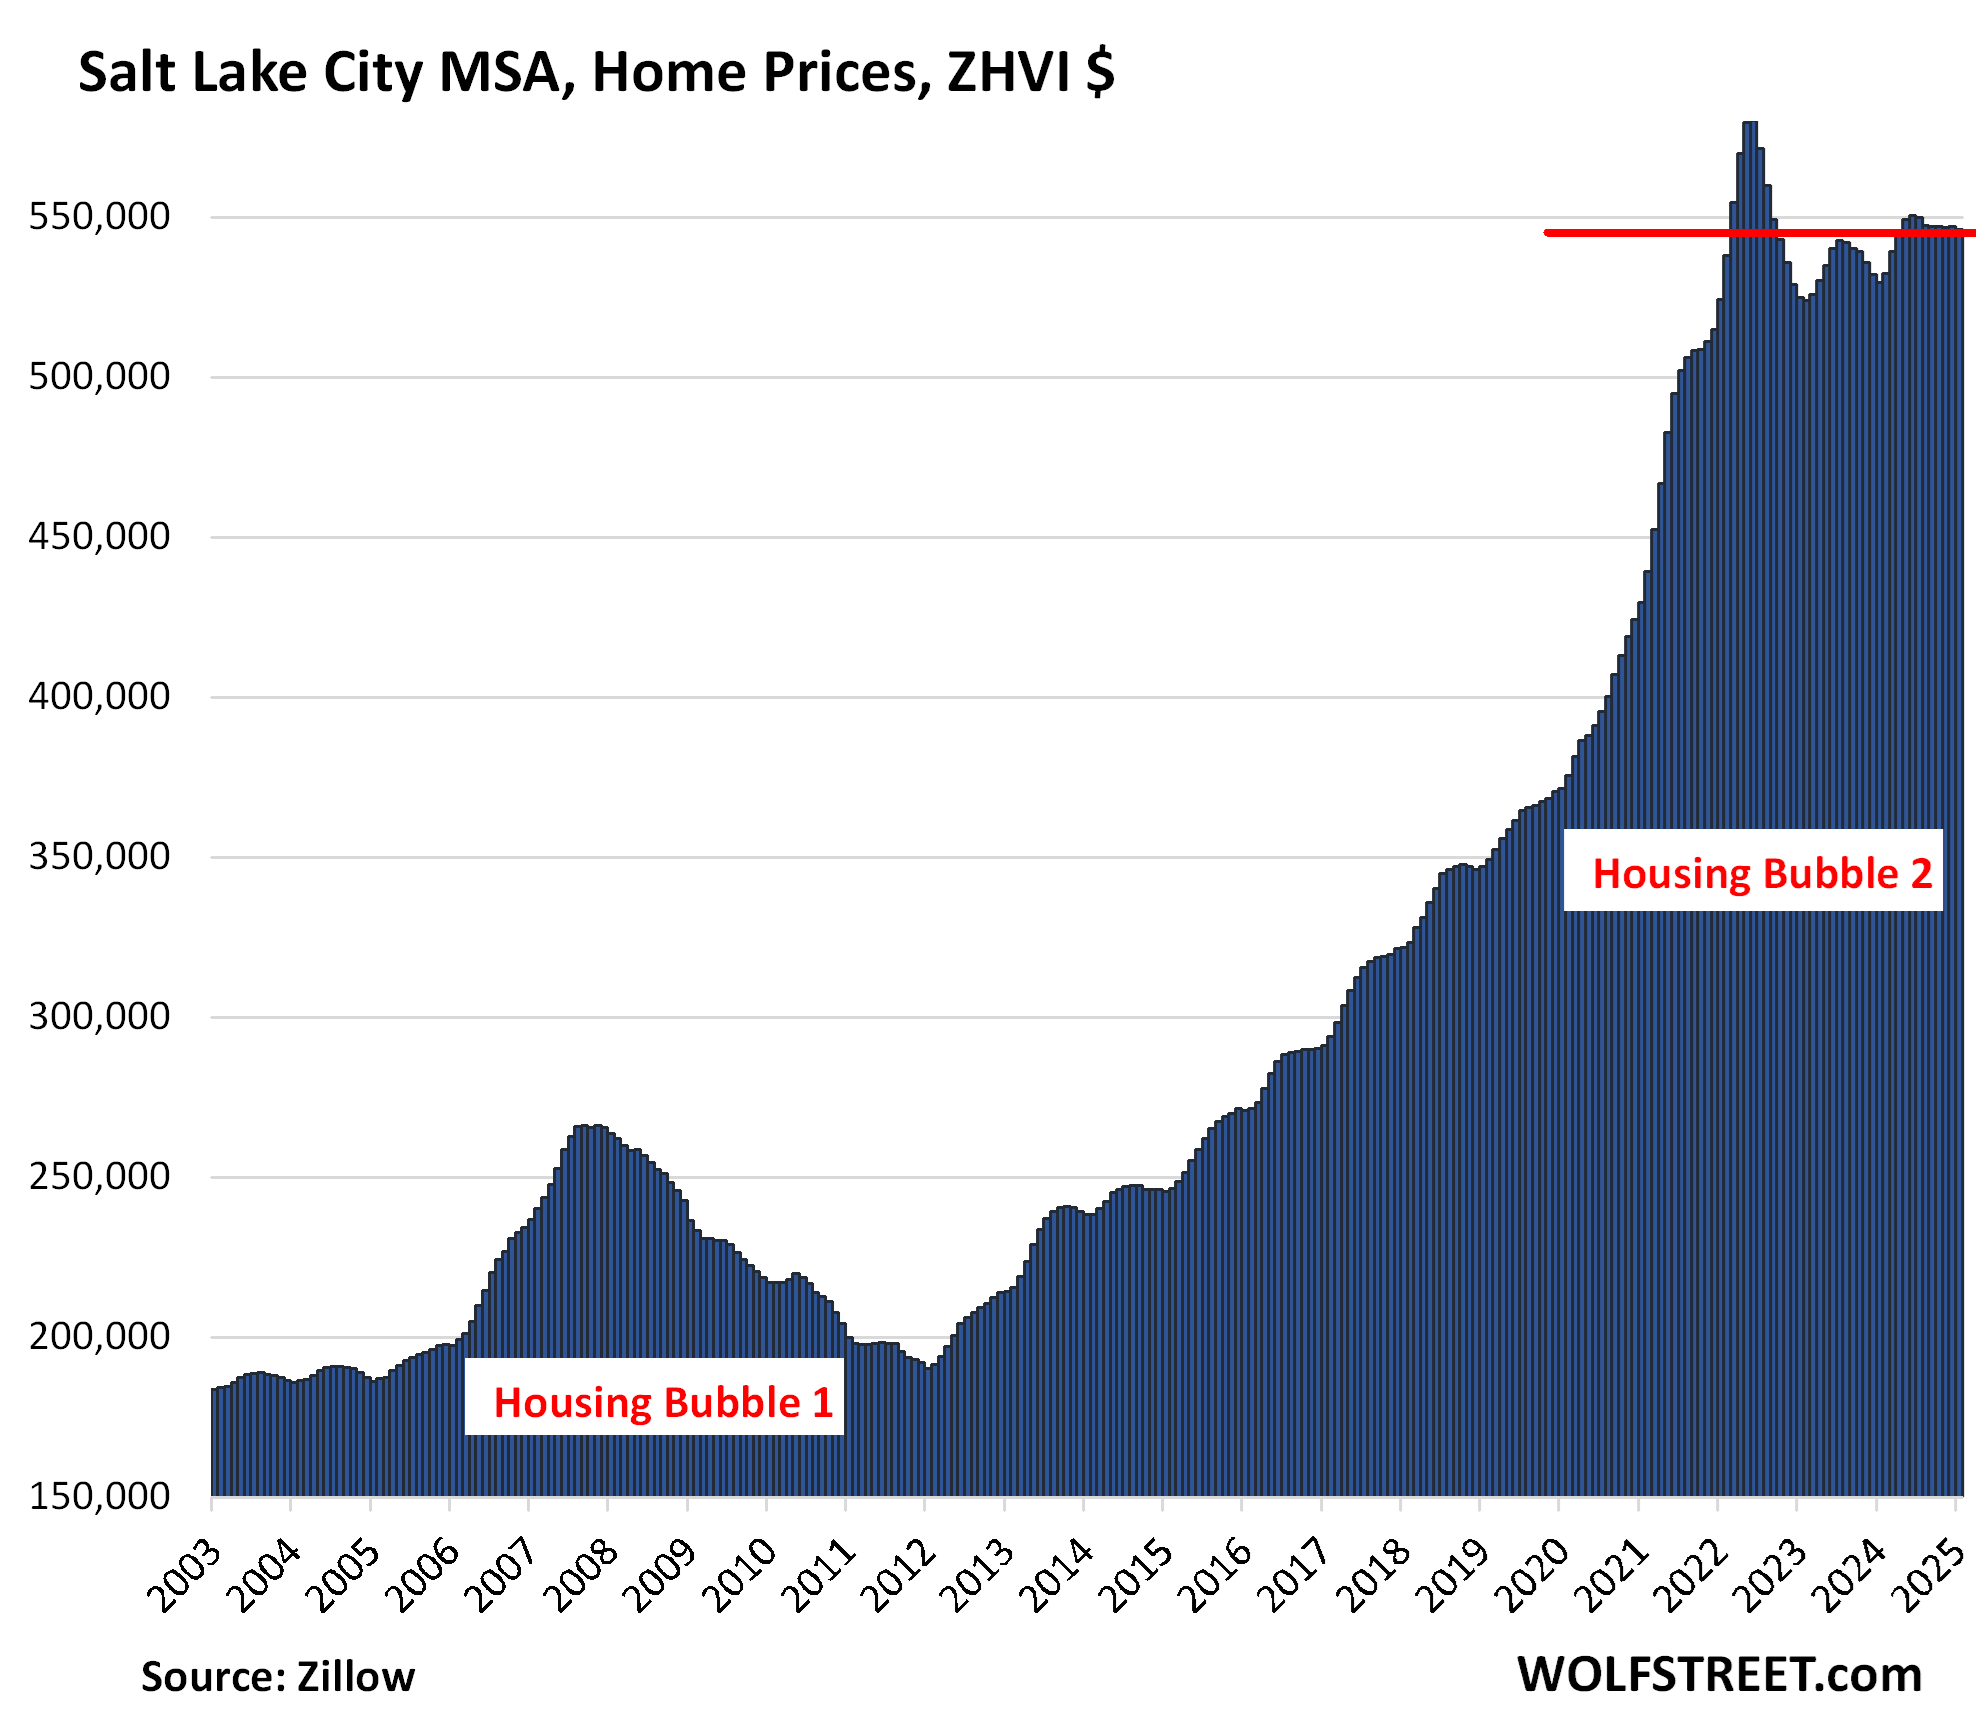
| Salt Lake City MSA, Home Prices | |||
| From July 2022 peak | MoM | YoY | Since 2000 |
| -5.9% | -0.2% | 3.1% | 213% |
Back to March 2022:
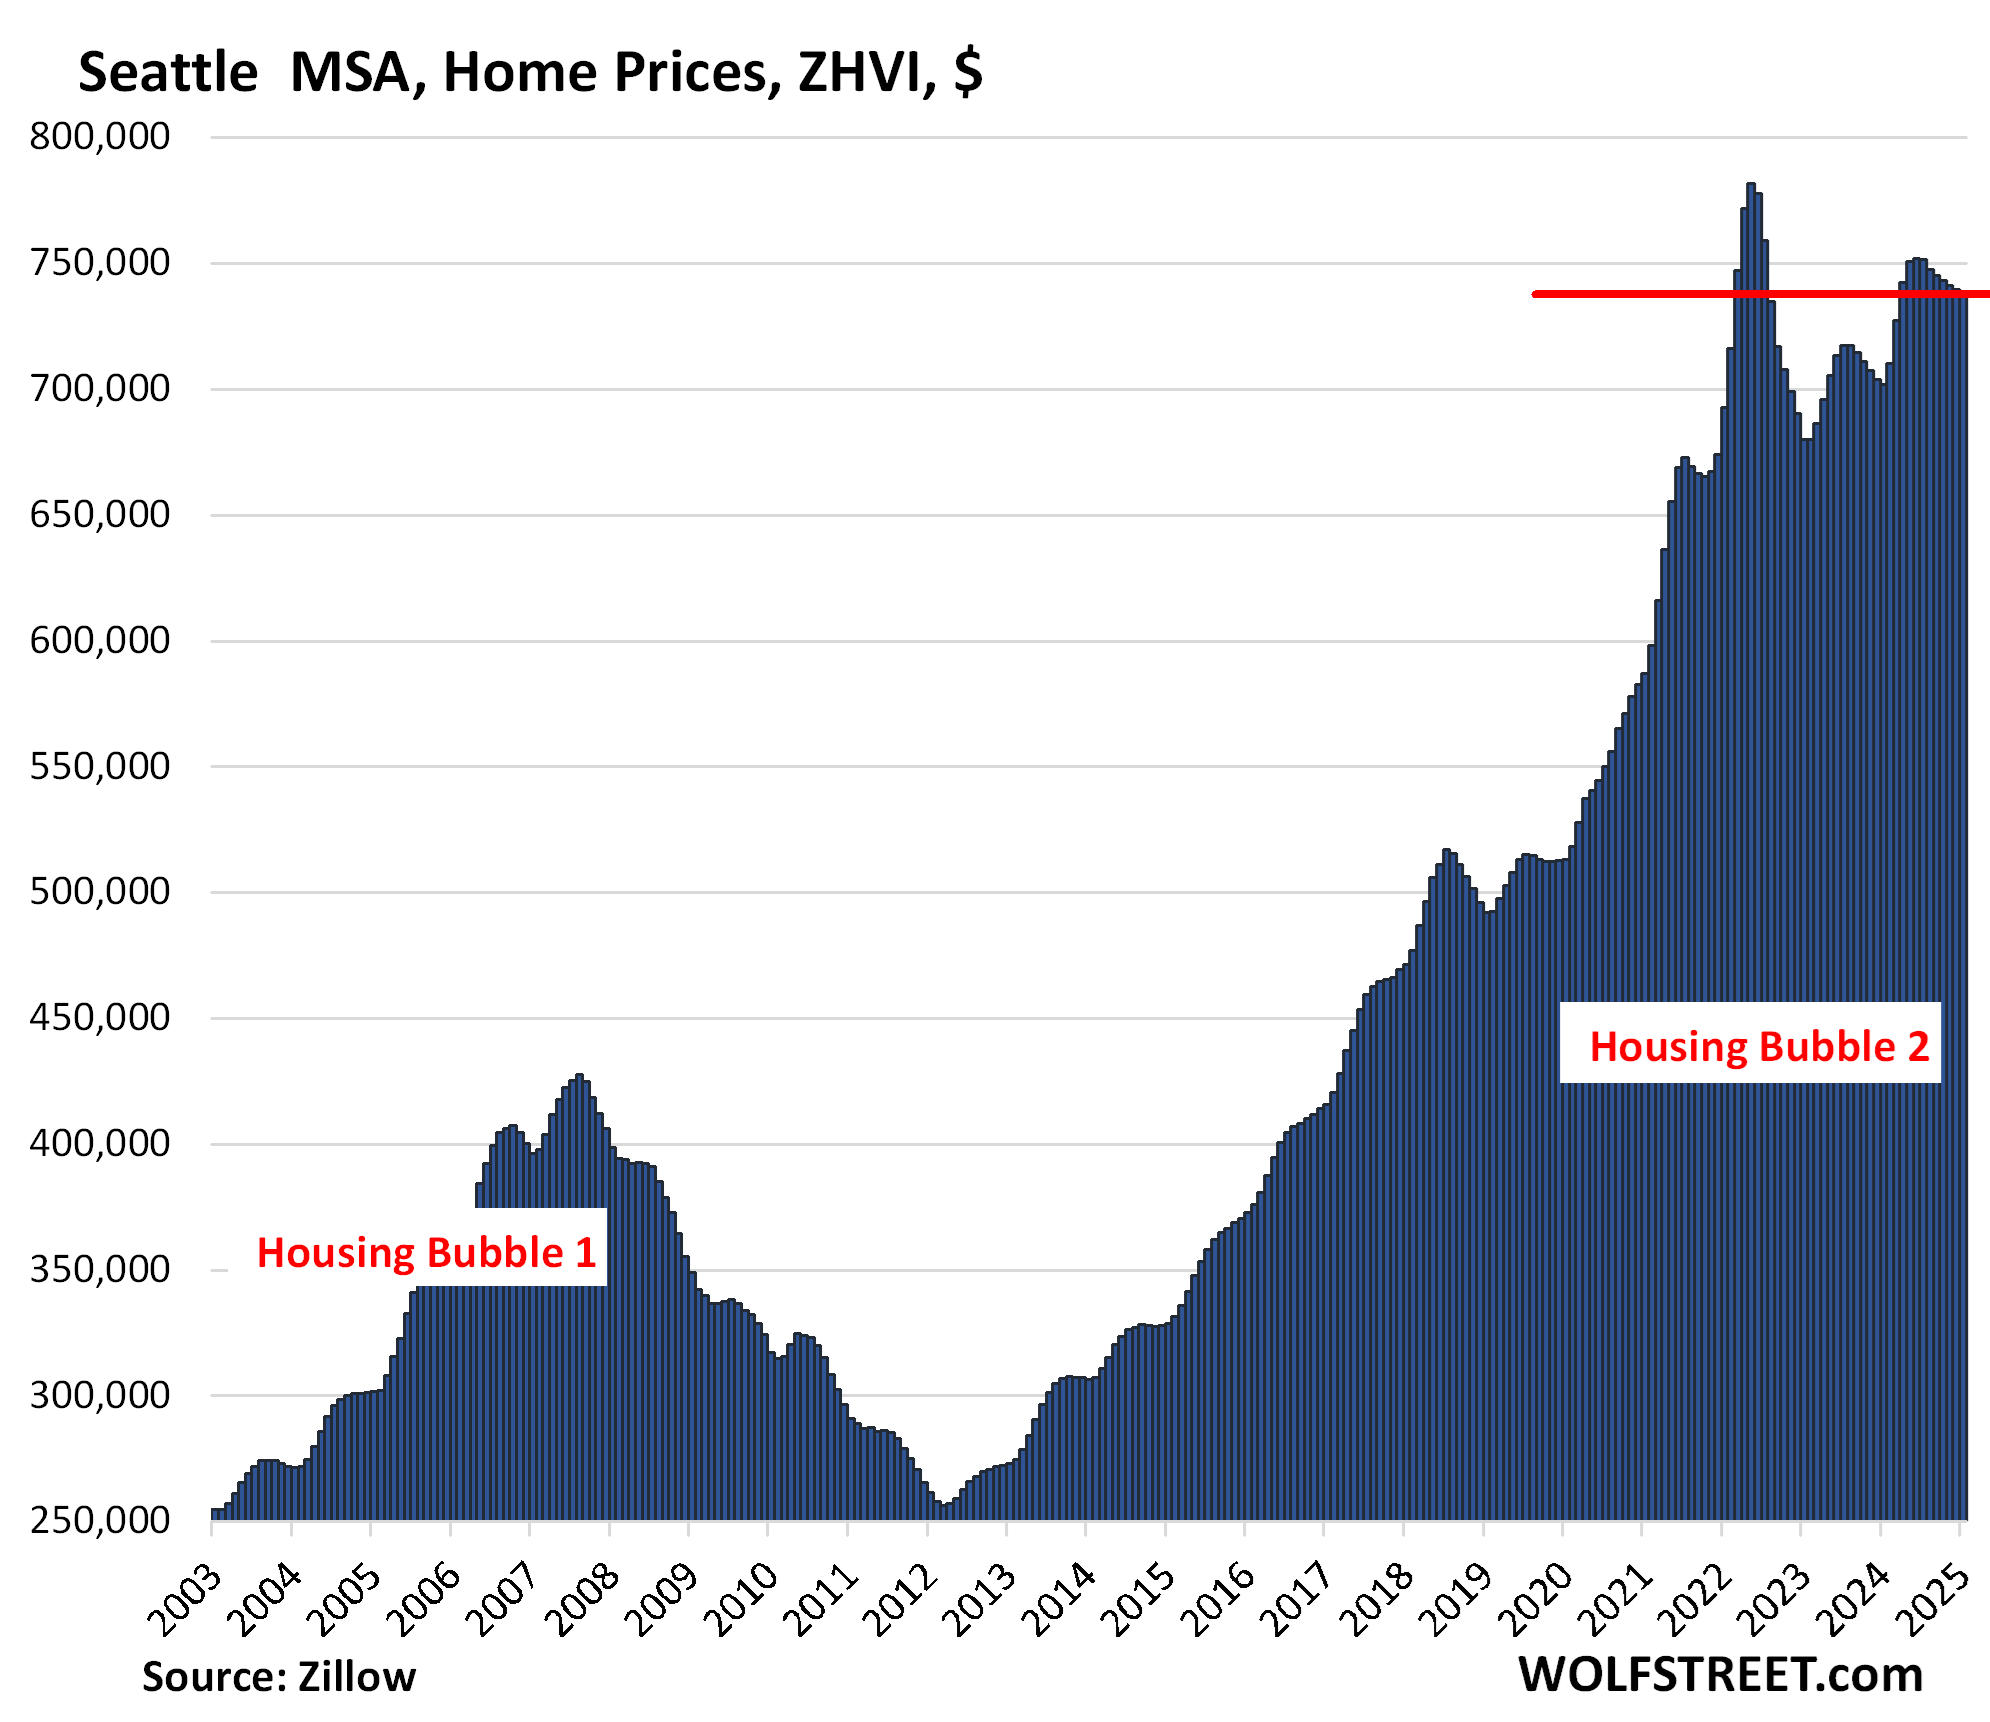
| Seattle MSA, Home Prices | |||
| From May 2022 peak | MoM | YoY | Since 2000 |
| -5.6% | -0.3% | 5.1% | 237% |
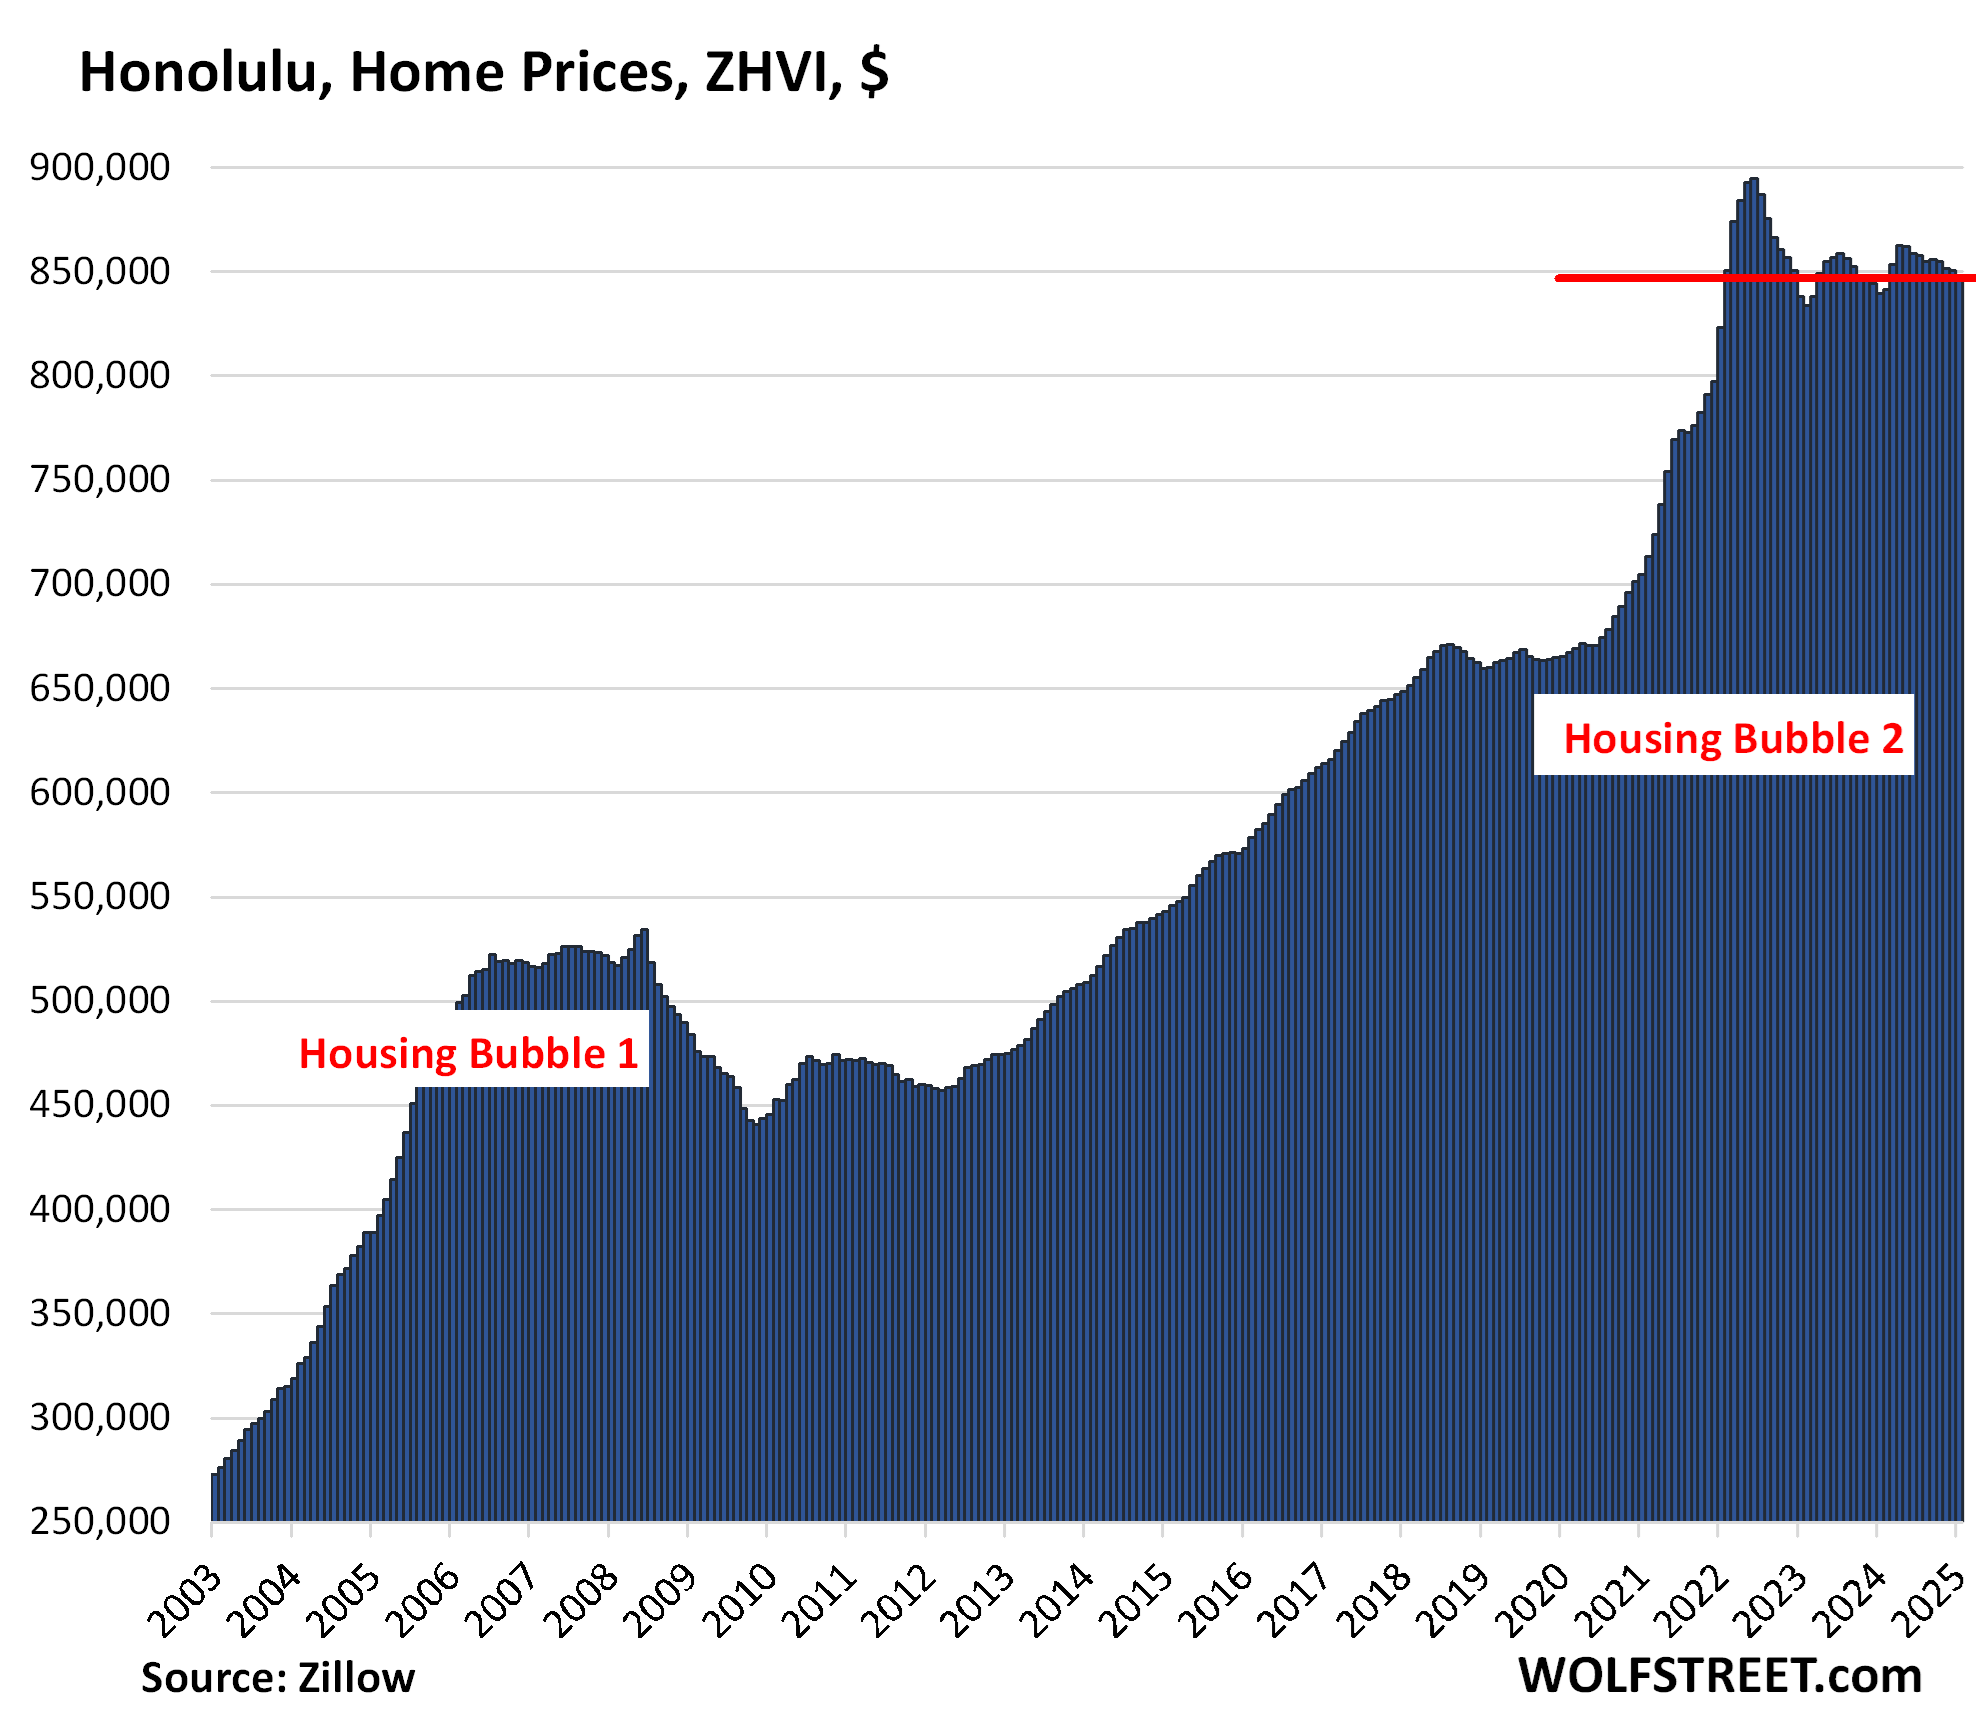
| Honolulu, Home Prices | |||
| From Jun 2022 peak | MoM | YoY | Since 2000 |
| -5.3% | -0.4% | 0.9% | 278% |
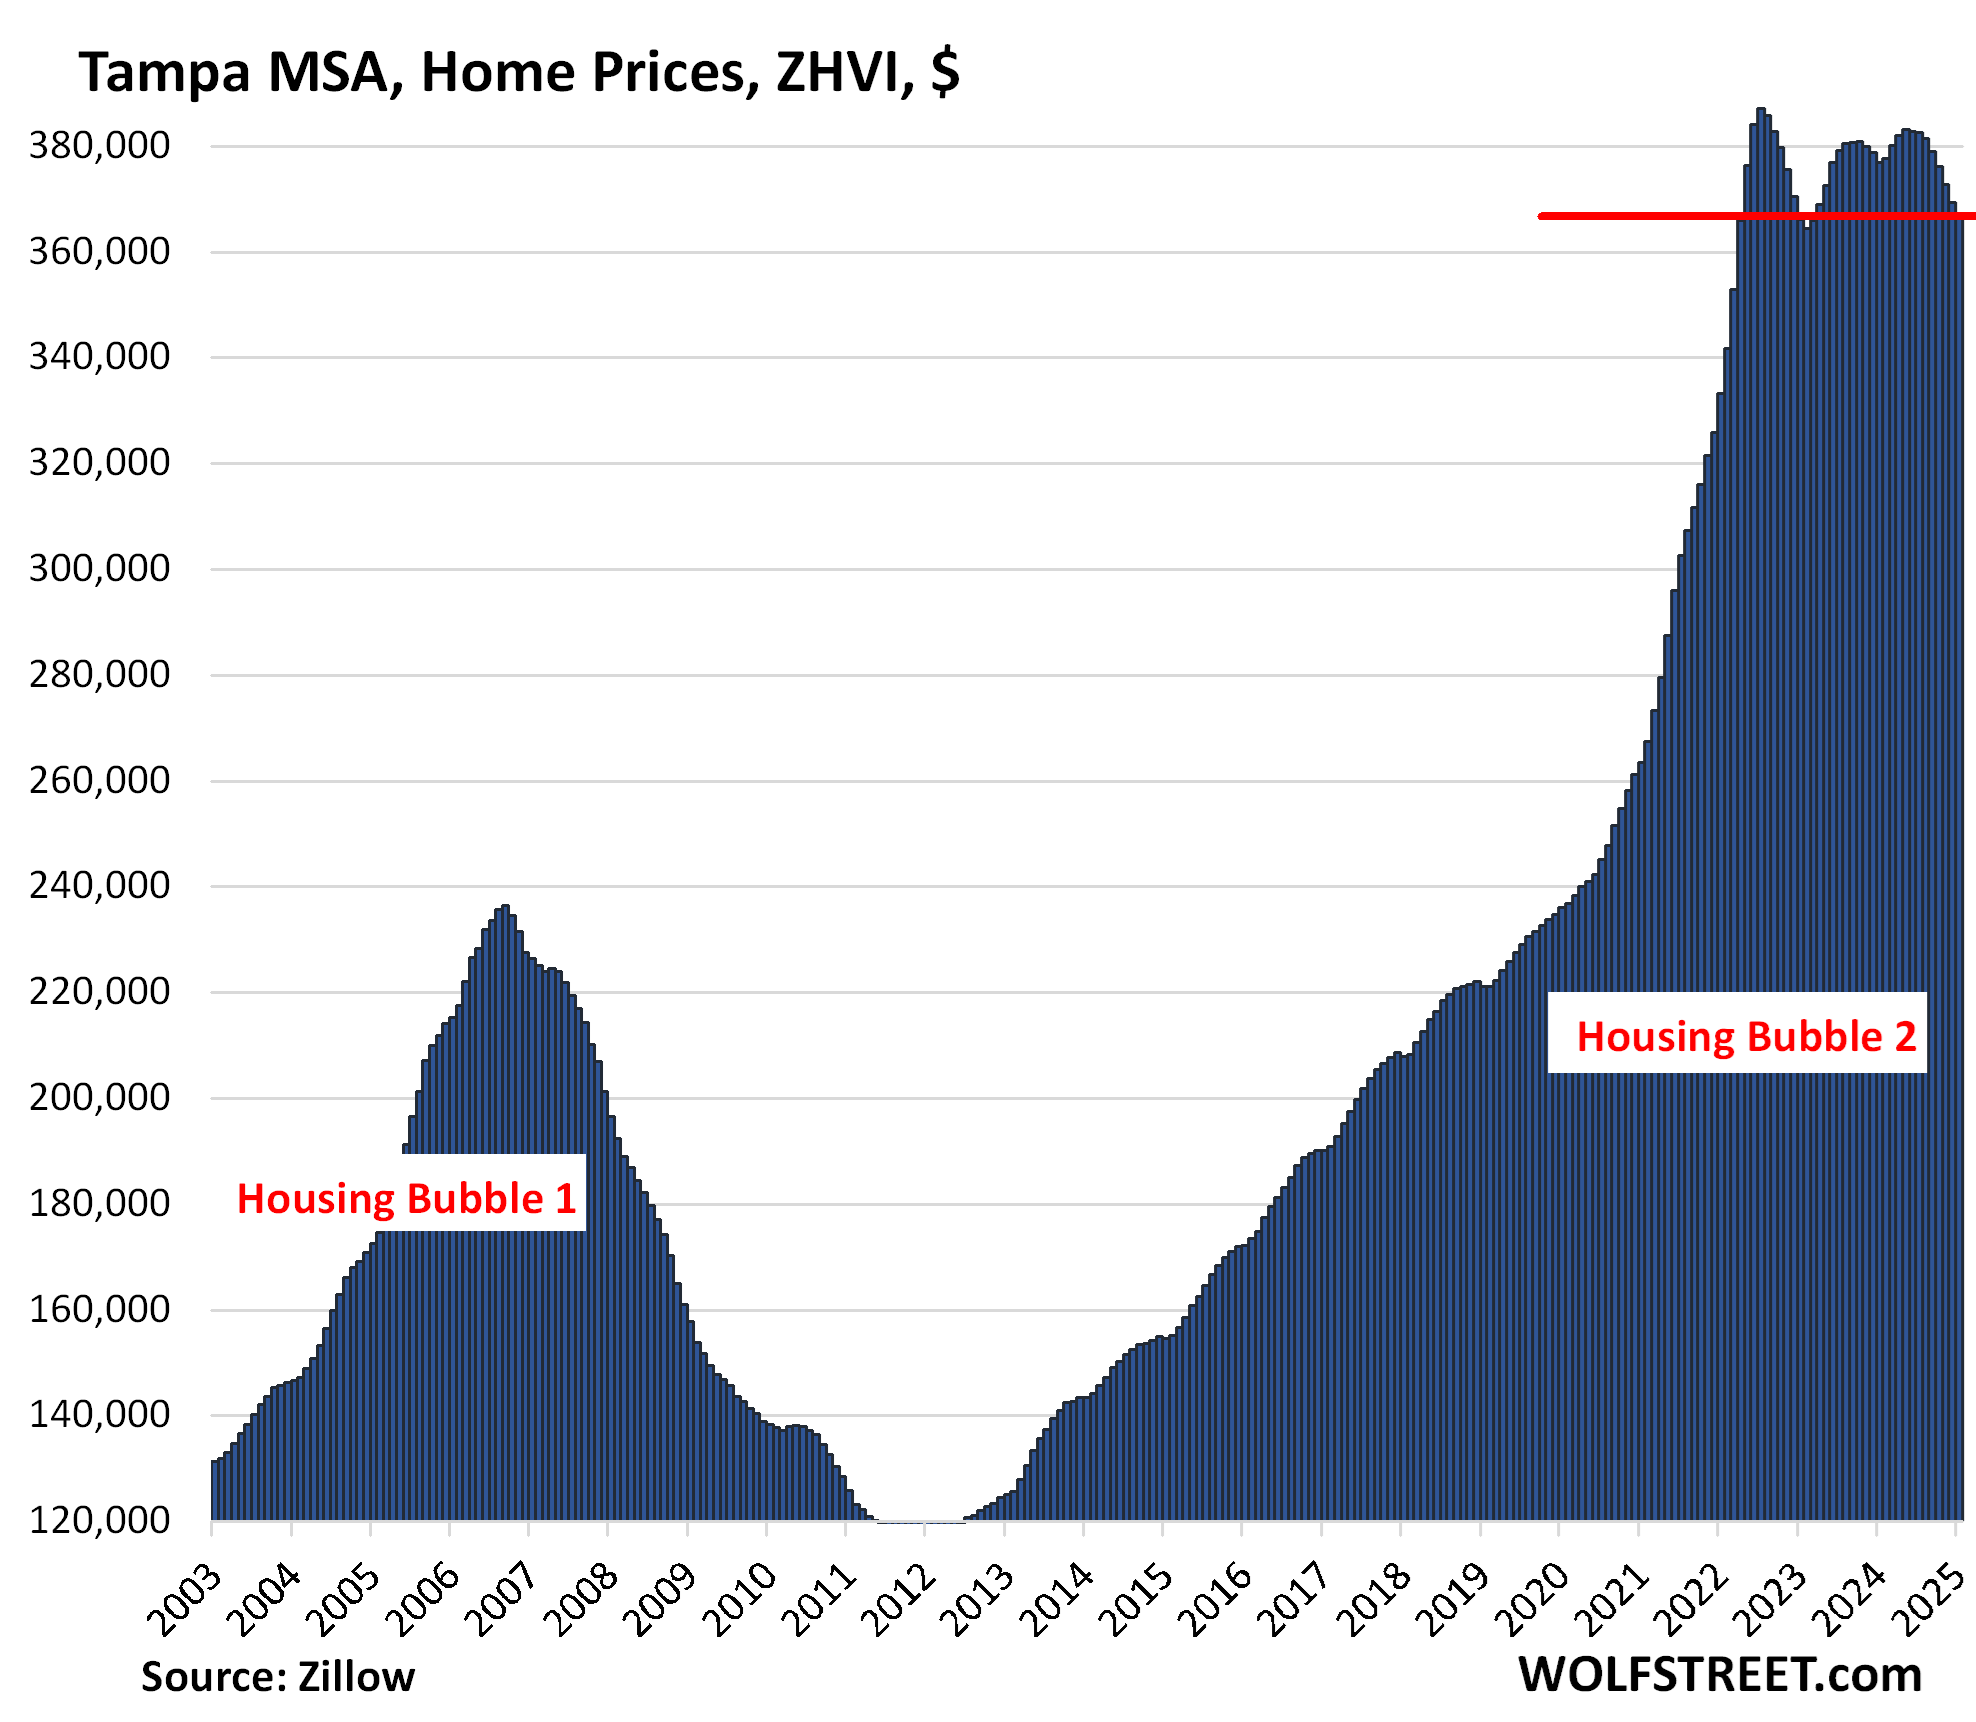
| Tampa MSA, Home Prices | |||
| From Jul 2022 peak | MoM | YoY | Since 2000 |
| -4.5% | -0.6% | -0.9% | 208% |
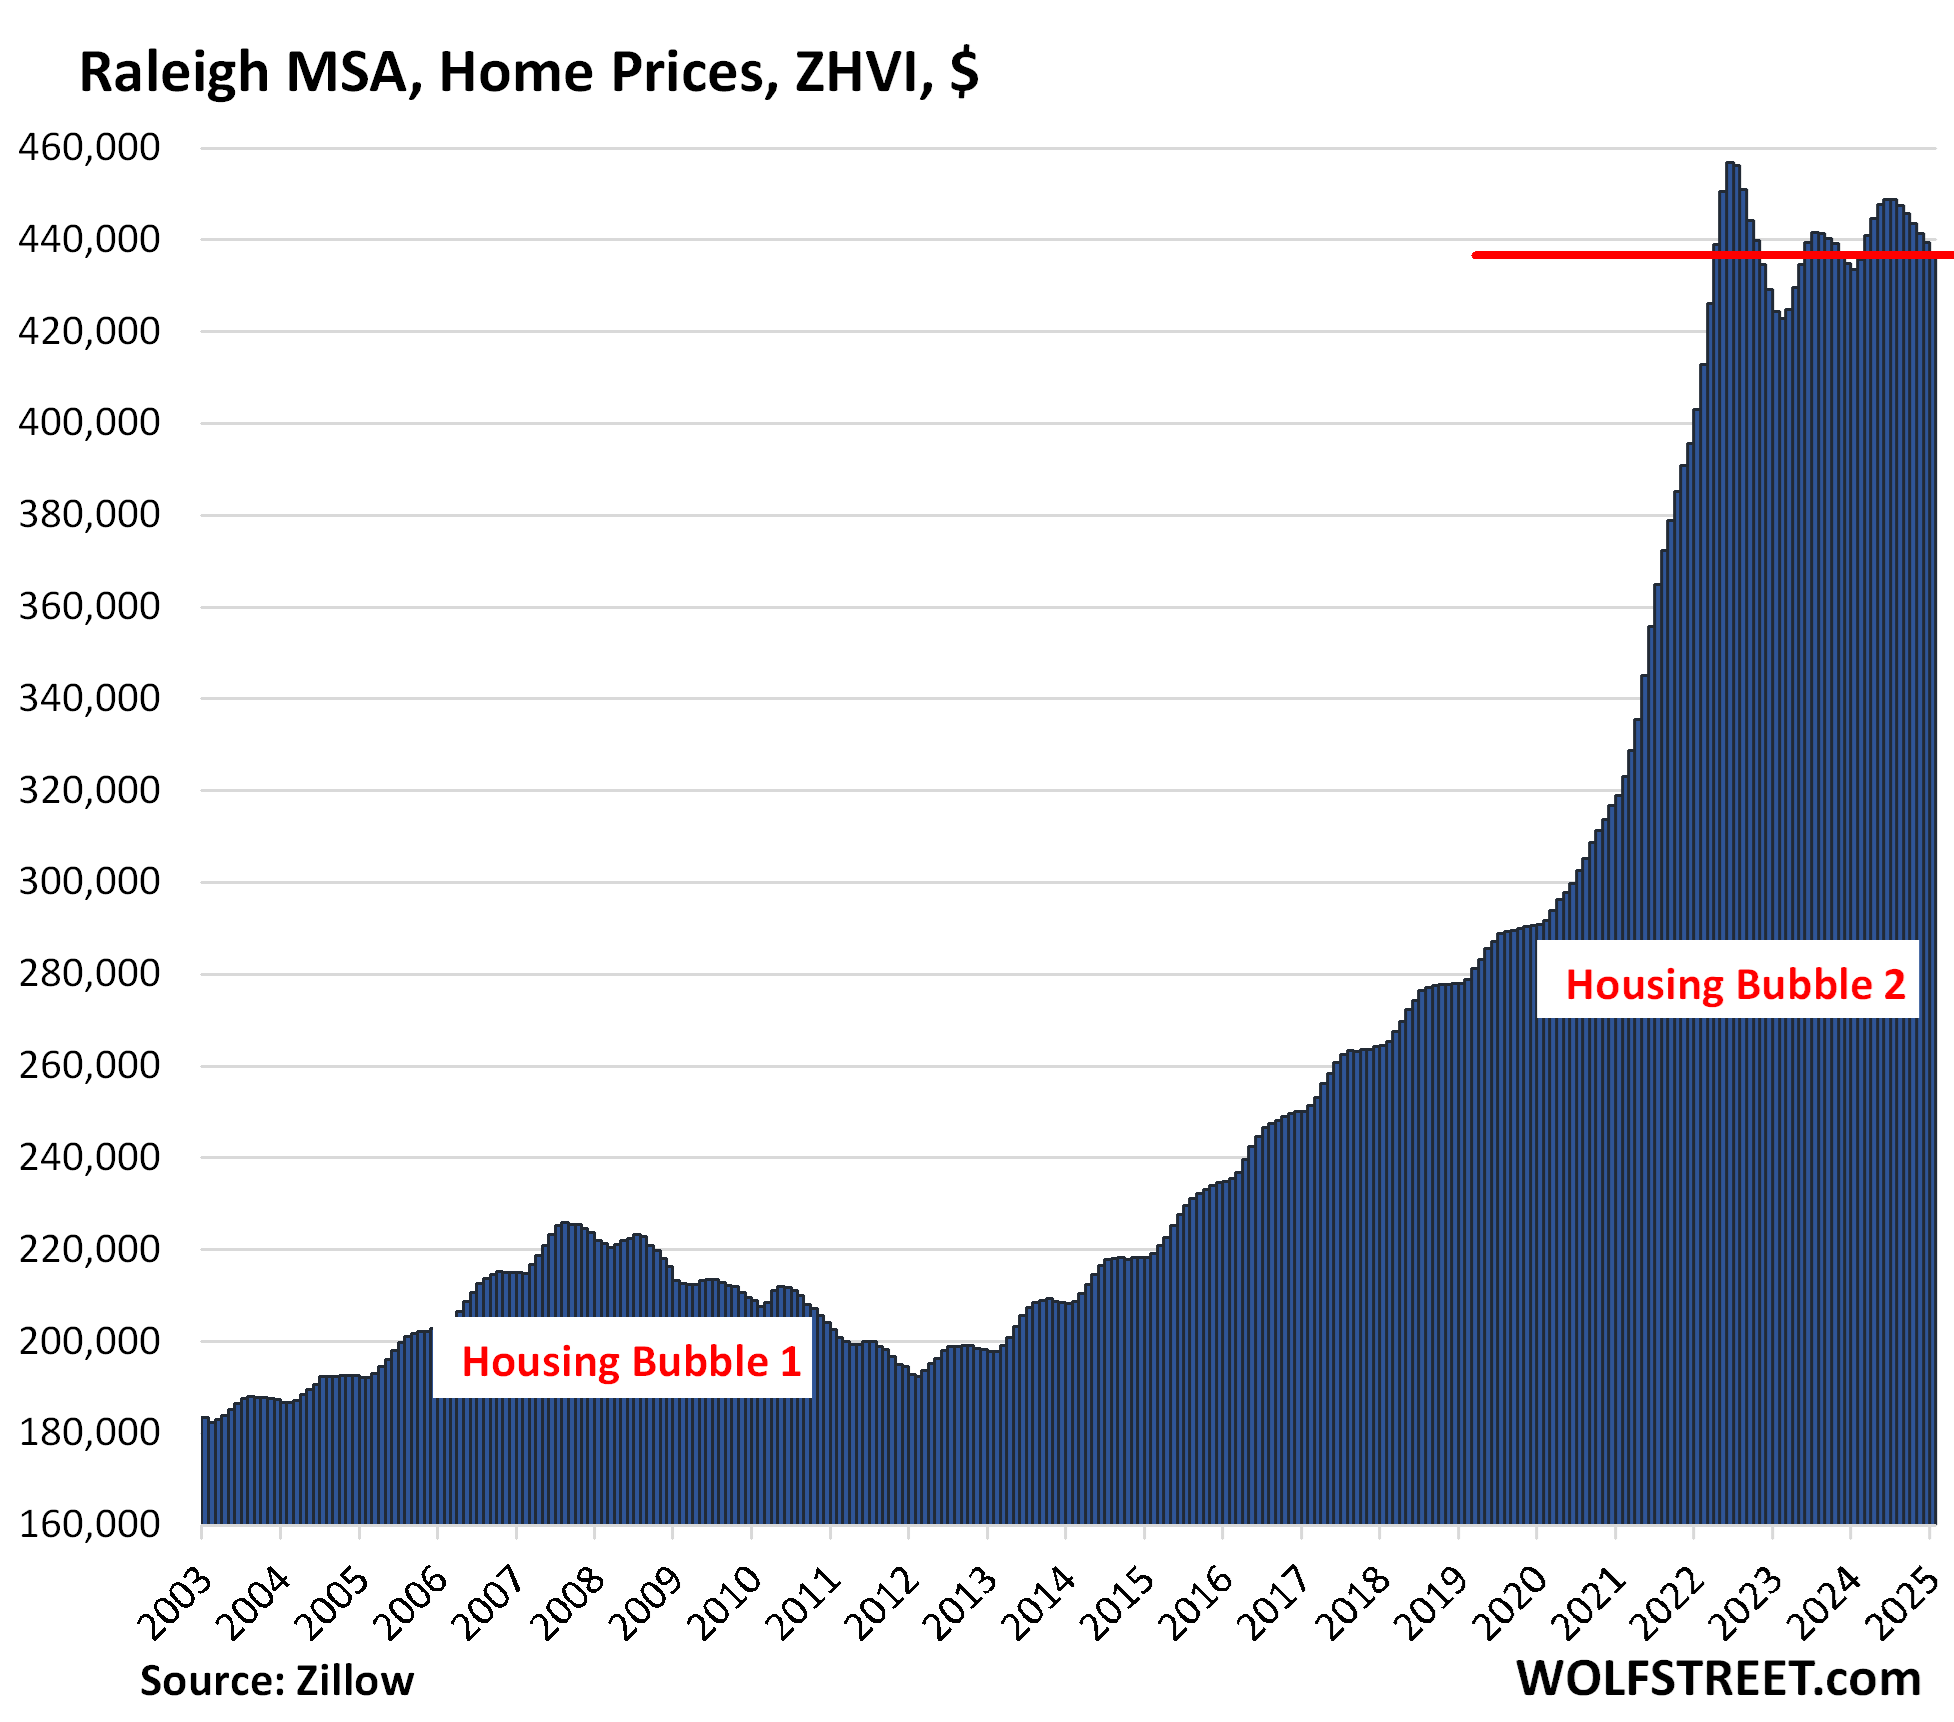
| Raleigh MSA, Home Prices | |||
| From July 2022 peak | MoM | YoY | Since 2000 |
| -4.4% | -0.6% | 0.8% | 156% |
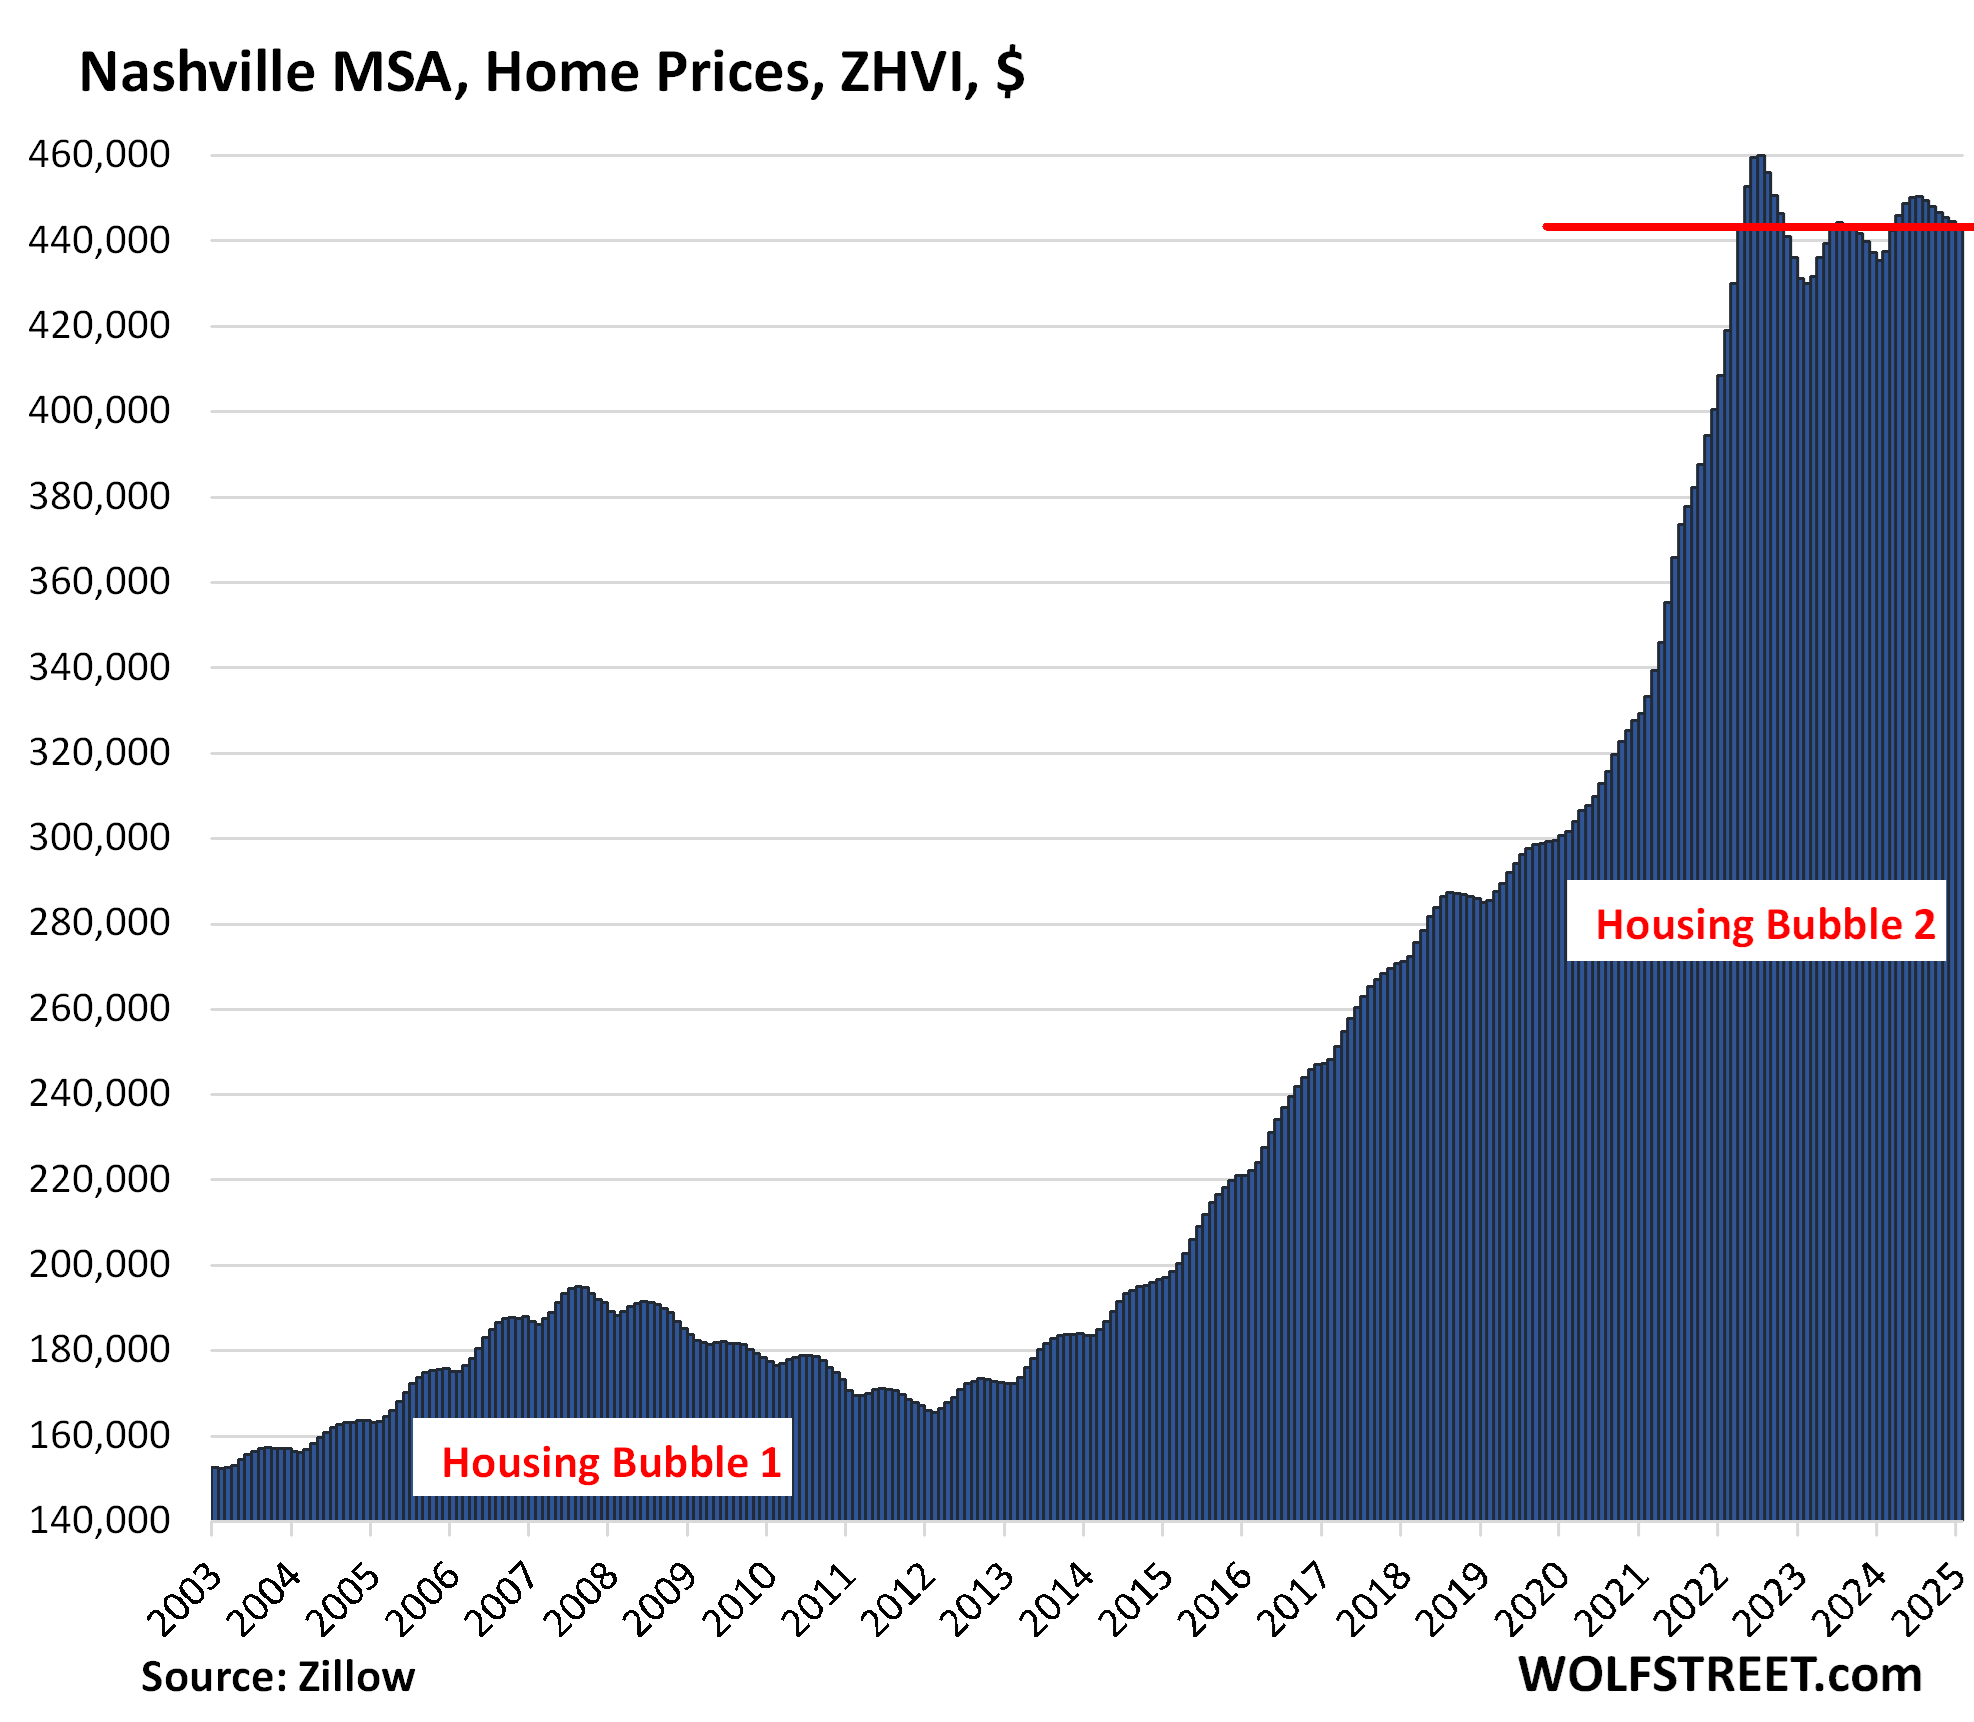
| Nashville MSA, Home Prices | |||
| From July 2022 peak | MoM | YoY | Since 2000 |
| -3.6% | -0.2% | 1.9% | 216% |
| Houston MSA, Home Prices | |||
| From Jul 2022 peak | MoM | YoY | Since 2000 |
| -3.7% | -0.3% | 0.4% | 149% |
Back to April 2022.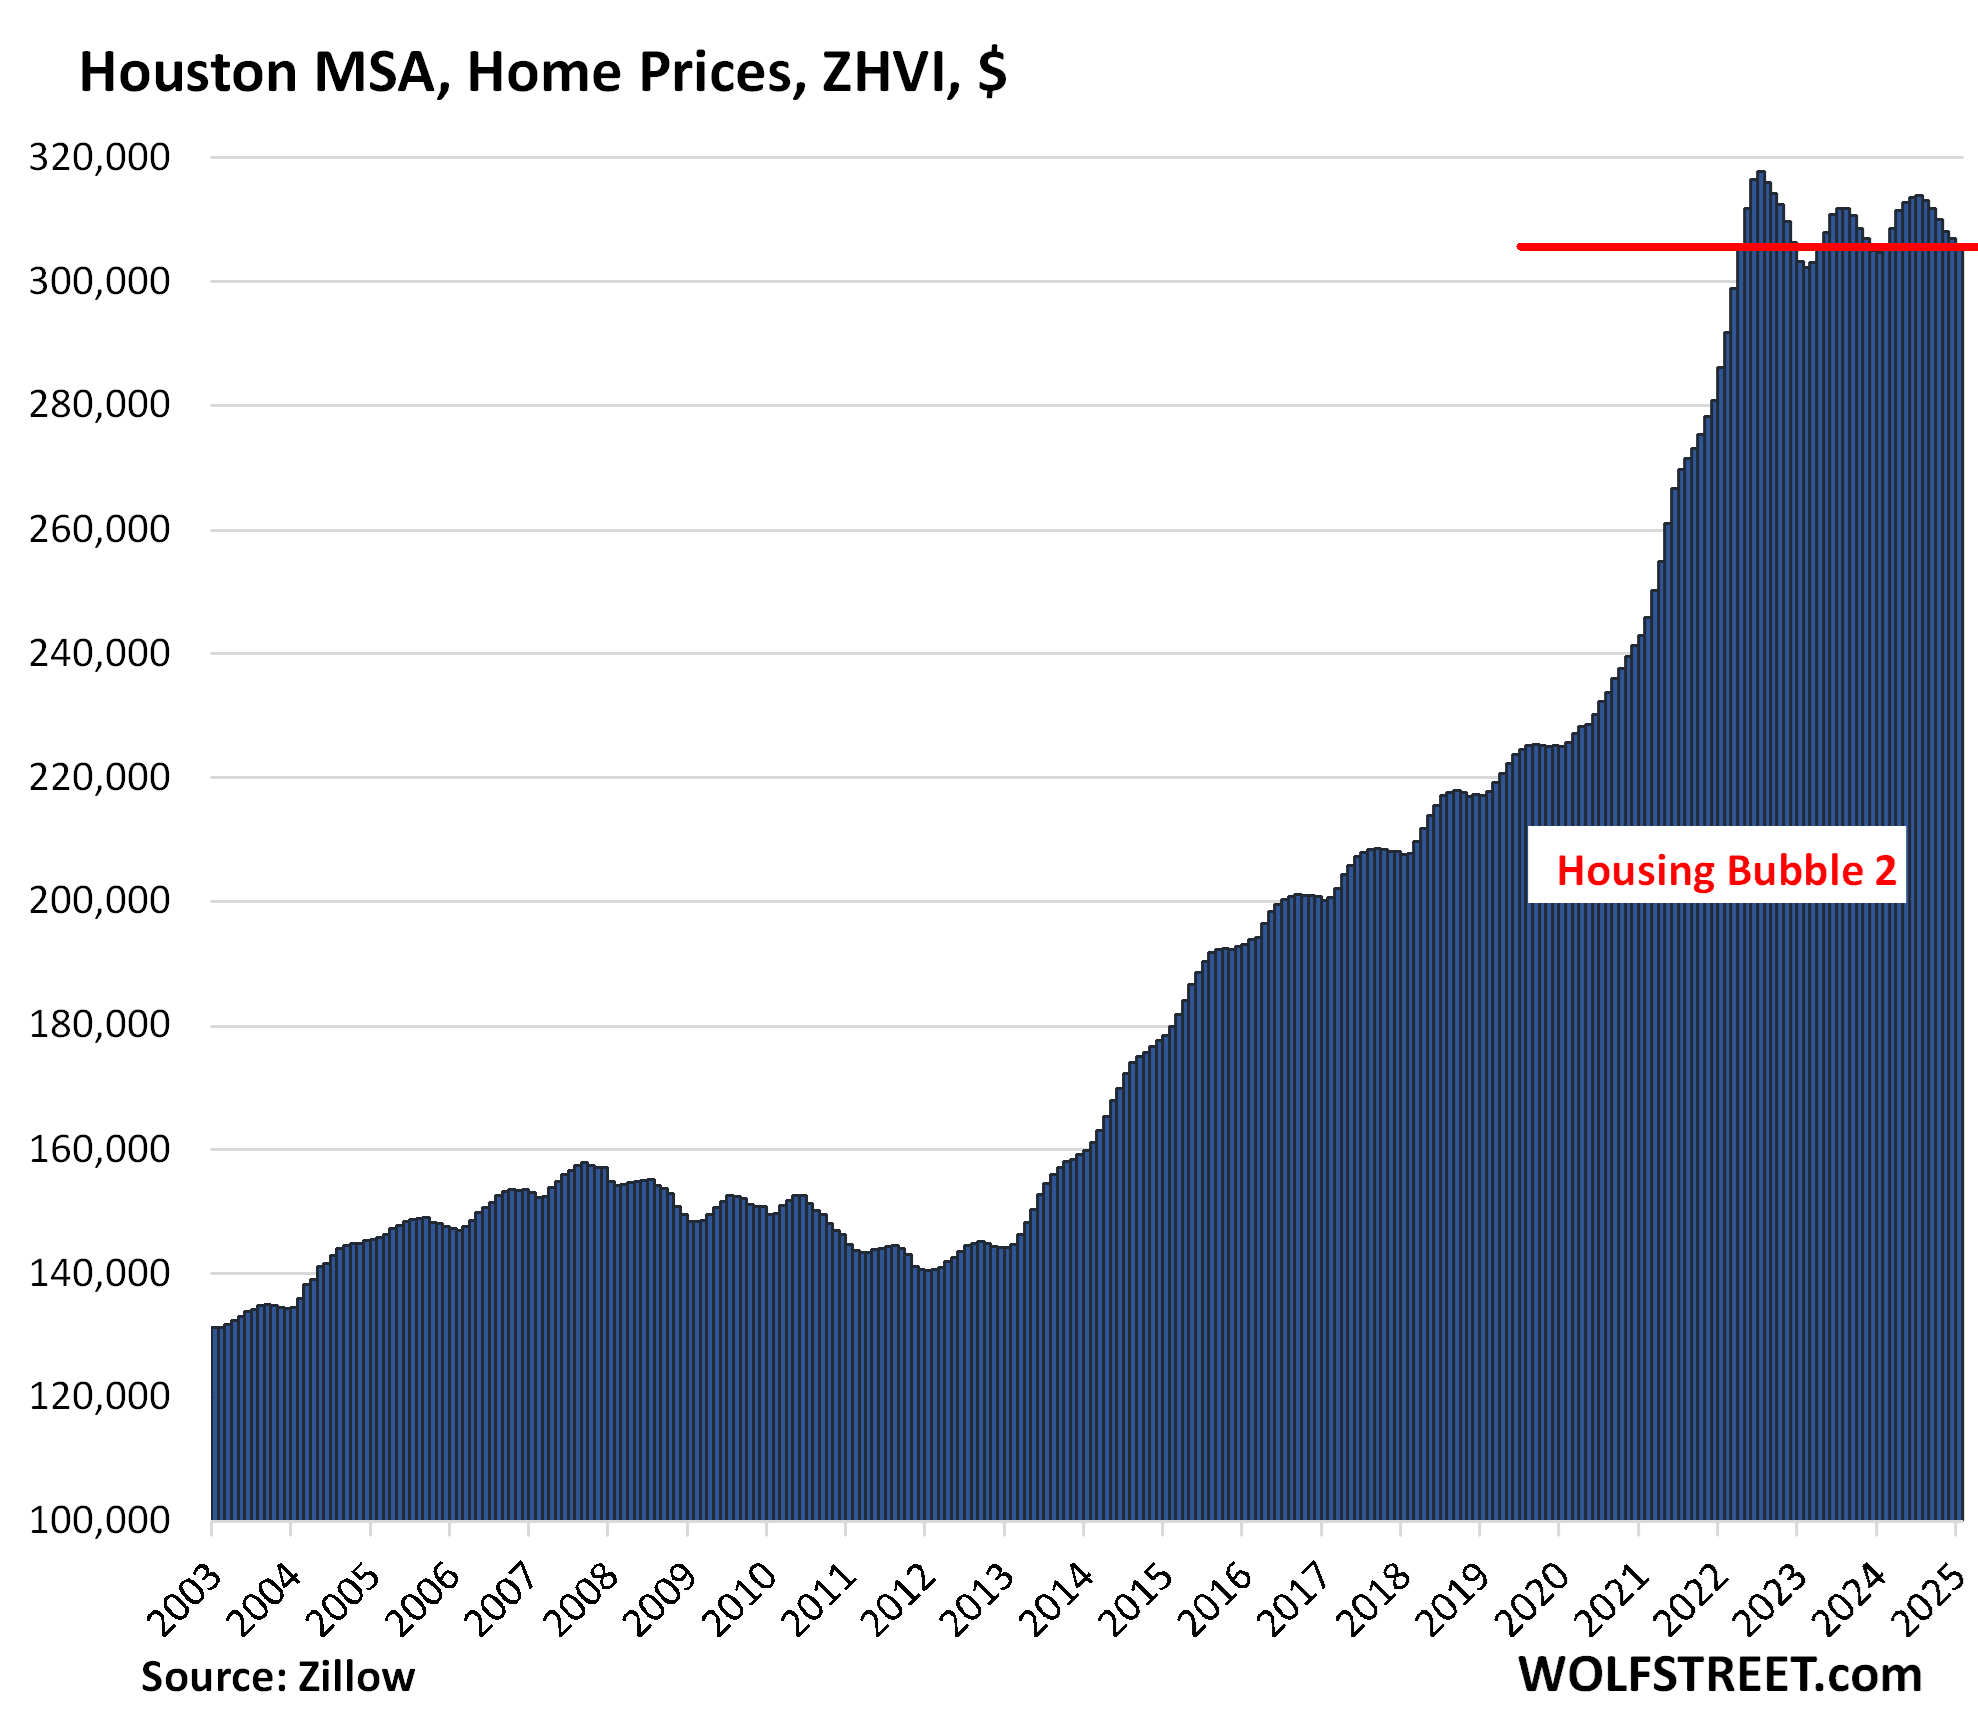
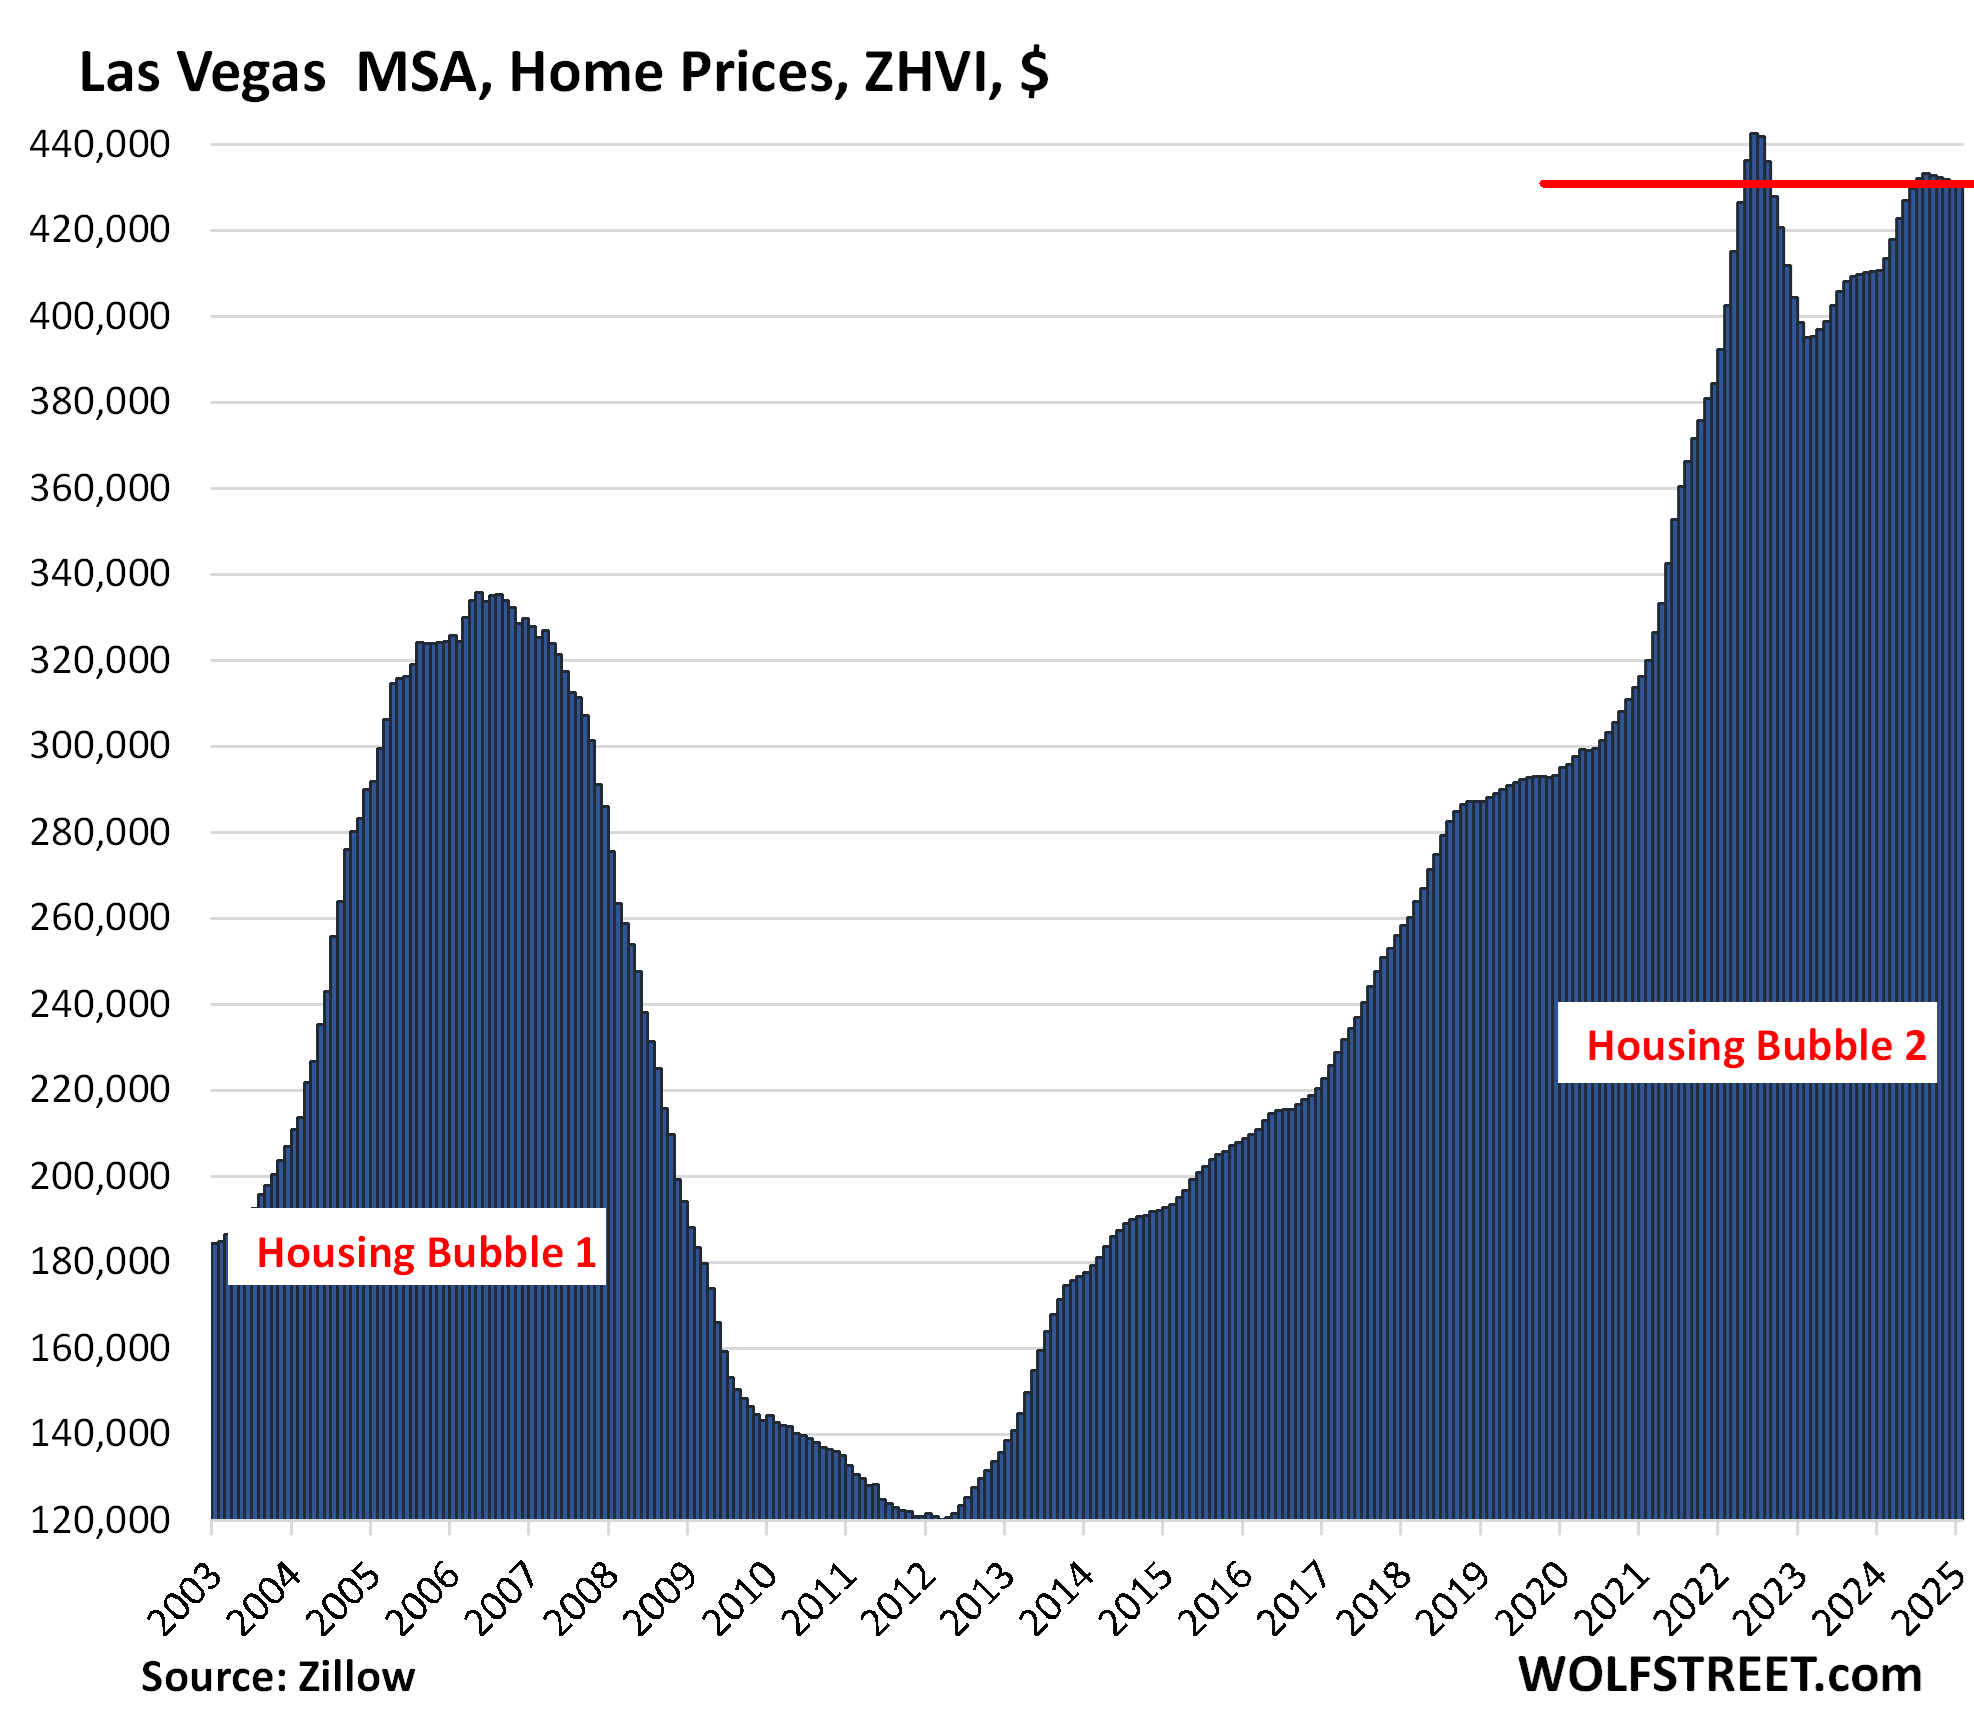
| Las Vegas MSA, Home Prices | |||
| From June 2022 peak | MoM | YoY | Since 2000 |
| -2.6% | -0.1% | 5.0% | 178% |
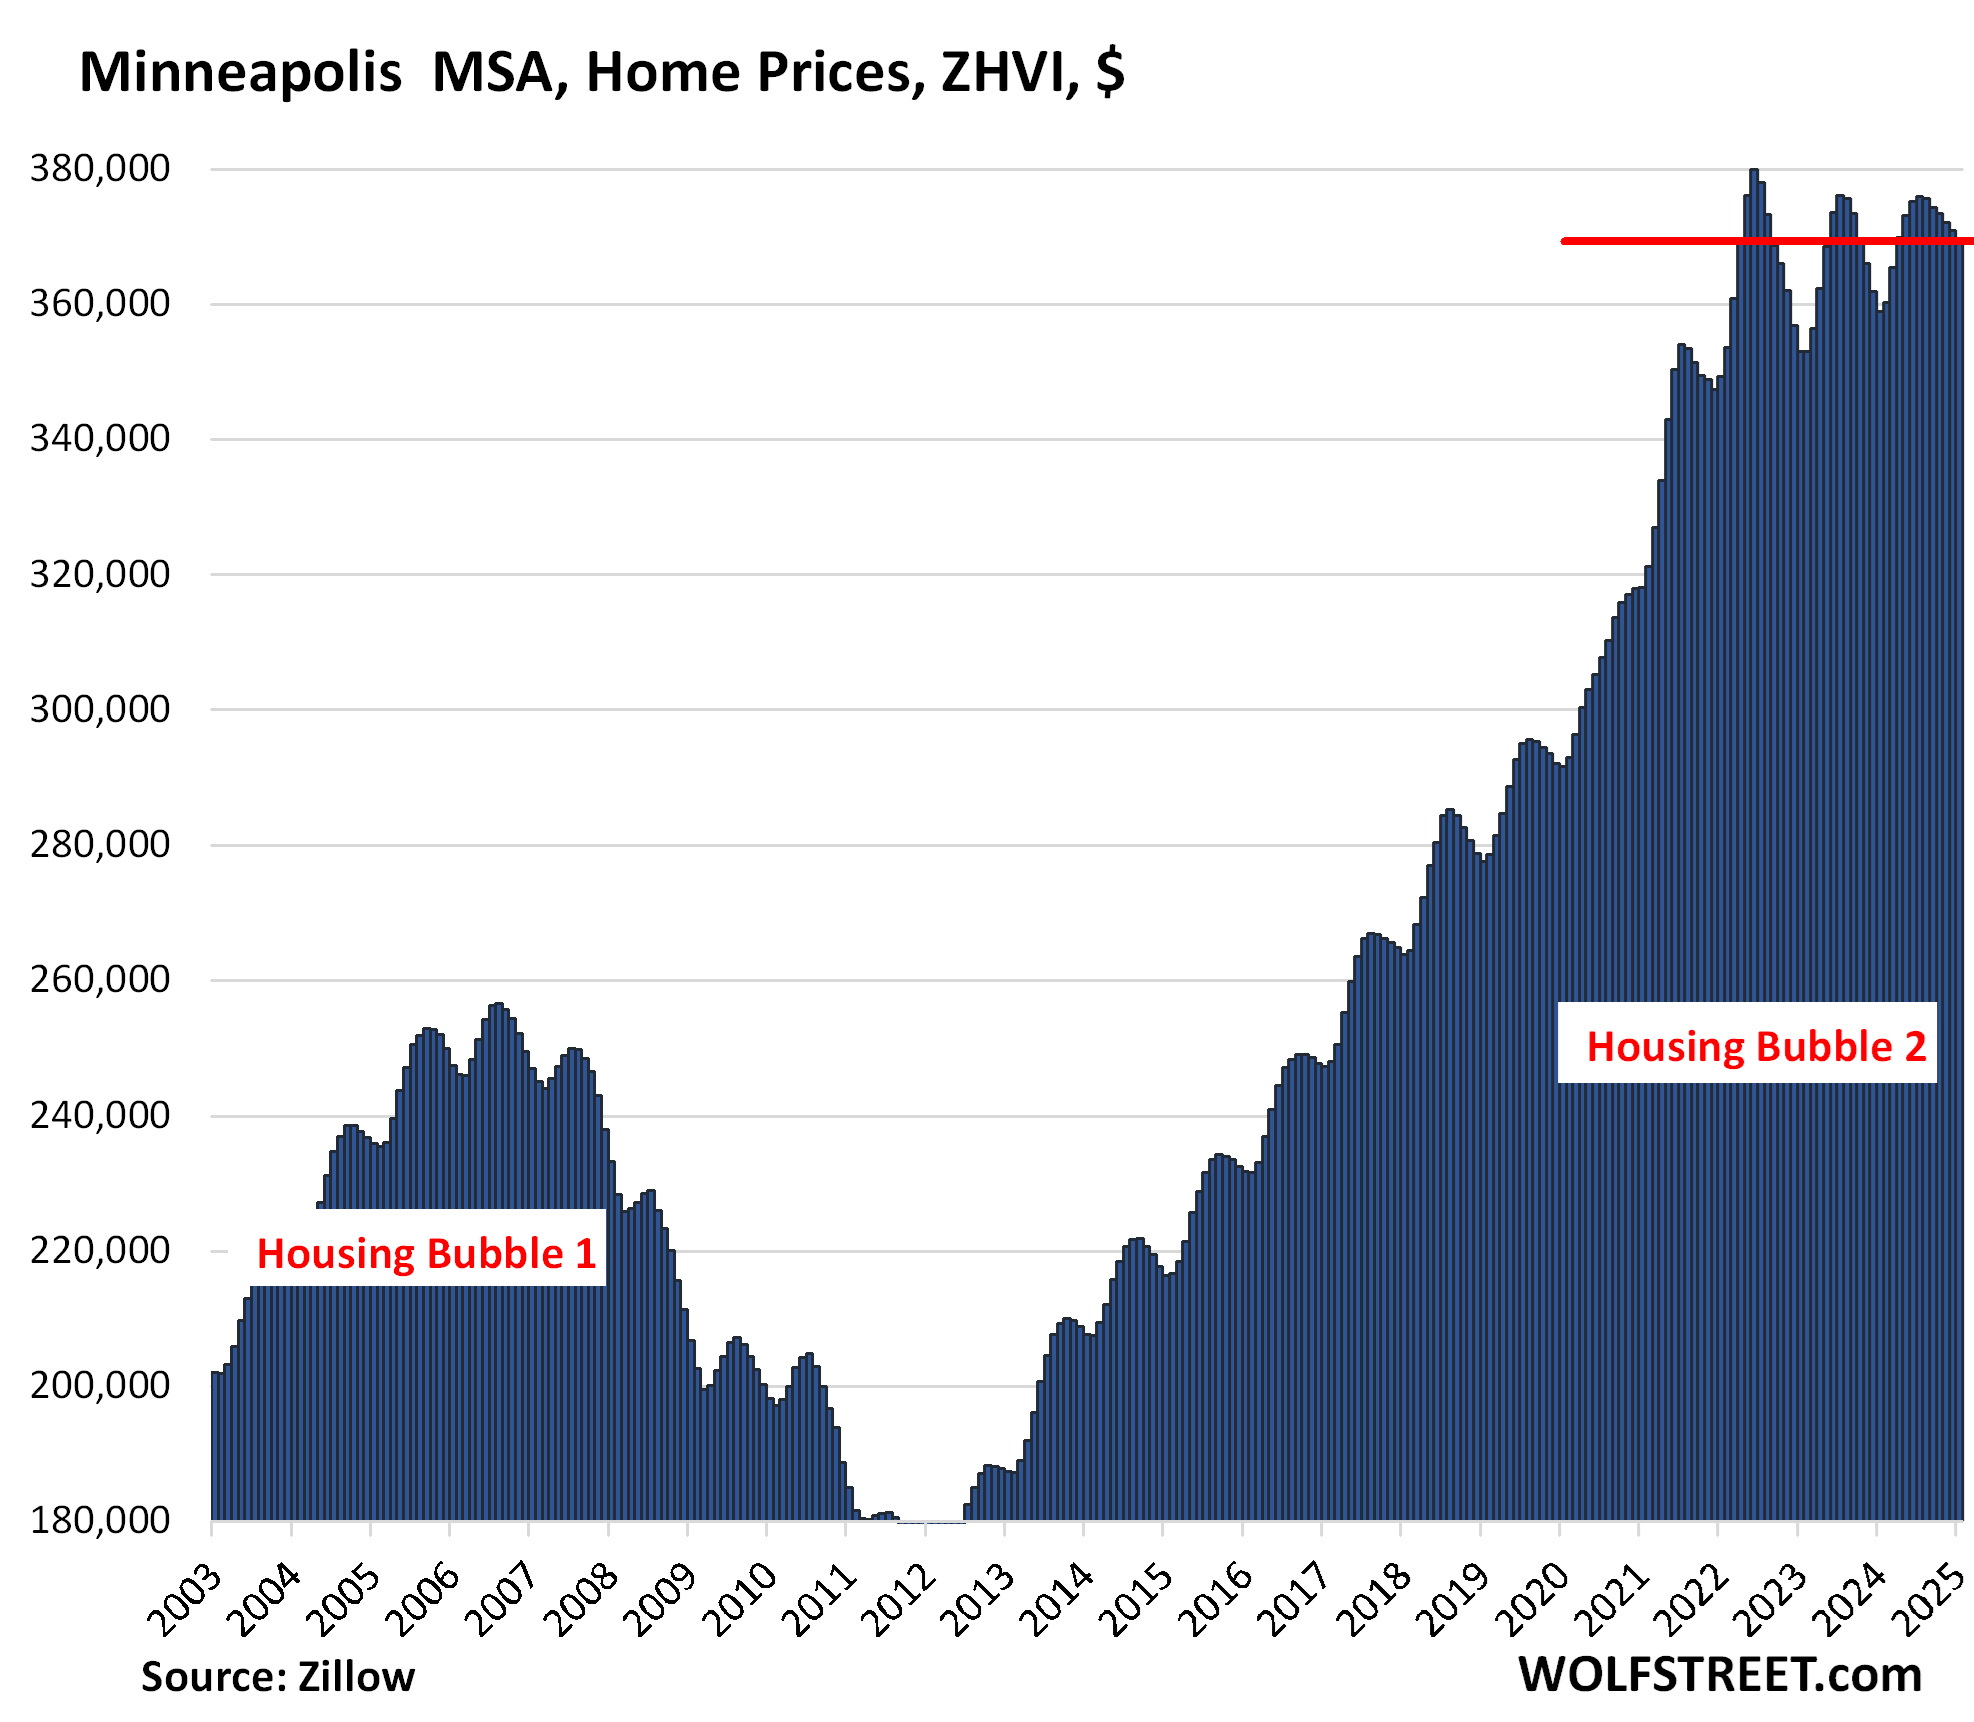
| Minneapolis MSA, Home Prices | |||
| From May 2022 peak | MoM | YoY | Since 2000 |
| -2.9% | -0.5% | 2.8% | 155% |
| San Jose MSA, Home Prices | |||
| From May 2022 peak | MoM | YoY | Since 2000 |
| -2.3% | 0.0% | 8.1% | 337% |
Prices have been essentially unchanged for the past five months.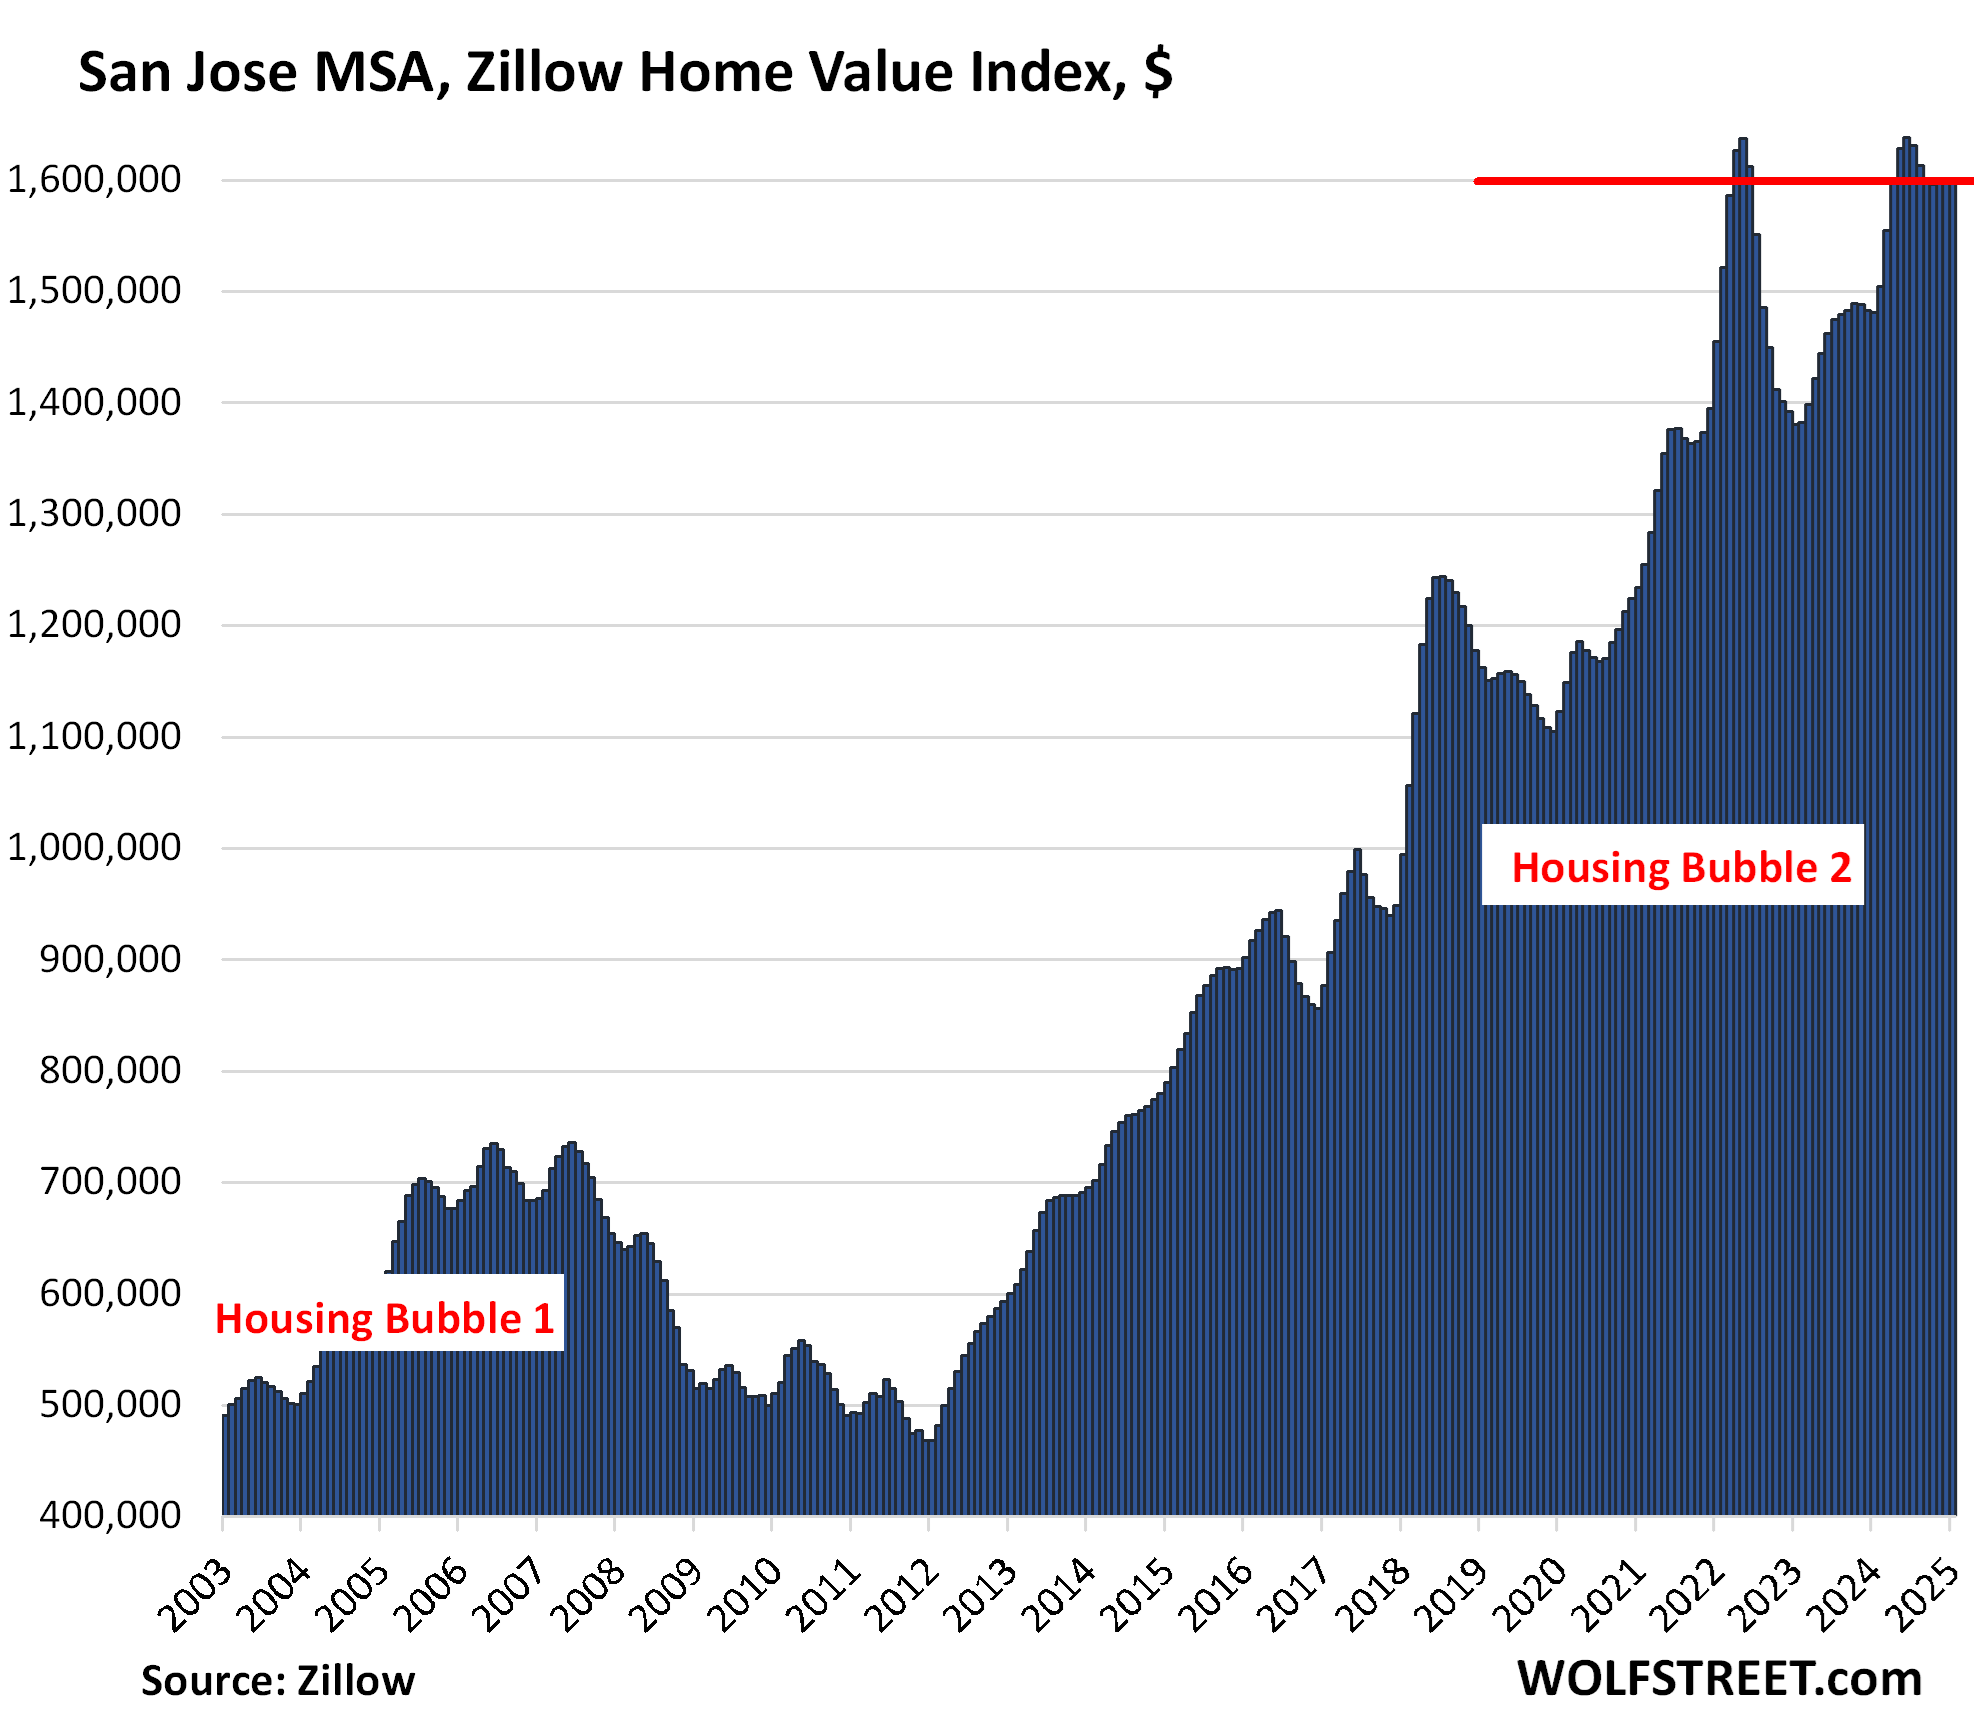
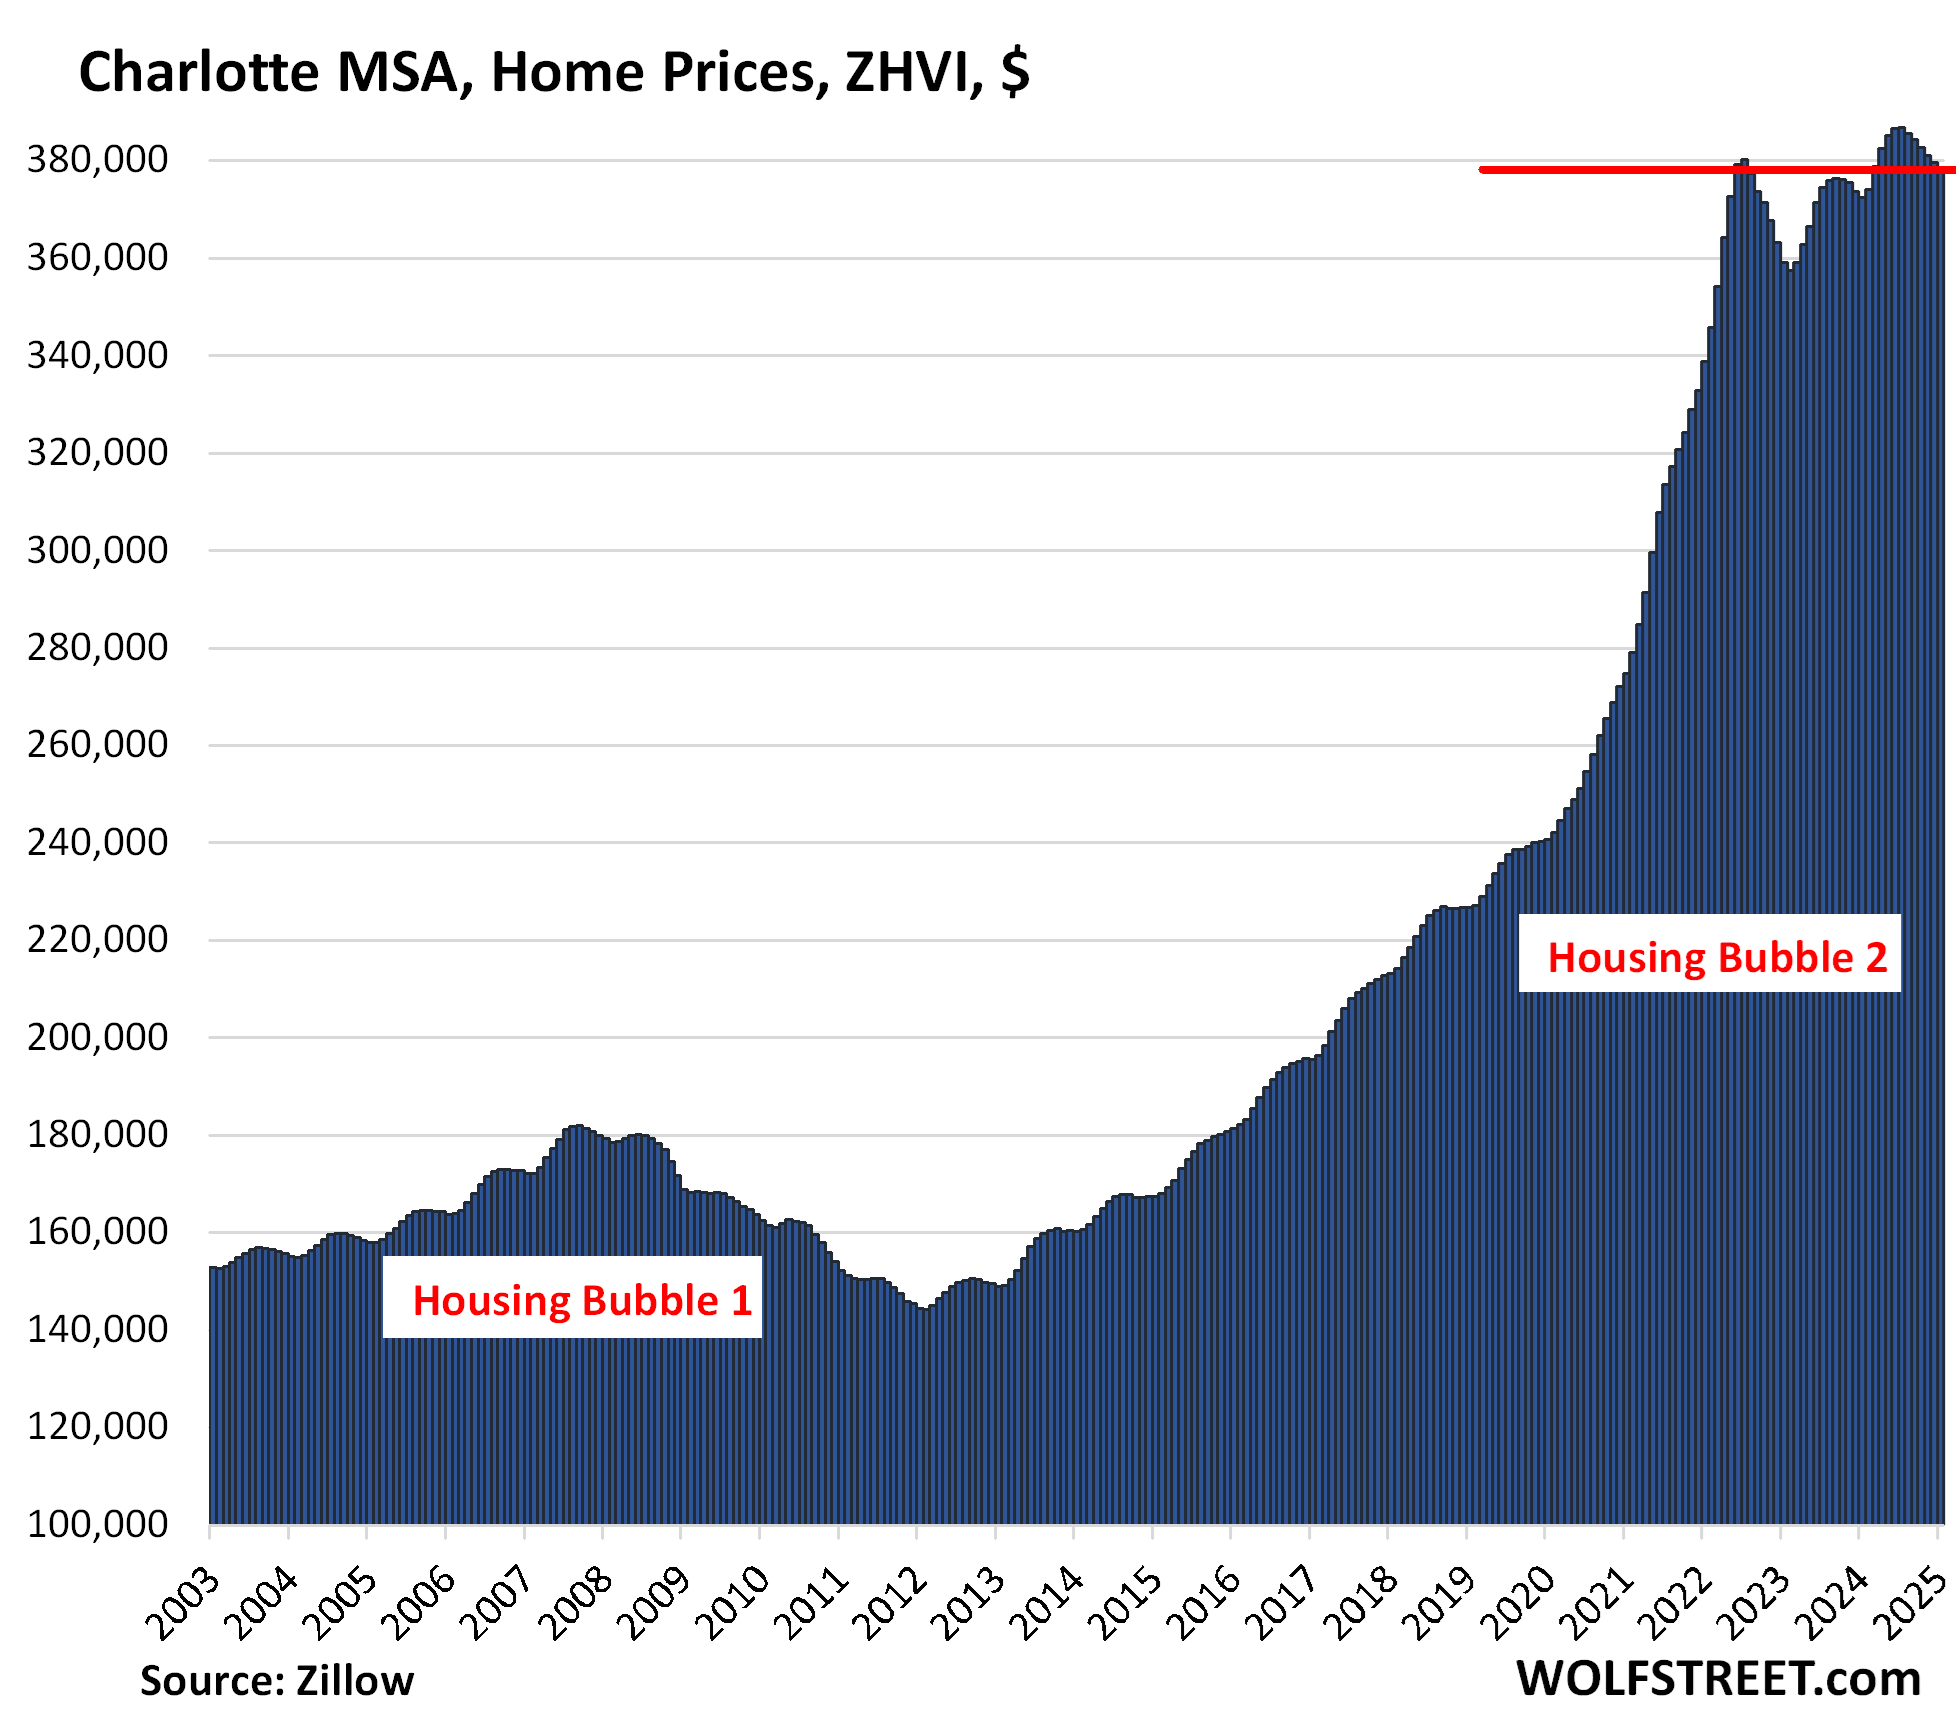
| Charlotte MSA, Home Prices | |||
| From June 2022 | MoM | YoY | Since 2000 |
| -0.5% | -0.4% | 1.6% | 168% |
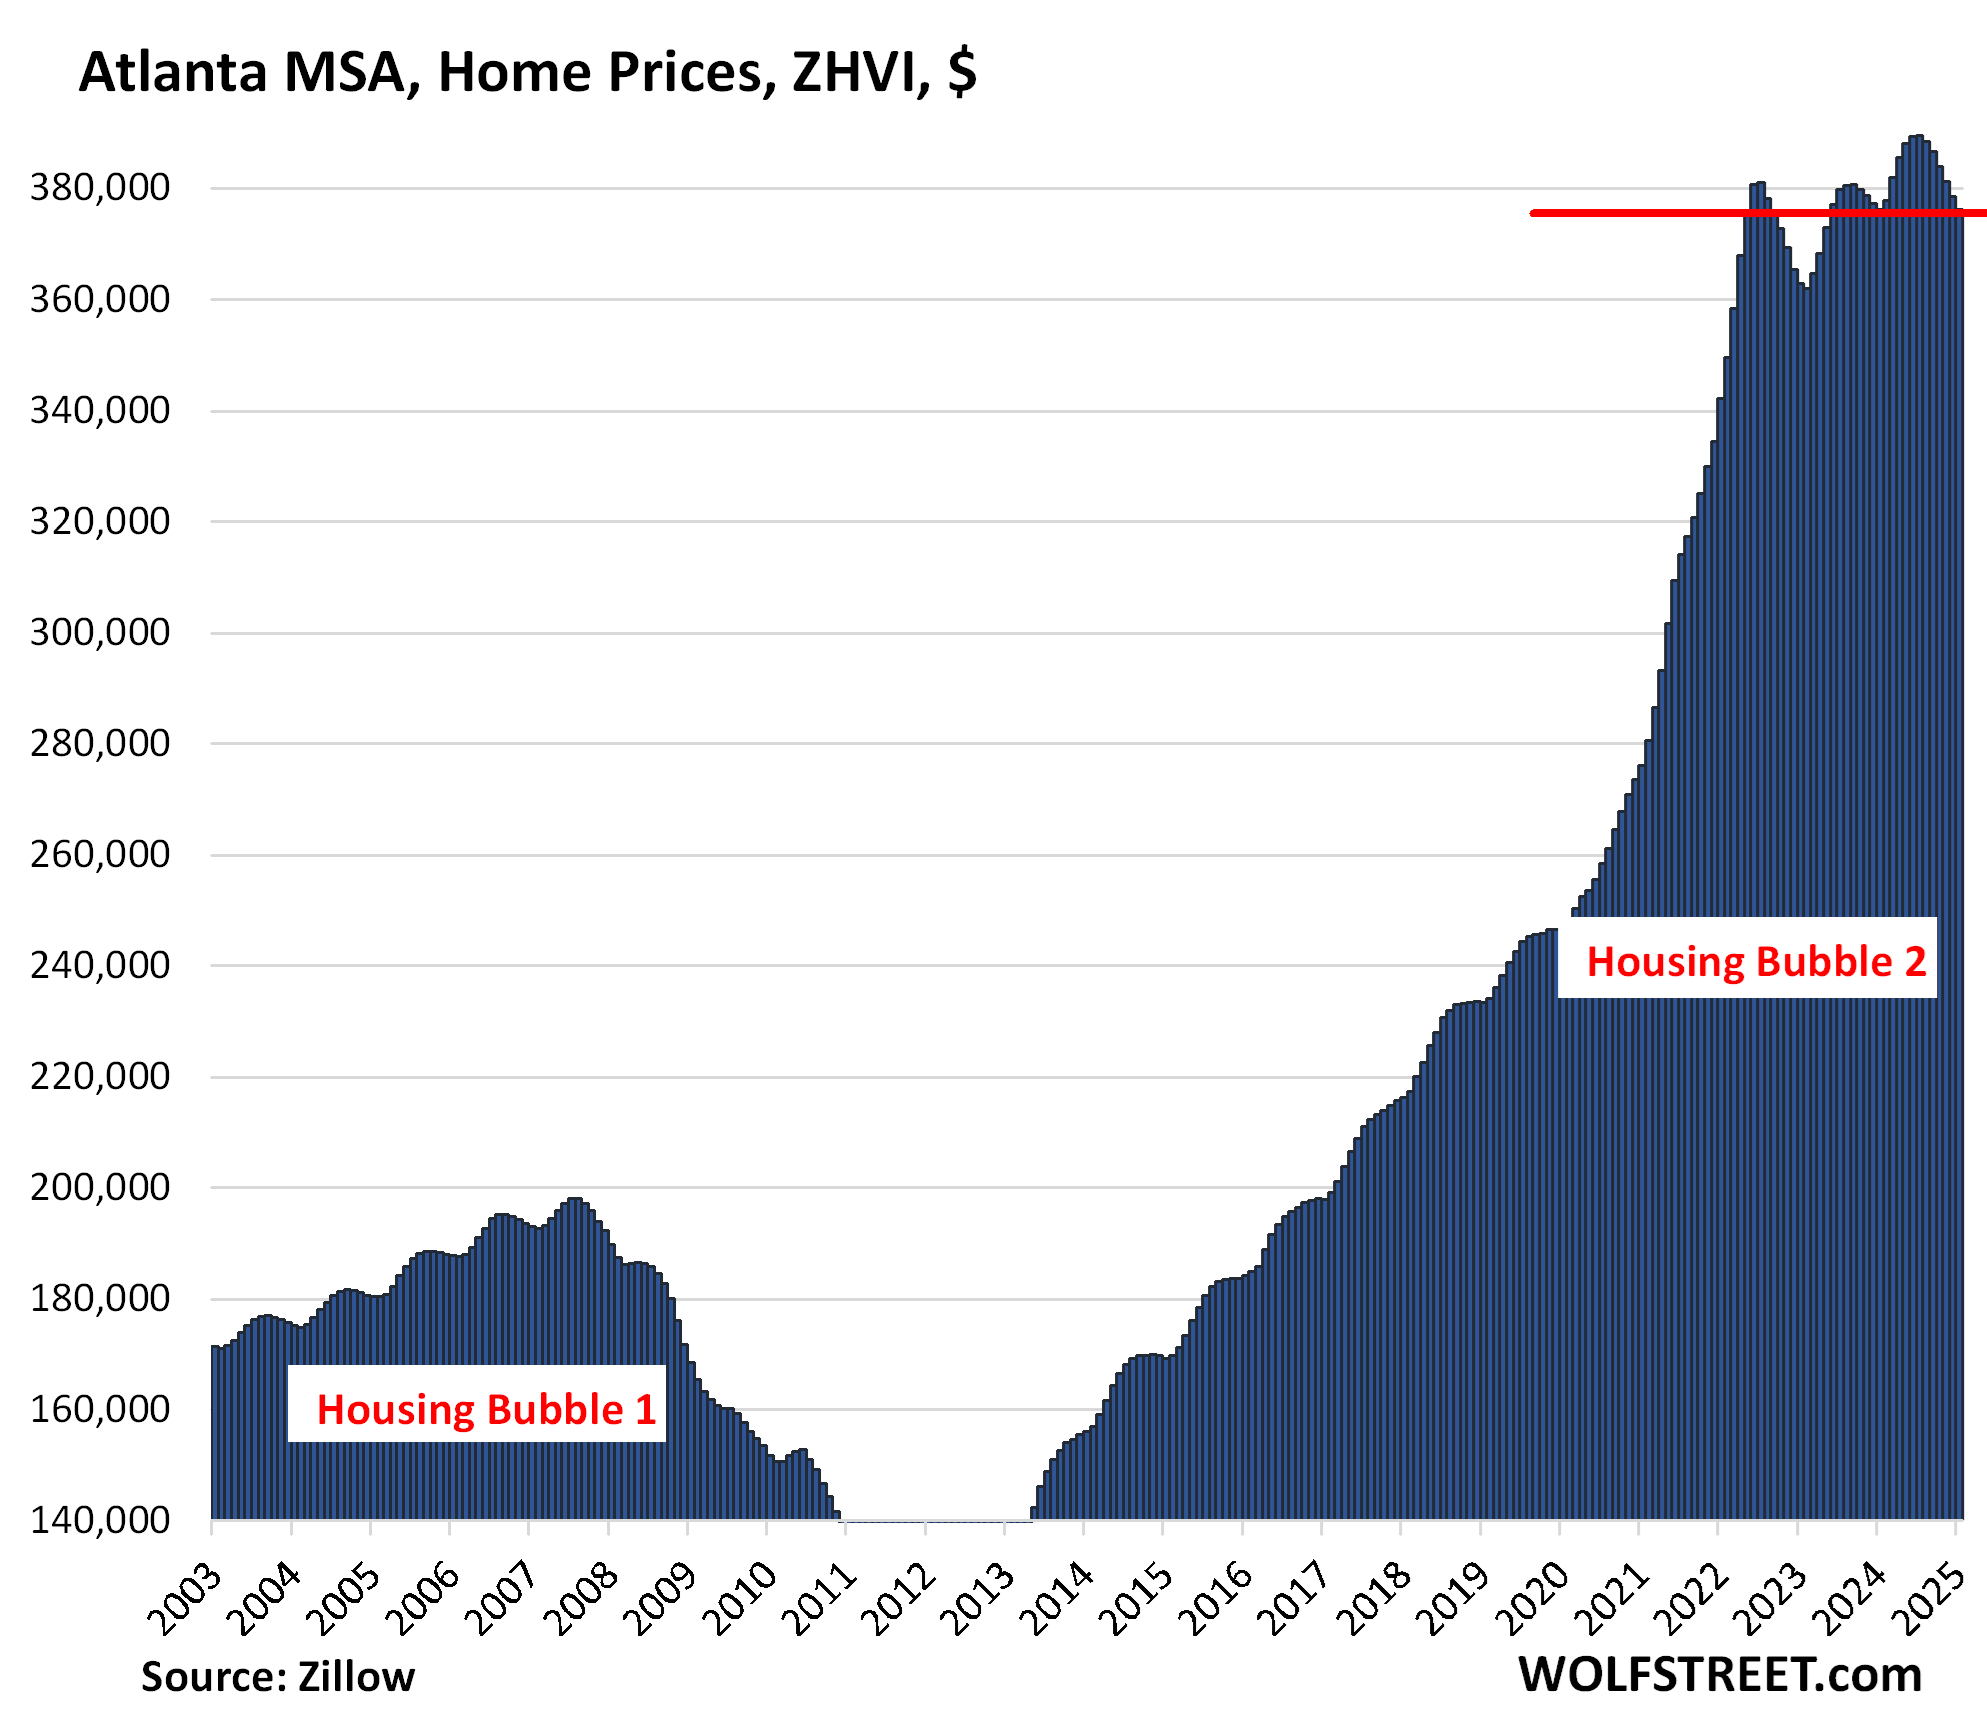
| Atlanta MSA, Home Prices | |||
| From July 2022 | MoM | YoY | Since 2000 |
| -1.3% | -0.6% | 0.0% | 158% |
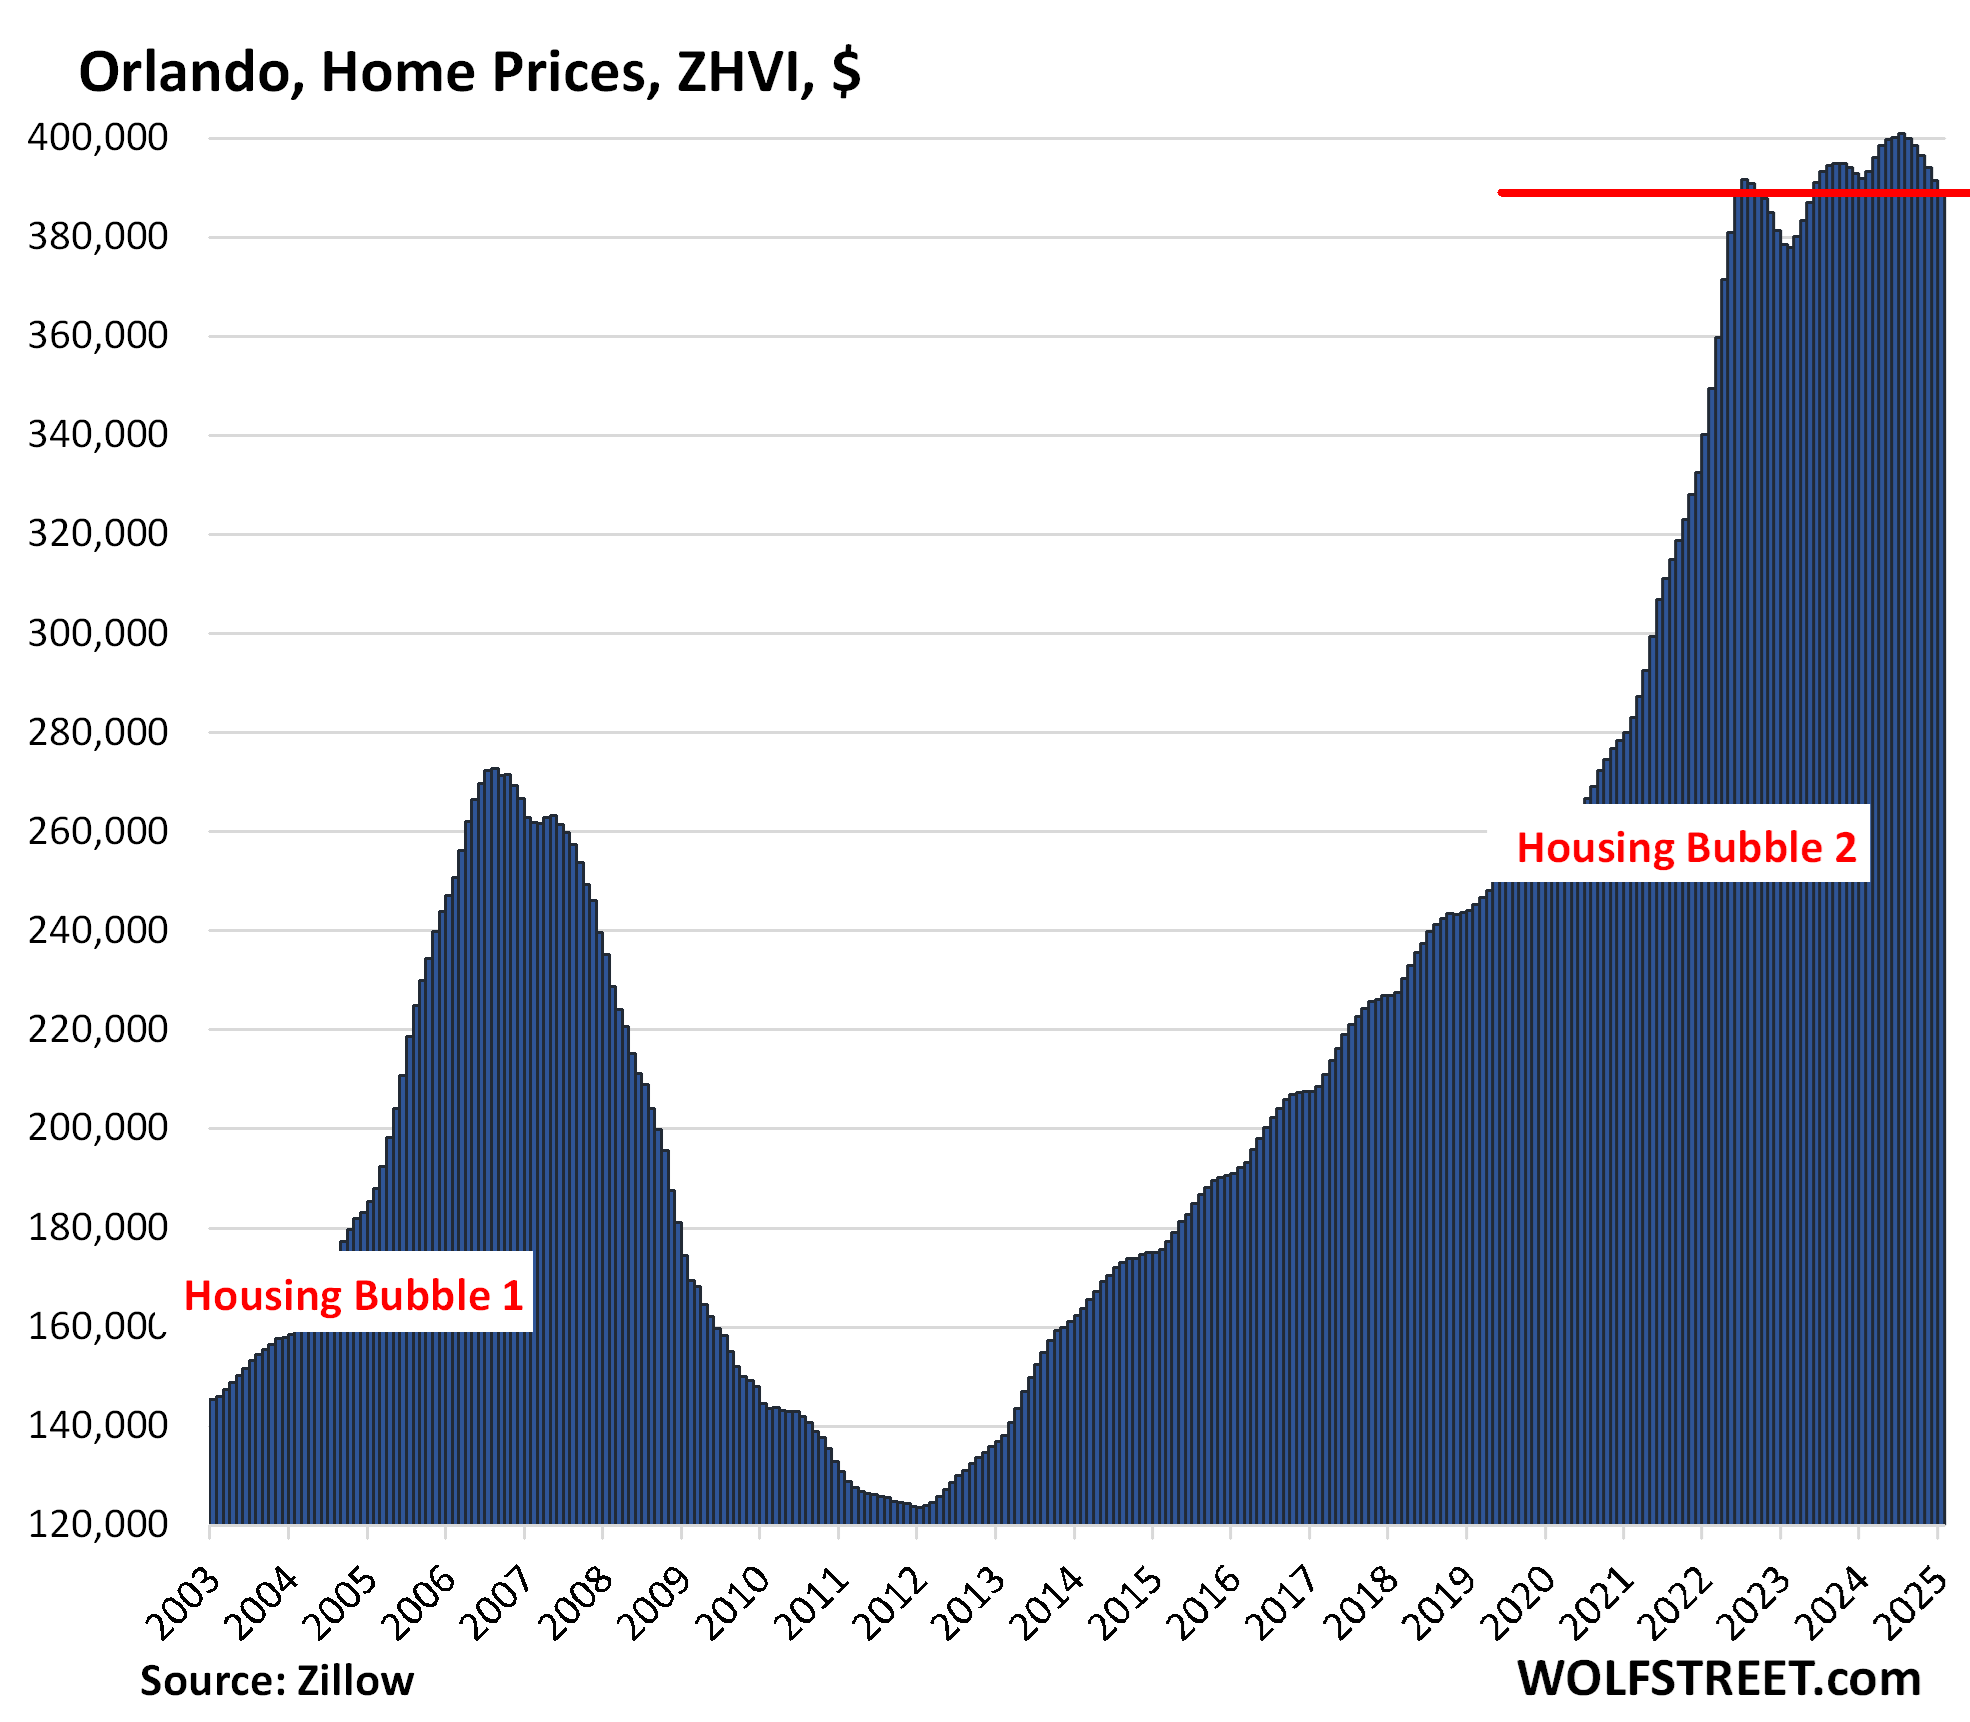
| Orlando MSA, Home Prices | |||
| From June 2022 | MoM | YoY | Since 2000 |
| -0.56% | -0.5% | -0.6% | 232.6% |
The next 12 markets powered on after mid-2022, but declined more recently (seasonally or not seasonally):
| Miami MSA, Home Prices | ||
| MoM | YoY | Since 2000 |
| -0.5% | 0.5% | 327.3% |

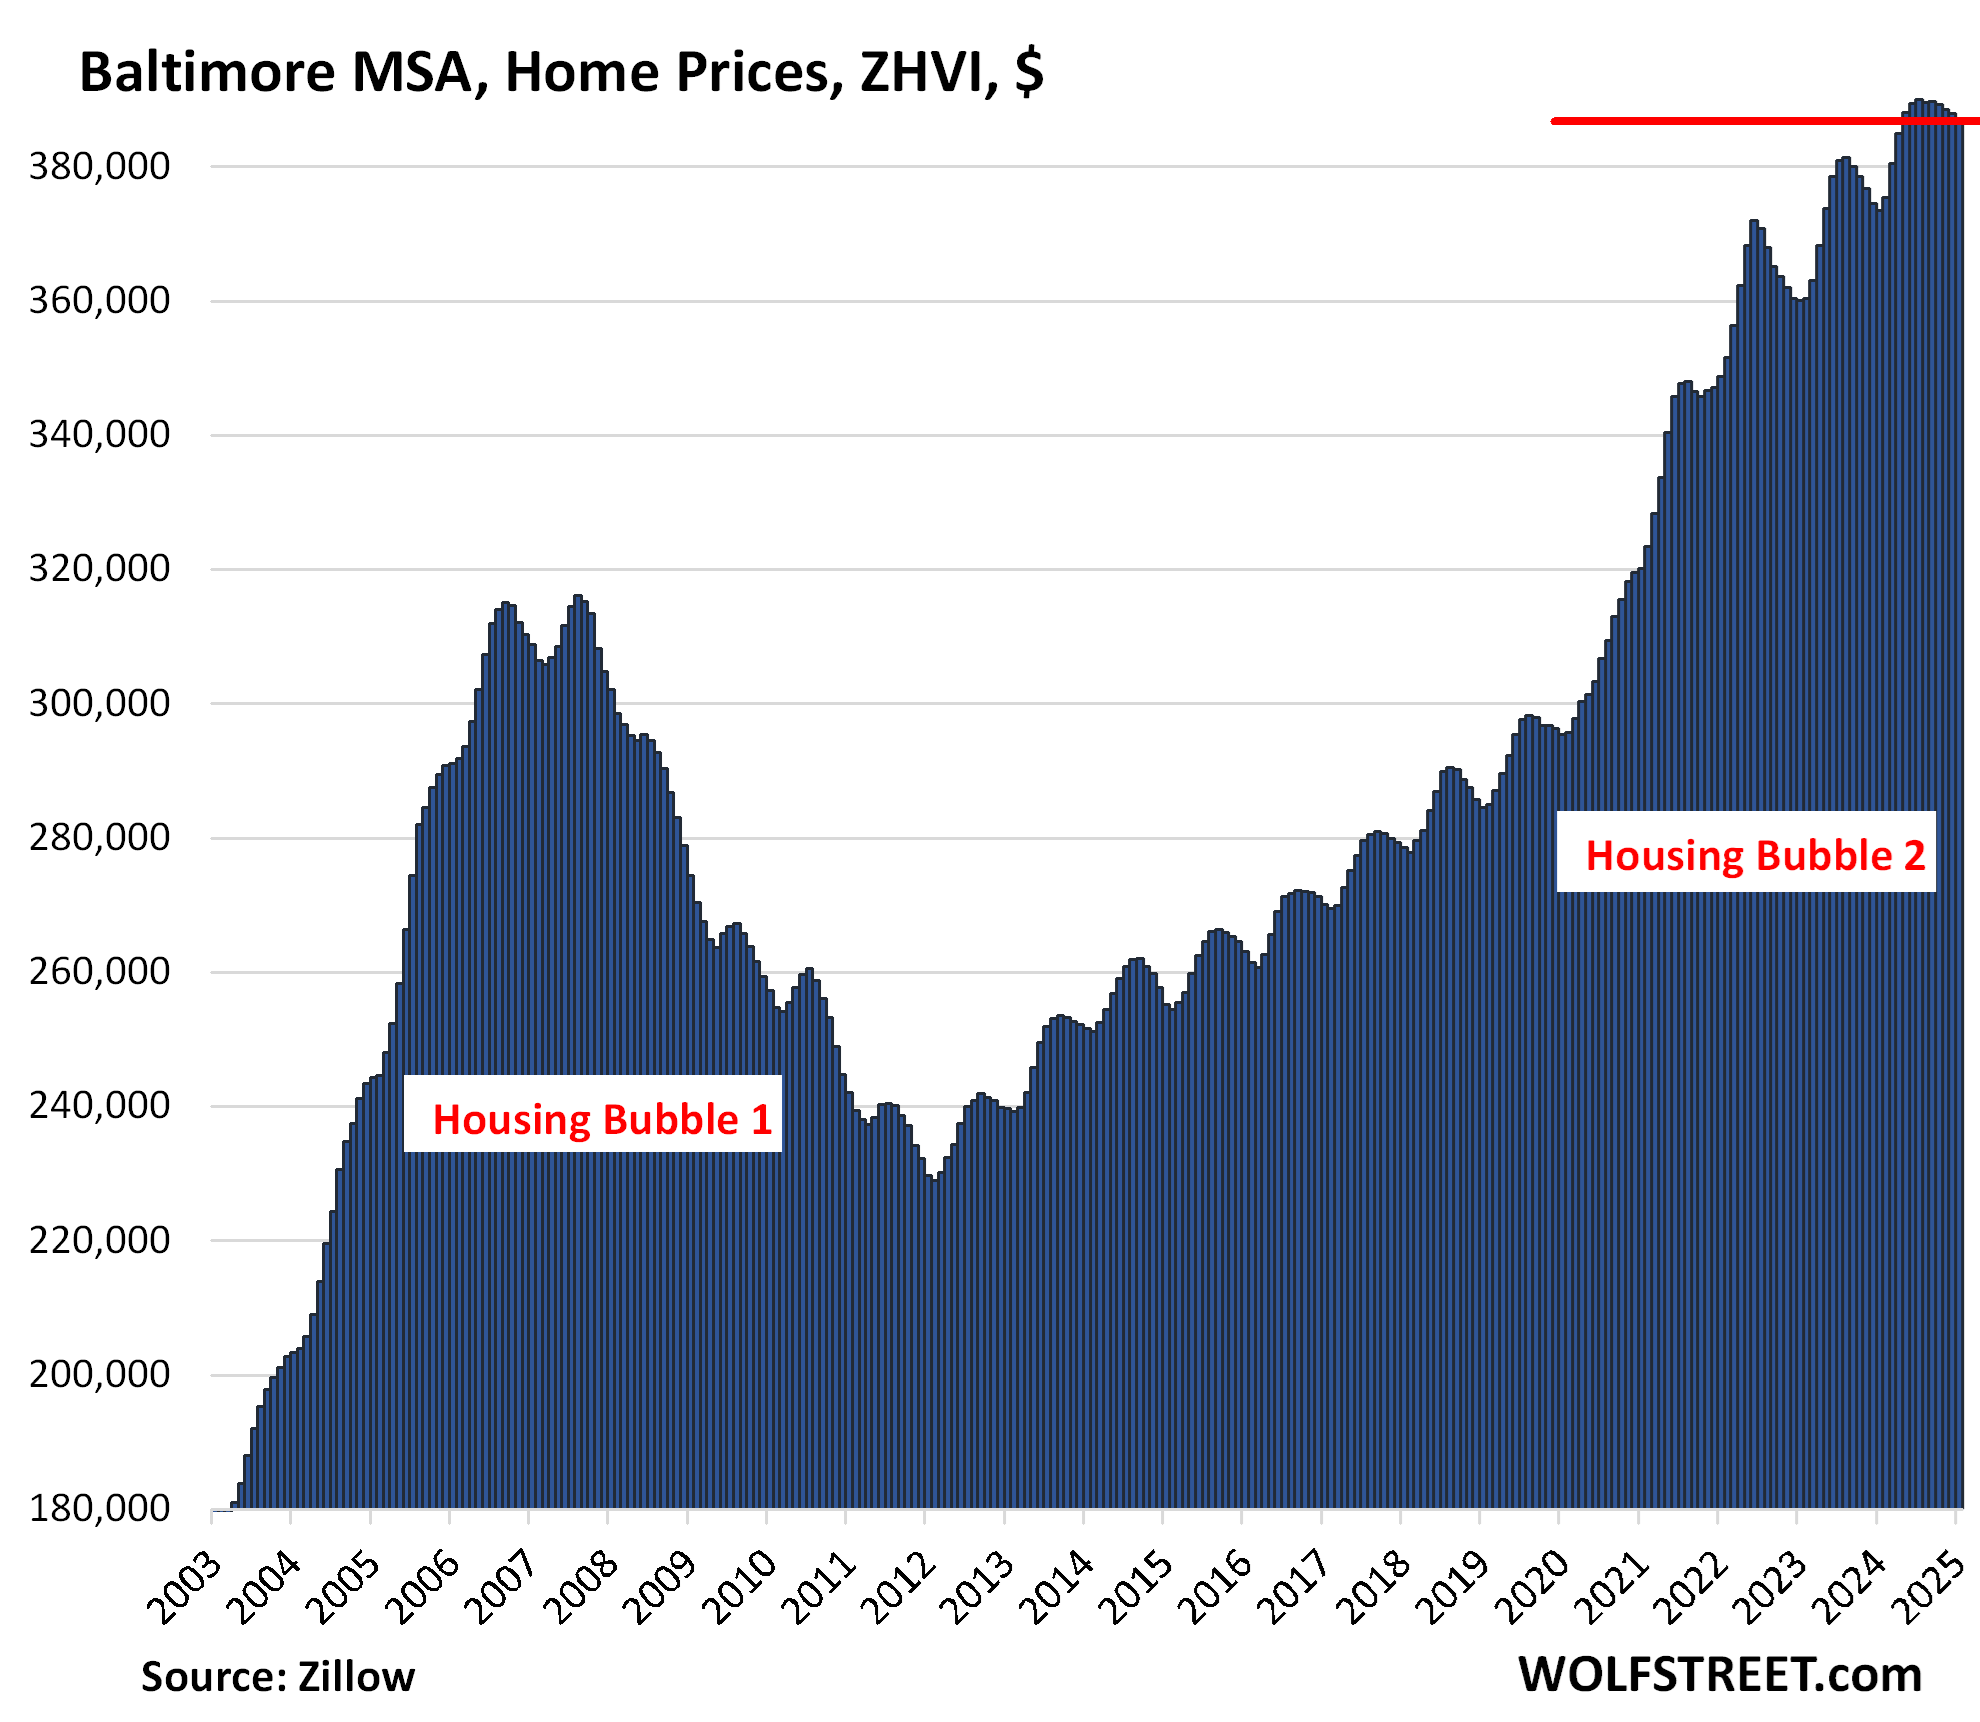
| Baltimore MSA, Home Prices | |||
| MoM | YoY | Since 2000 | |
| -0.2% | 3.7% | 173% | |
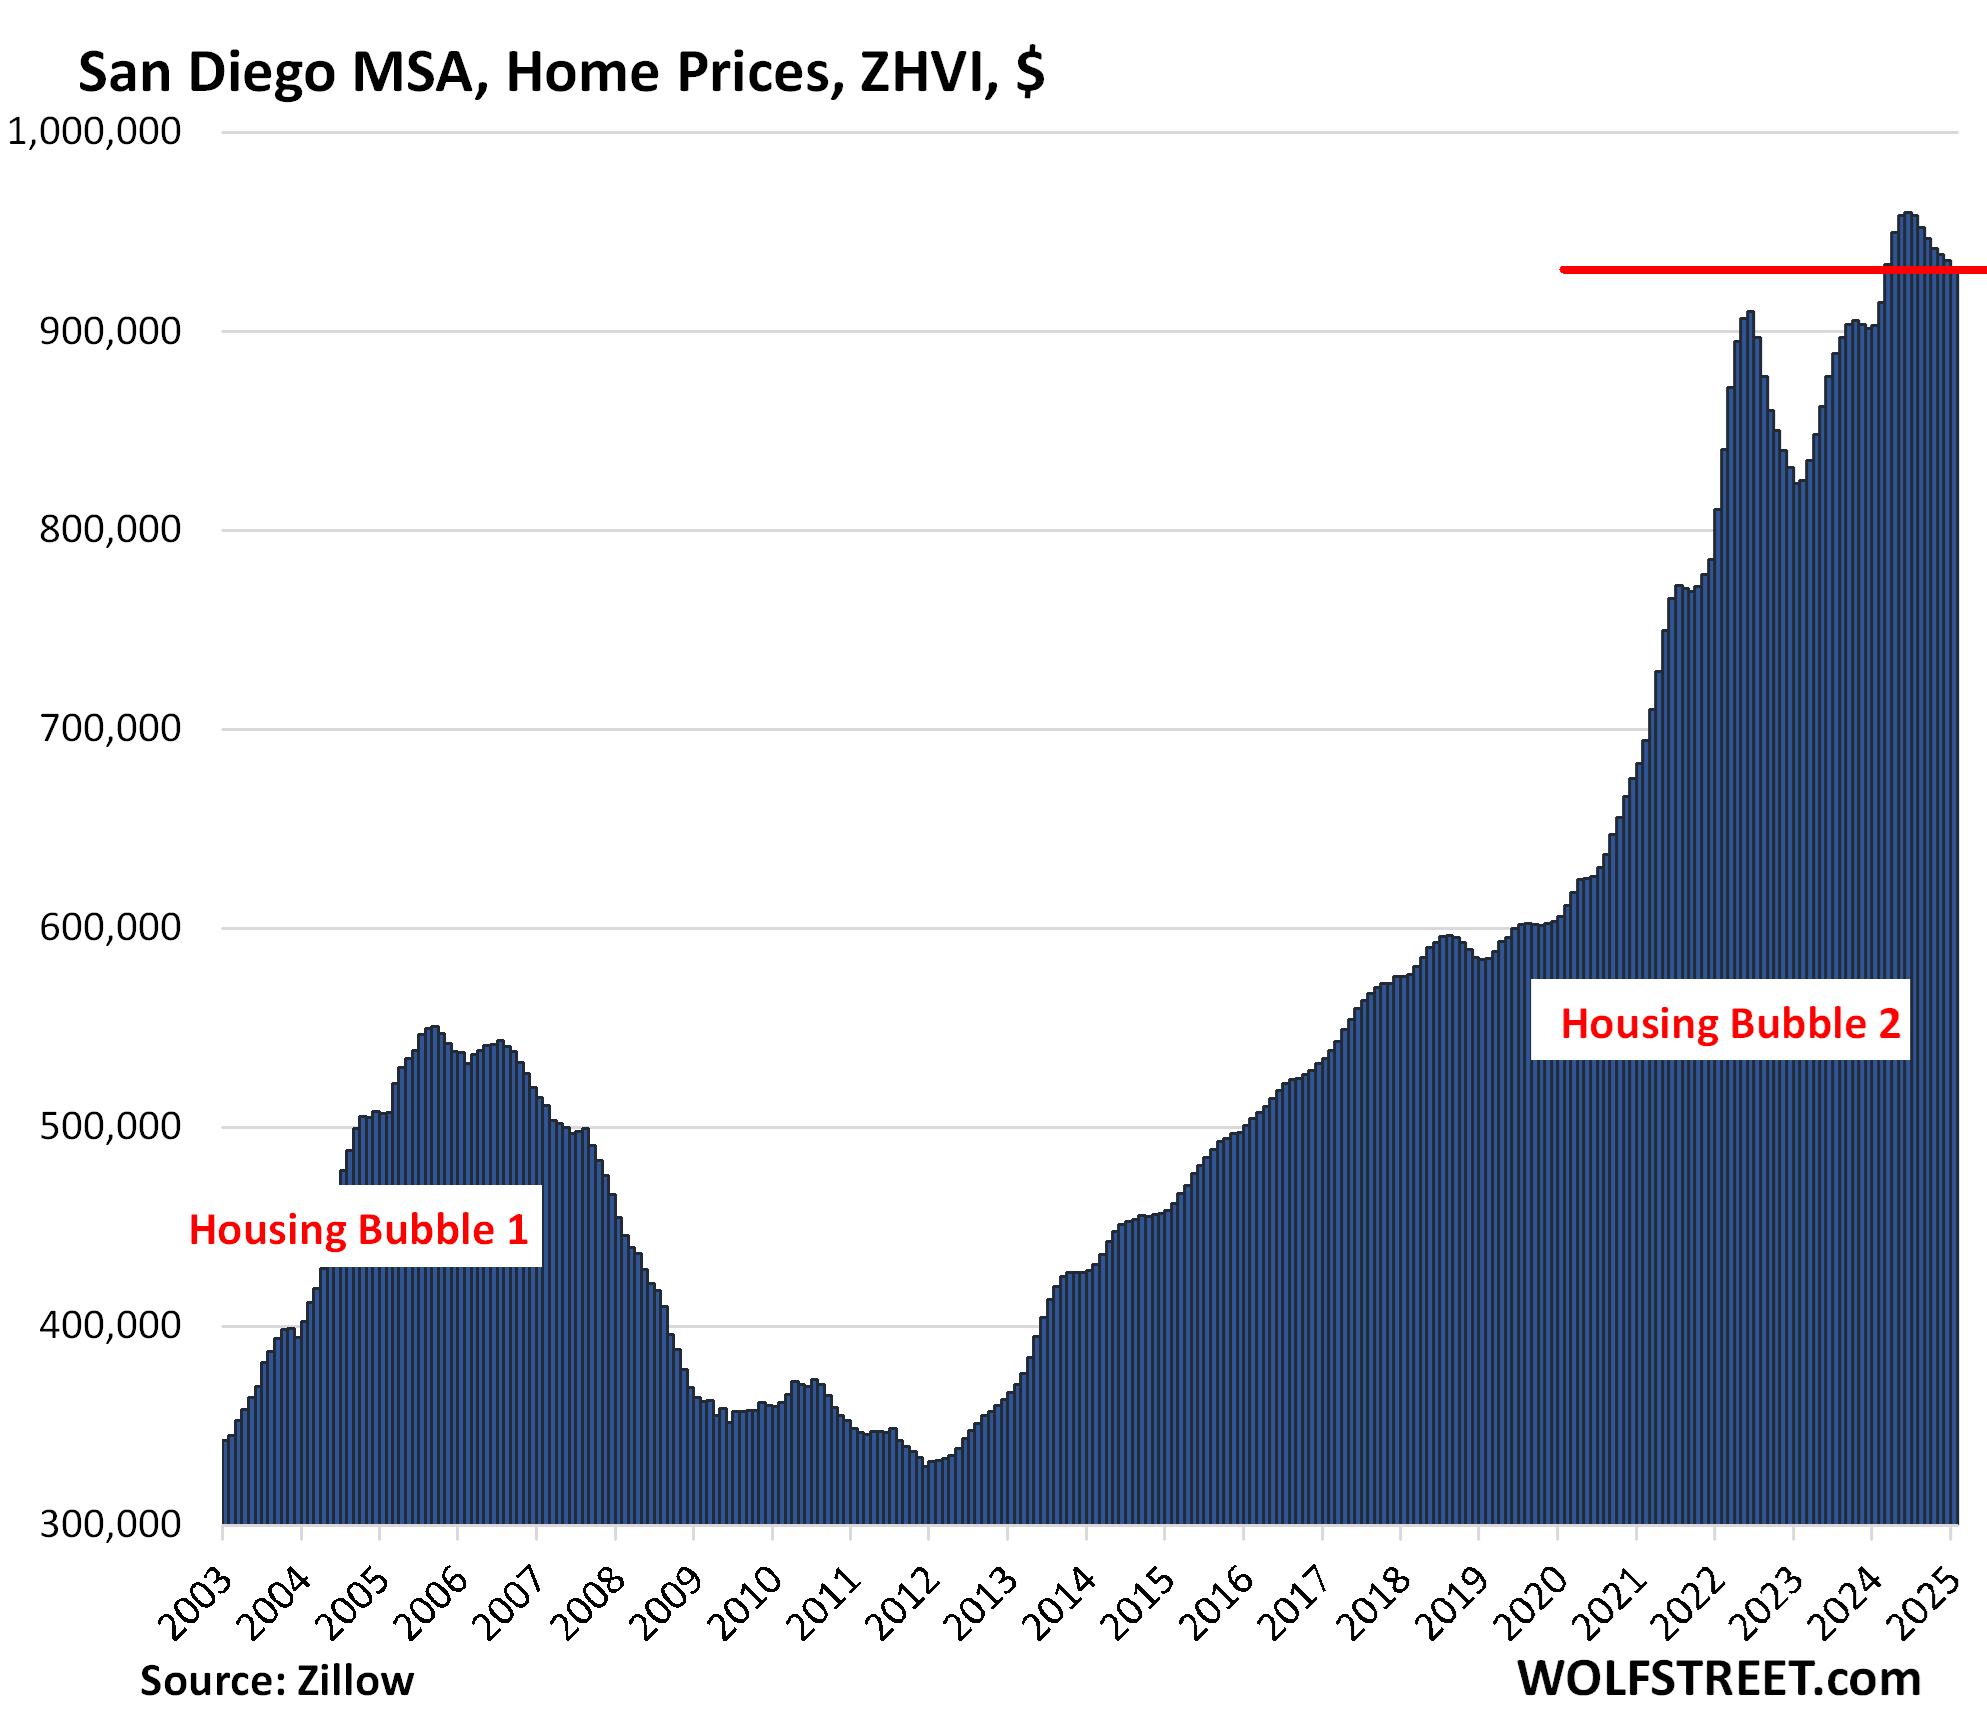
| San Diego MSA, Home Prices | ||
| MoM | YoY | Since 2000 |
| -0.4% | 3.2% | 331% |
| Kansas City MSA, Home Prices | ||
| MoM | YoY | Since 2000 |
| -0.3% | 3.7% | 174% |

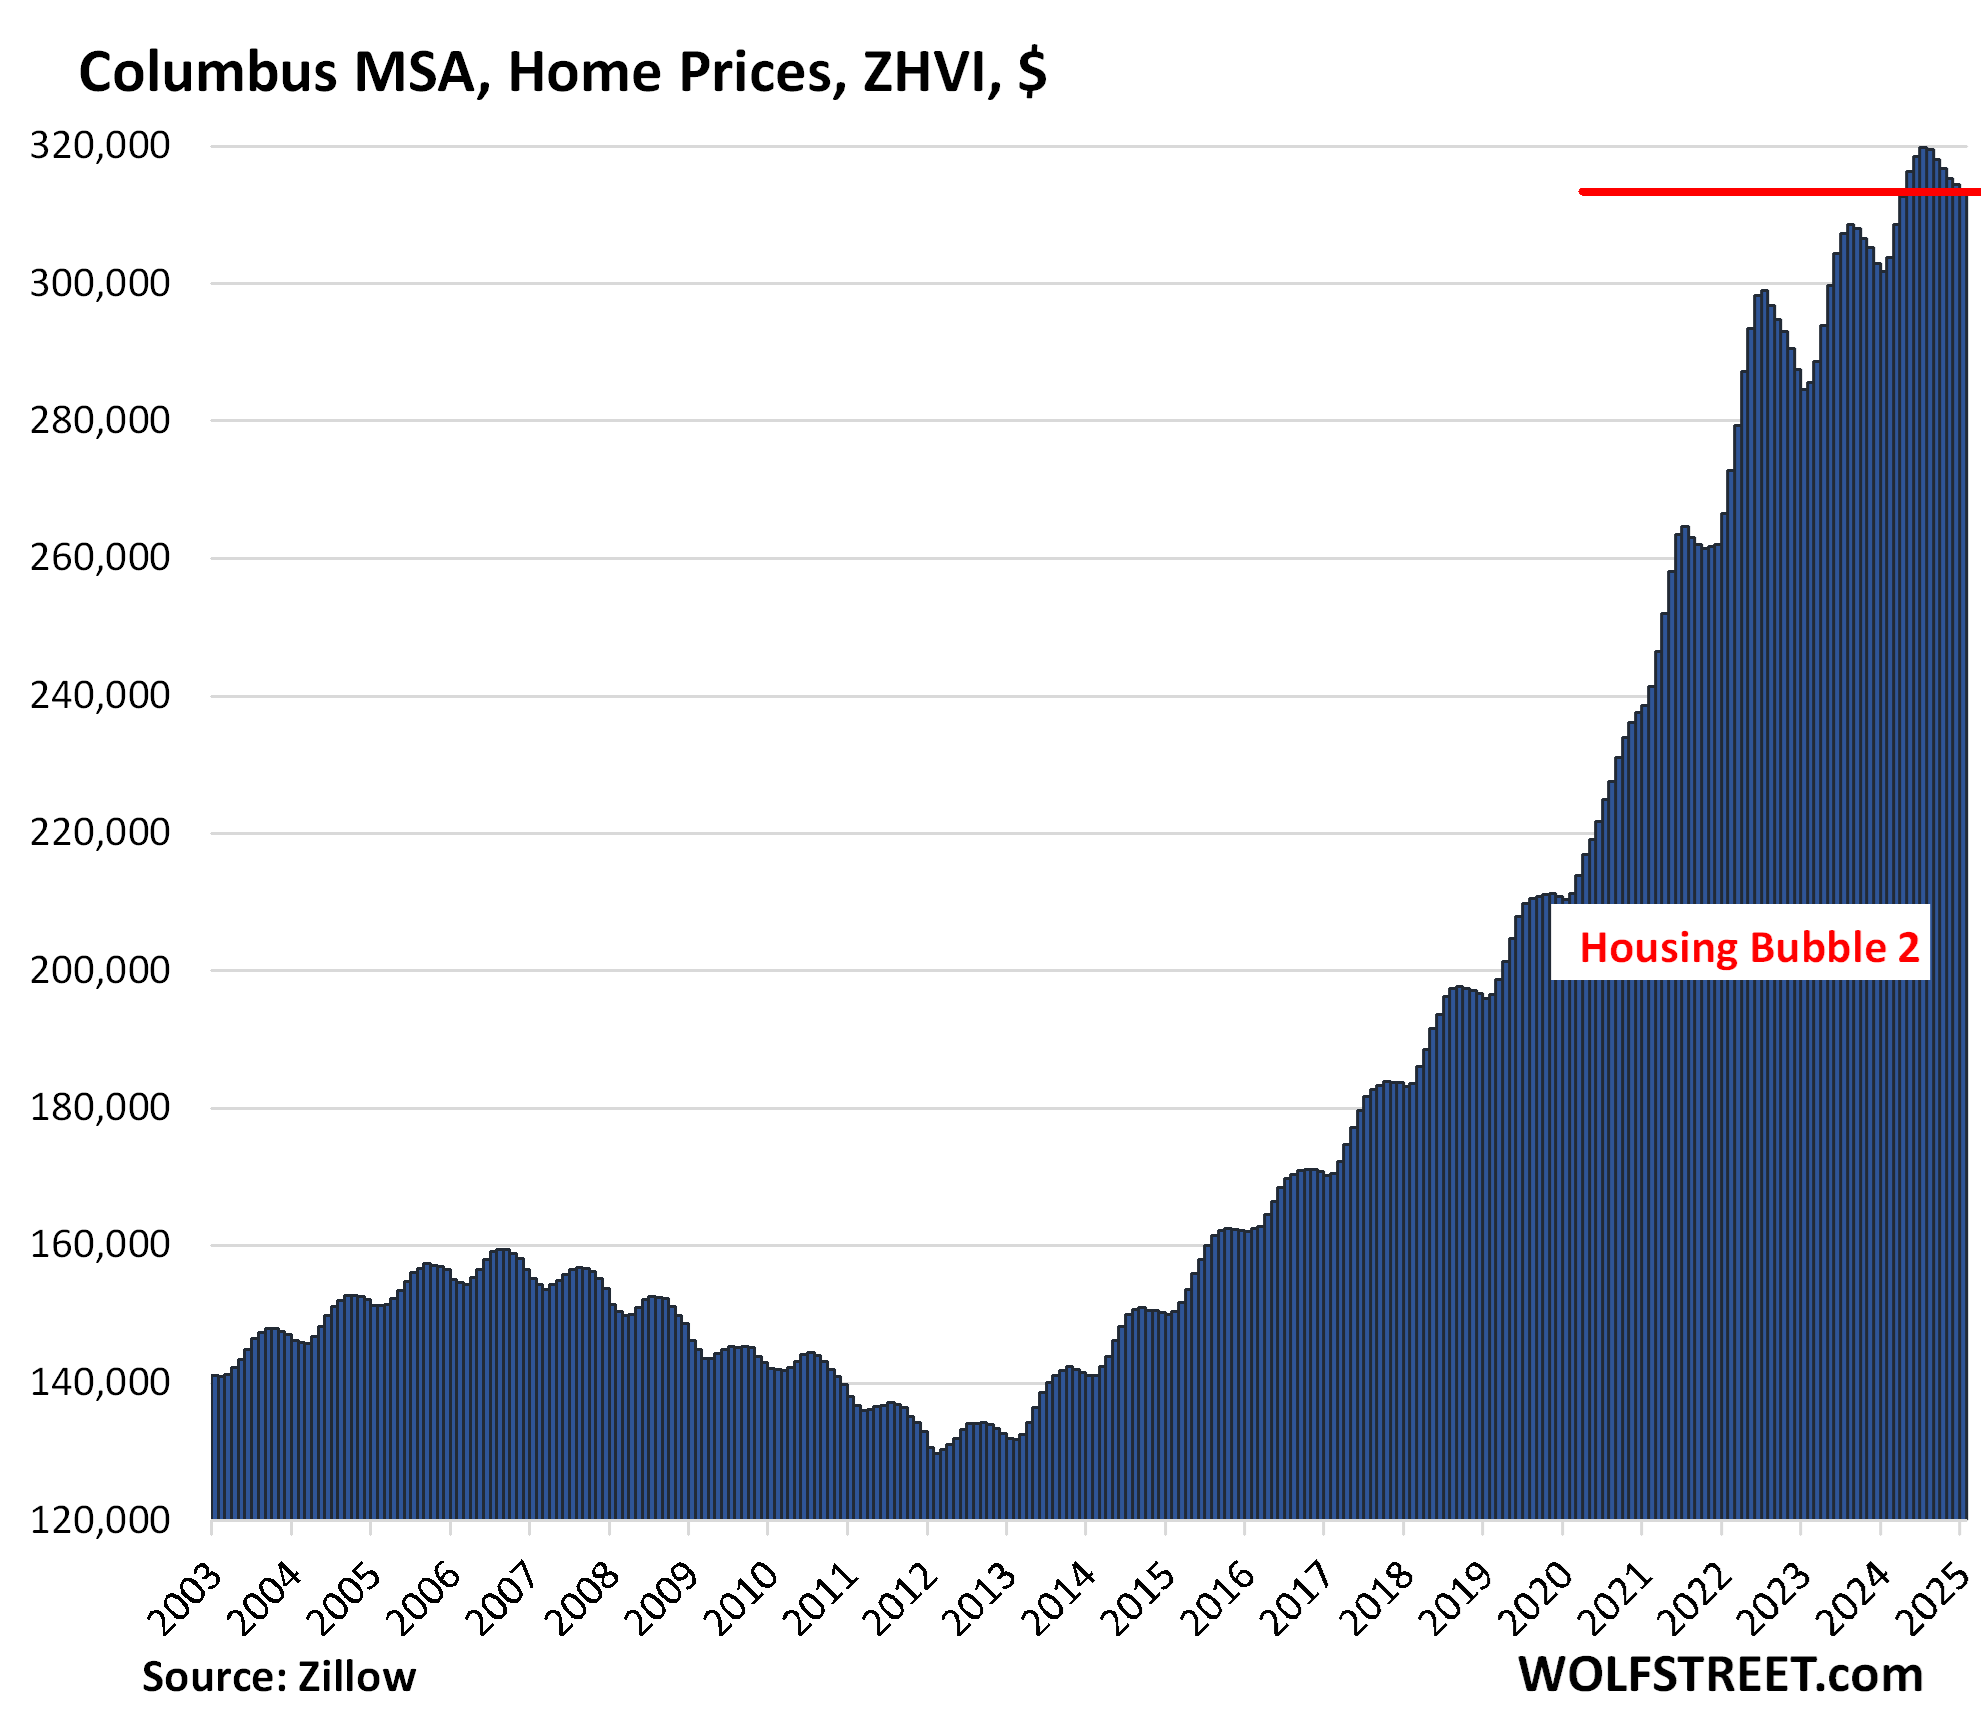
| Columbus MSA, Home Prices | ||
| MoM | YoY | Since 2000 |
| -0.3% | 3.8% | 152% |
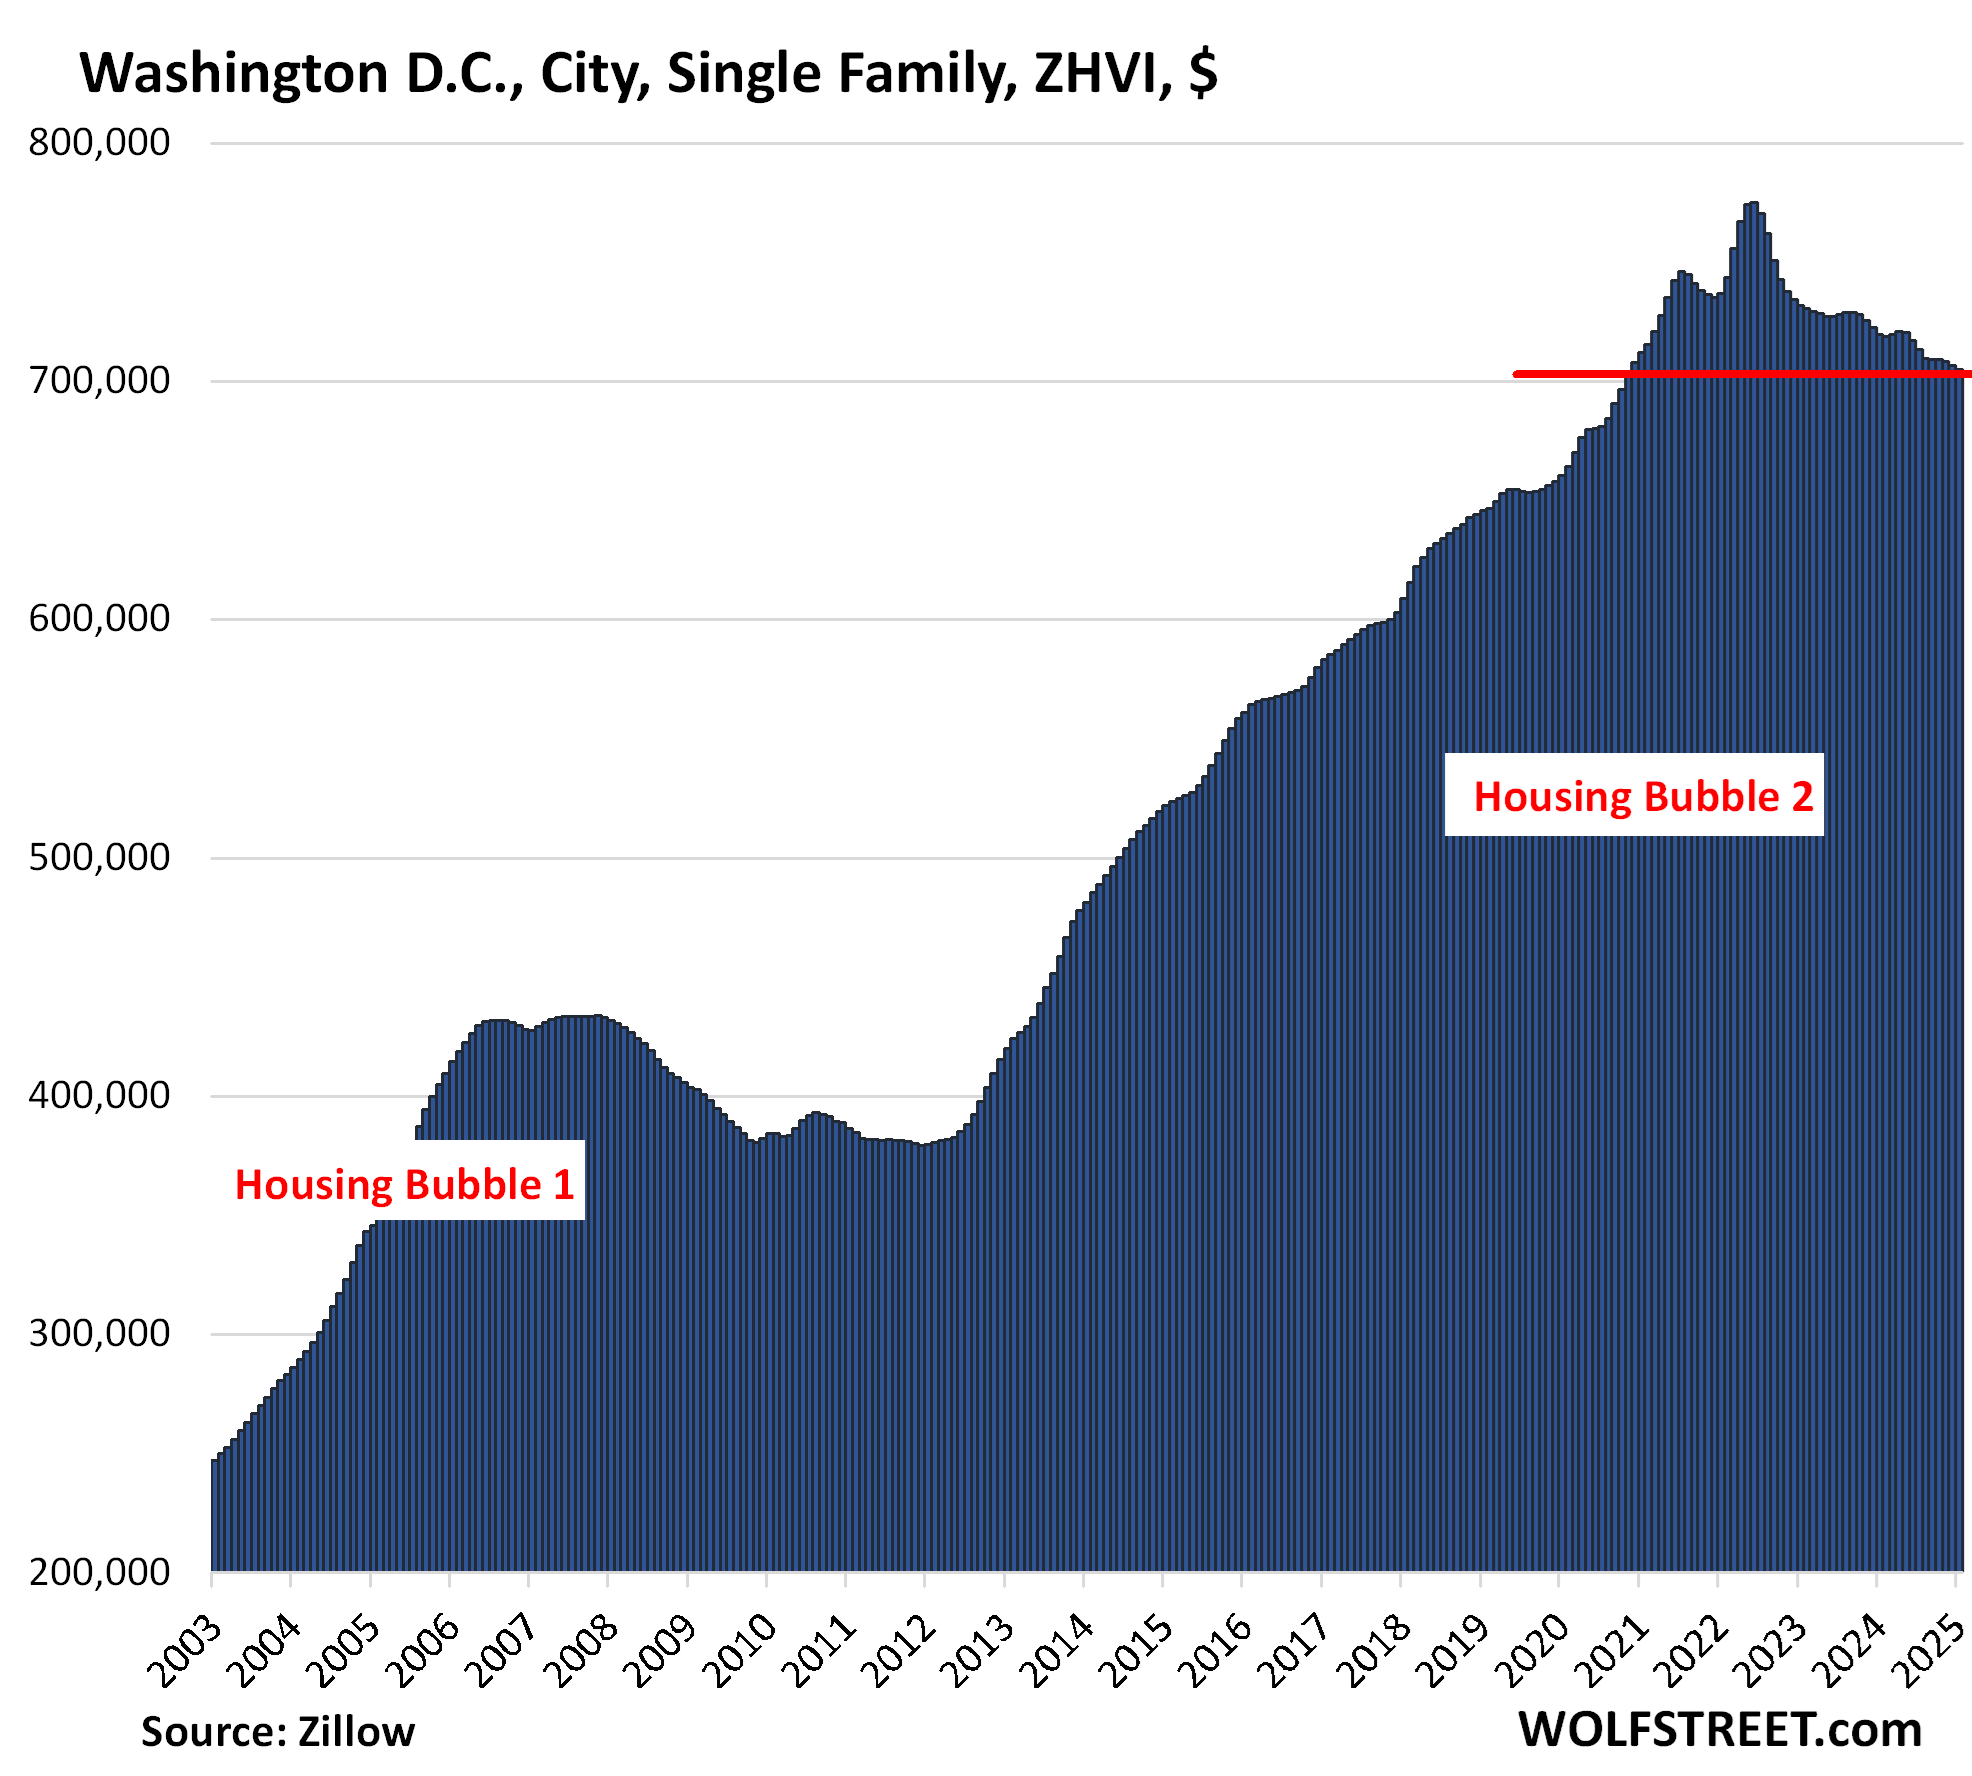
| Washington D.C. MSA, Home Prices | ||
| MoM | YoY | Since 2000 |
| -0.1% | 4.5% | 215% |
The huge metro includes Washington D.C. and parts of Maryland, Virginia, and West Virginia.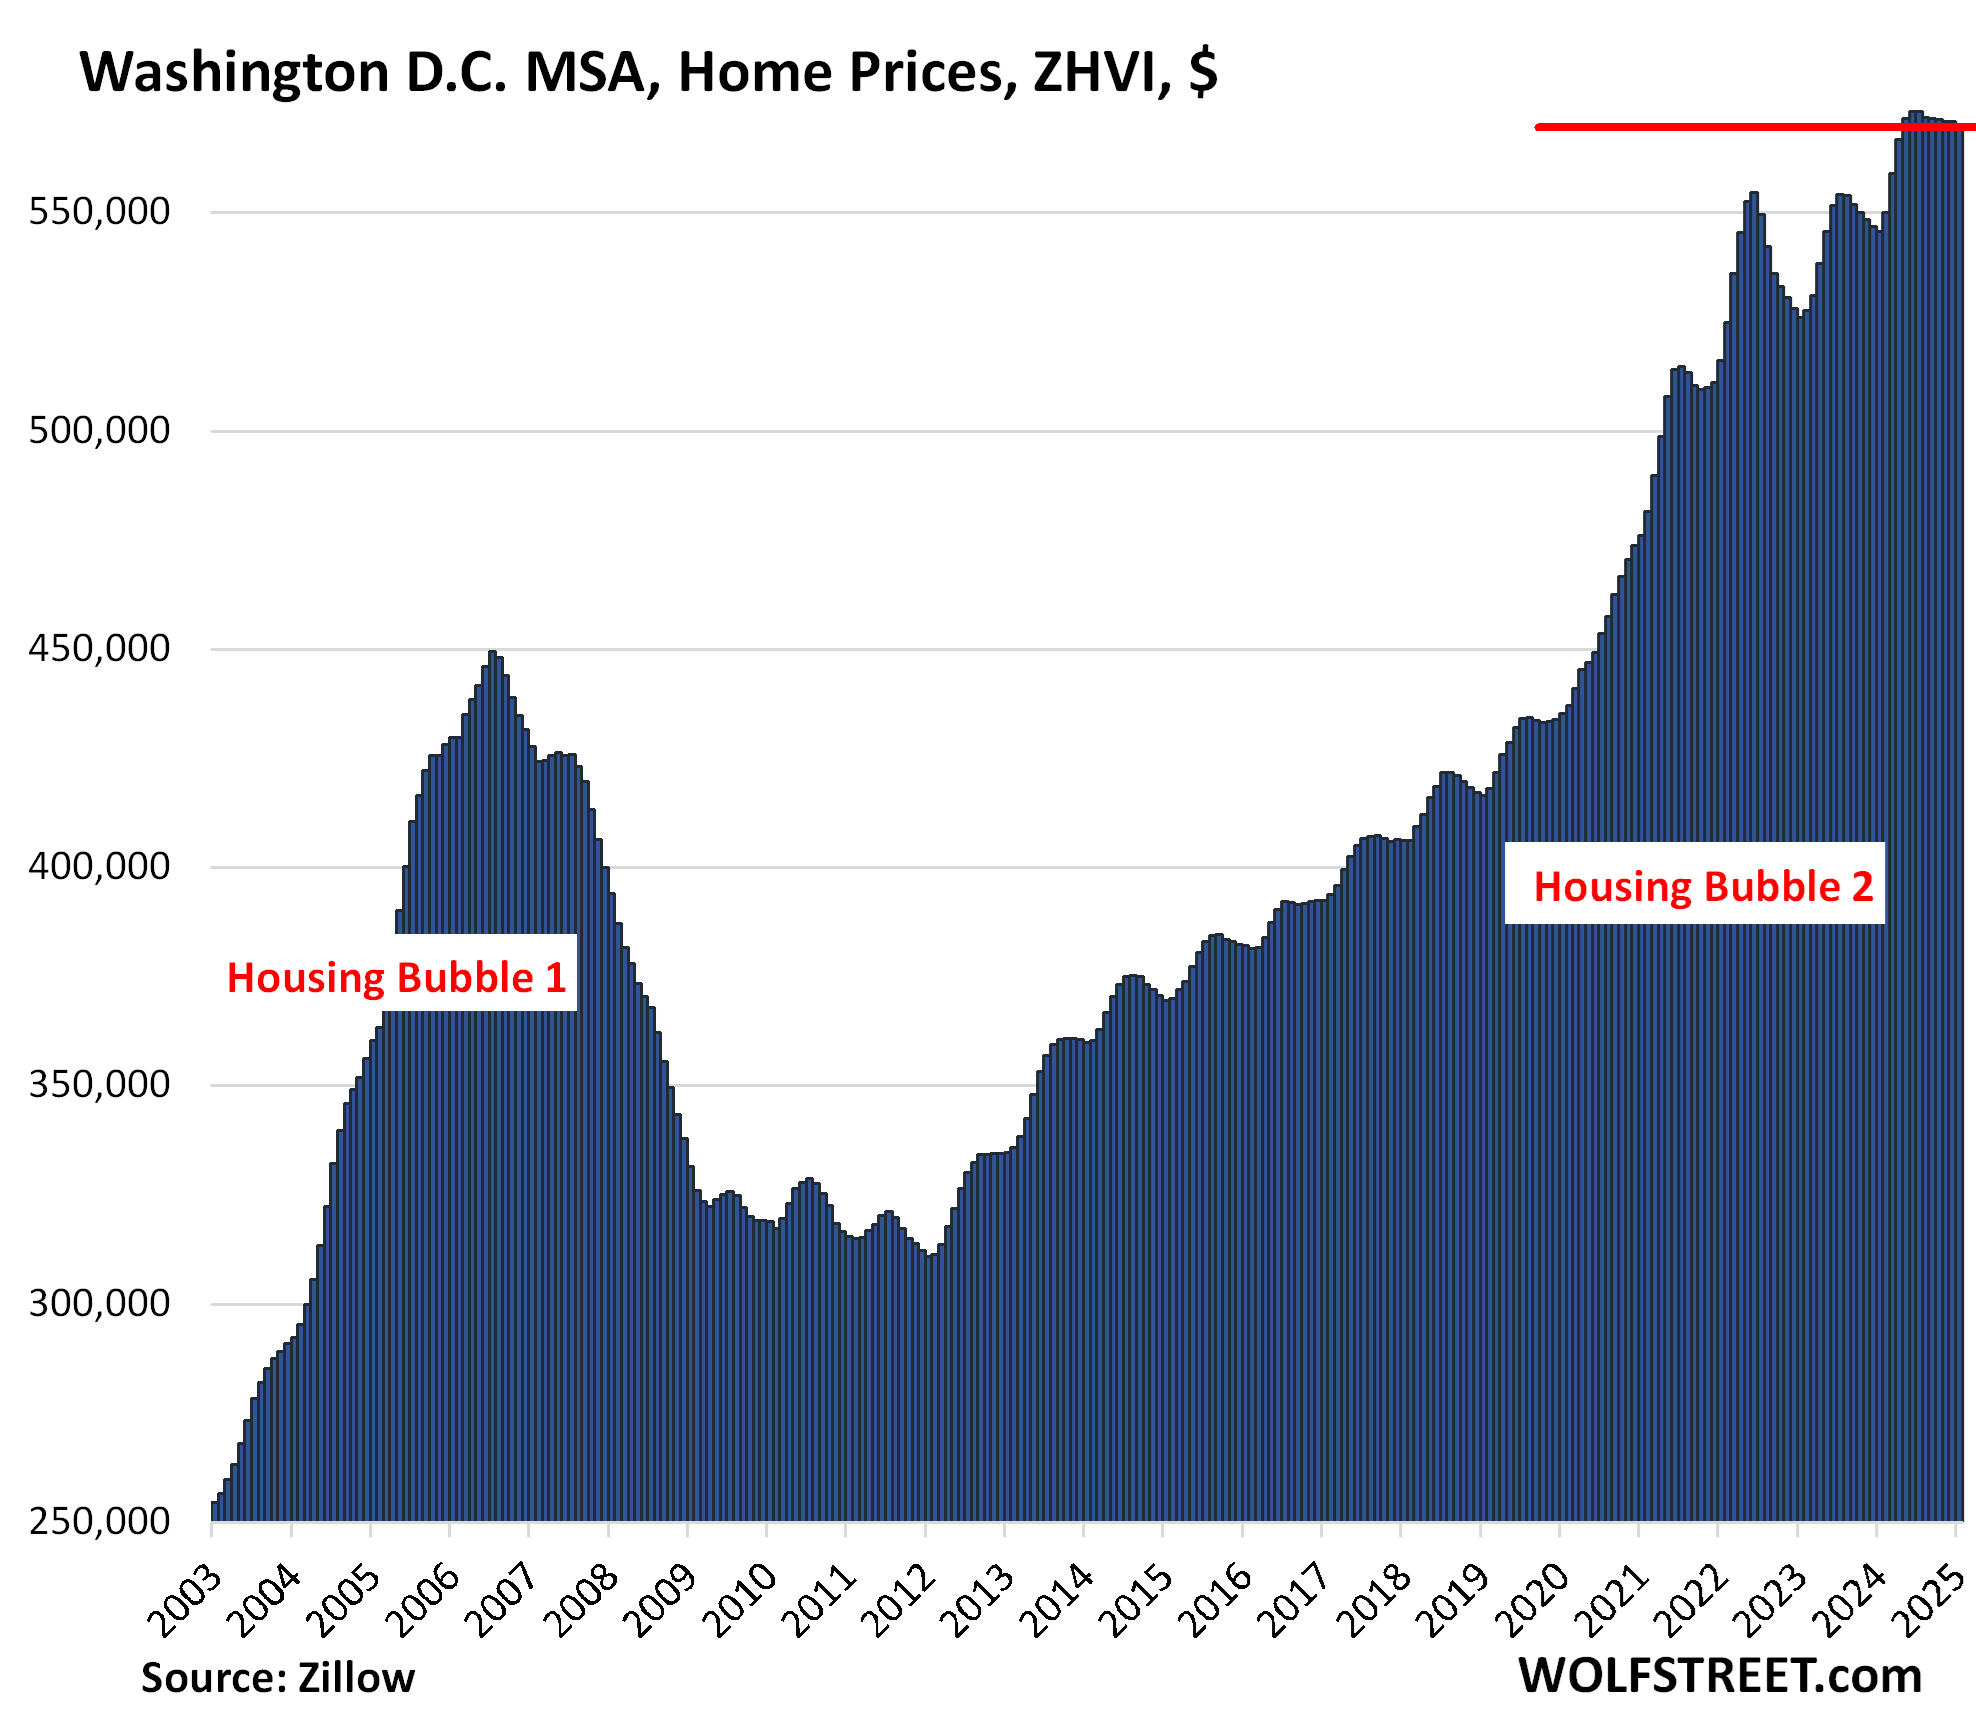
But in Washington D.C., the city by itself, prices of single-family houses, seasonally adjusted, have dropped by 9.1% from the peak, to the lowest level since November 2020.
This shows how there can be a big difference between the MSA index, which covers a lot of different markets, and the index of a city by itself:
| Washington D.C., City, Single-Family Home Prices | |||
| From Jun 2022 | MoM | YoY | Since 2000 |
| -9.1% | -0.3% | -2.1% | 287% |
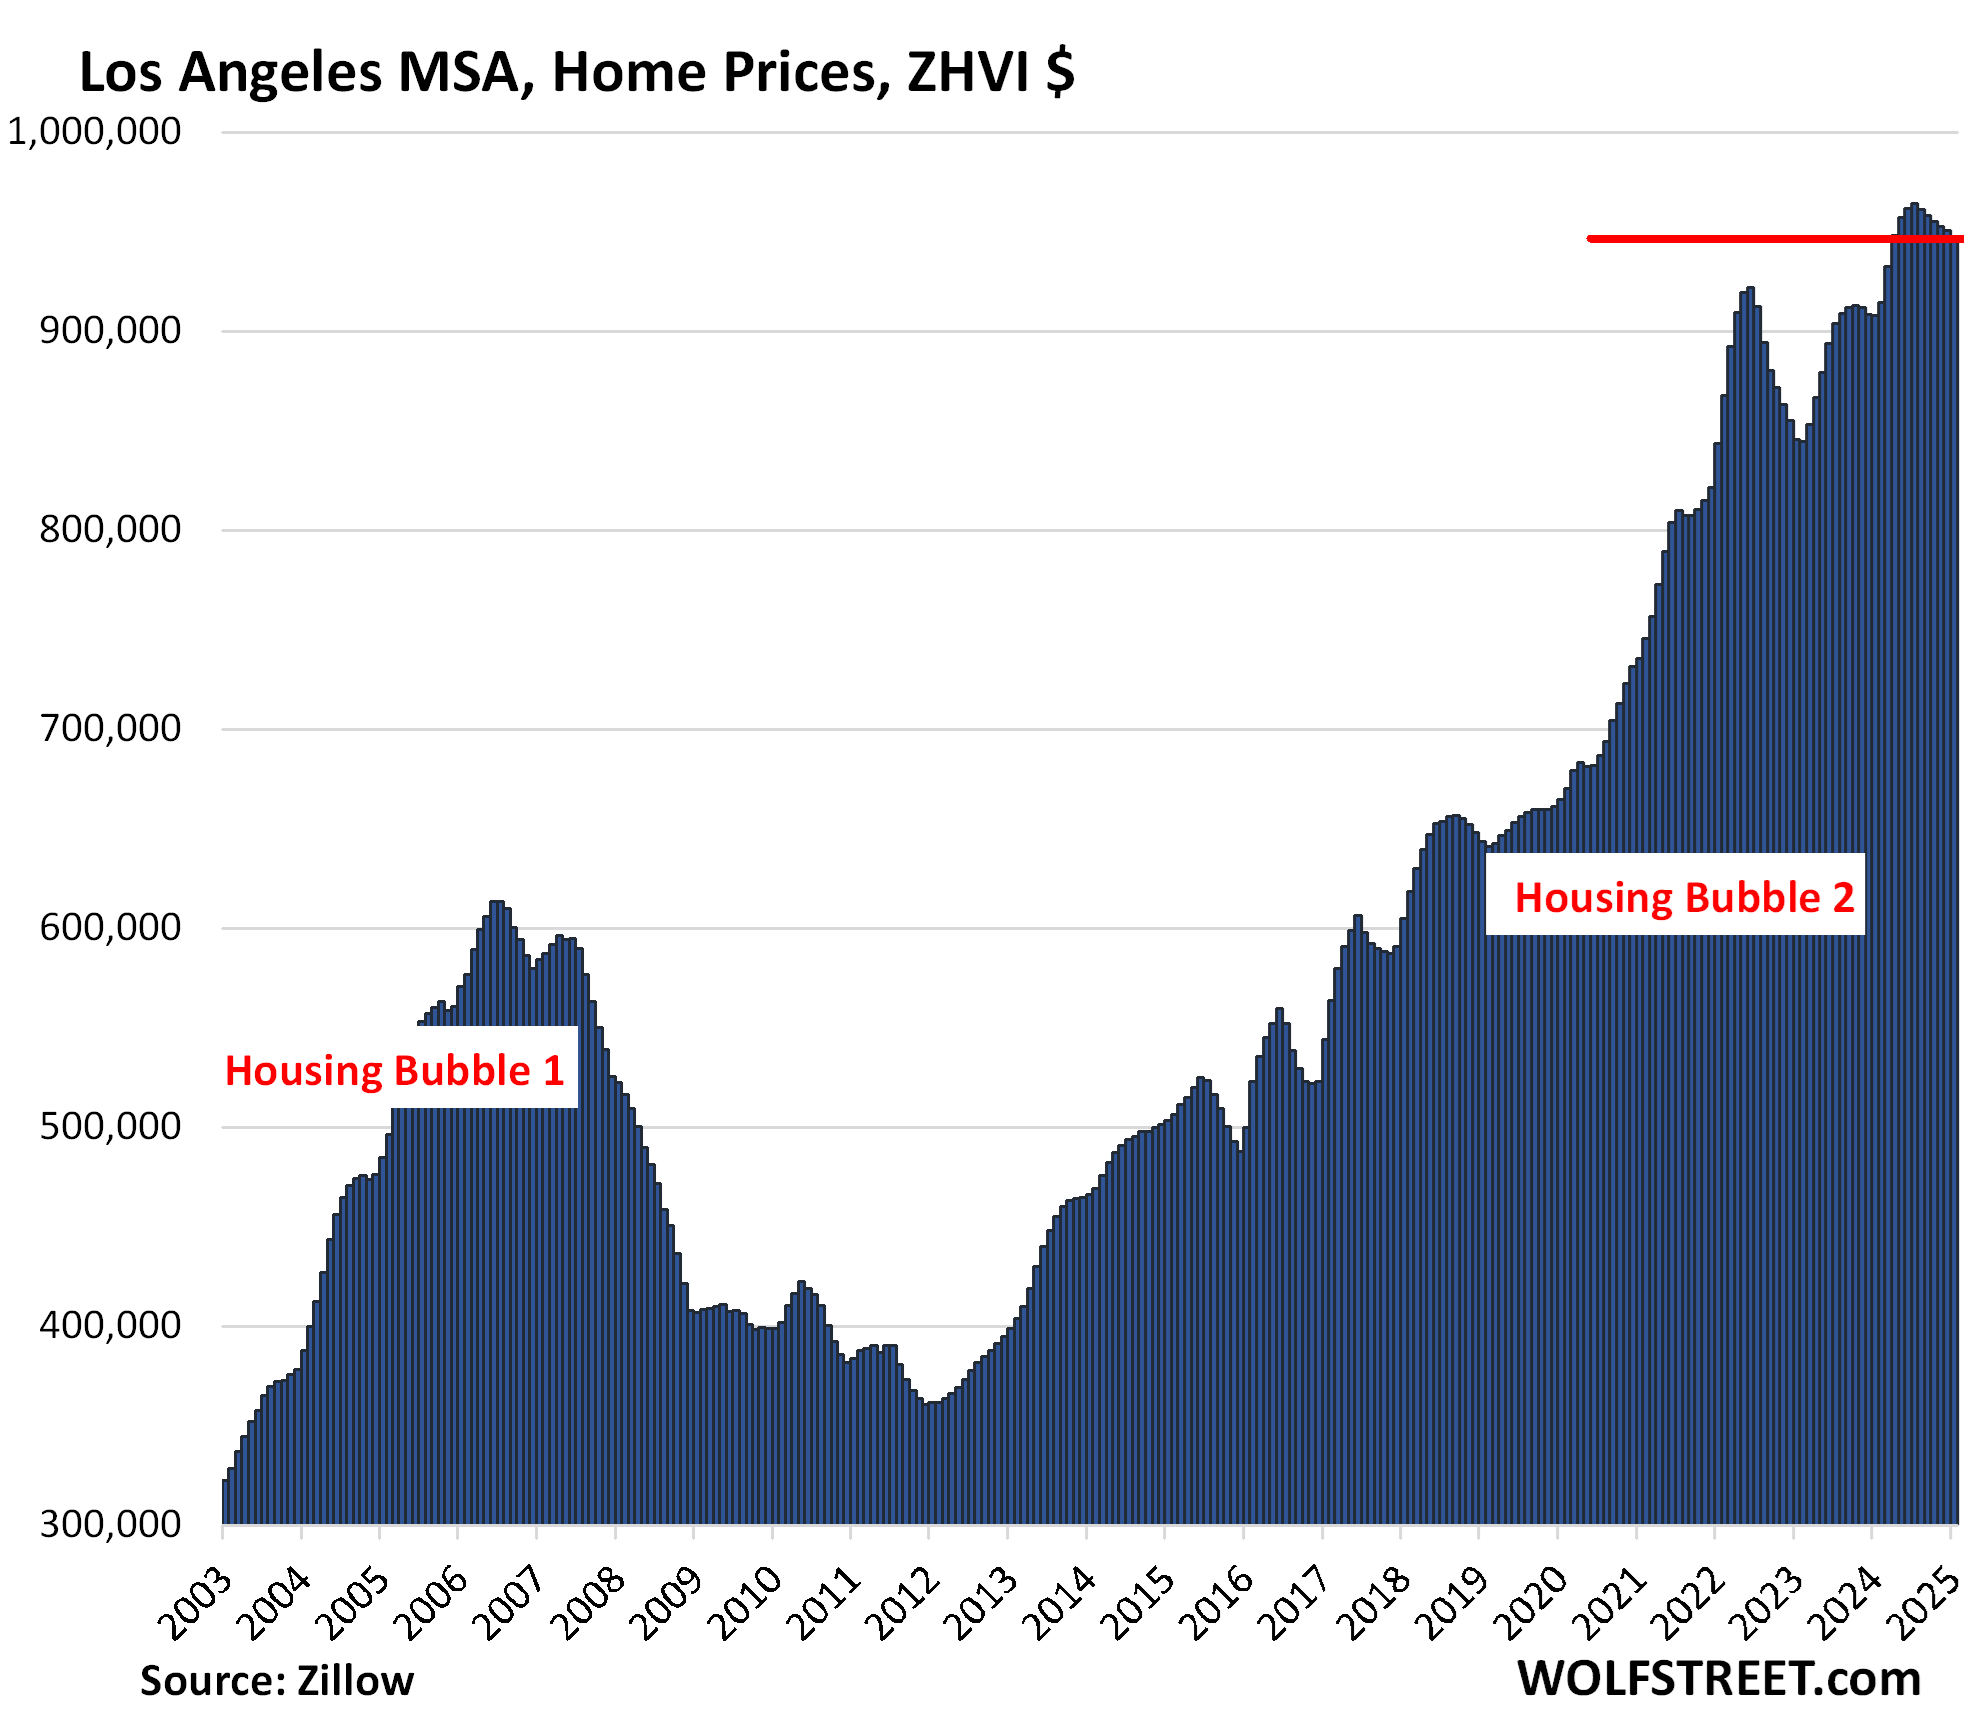
| Los Angeles MSA, Home Prices | ||
| MoM | YoY | Since 2000 |
| -0.4% | 4.3% | 327% |
| Philadelphia MSA, Home Prices | ||
| MoM | YoY | Since 2000 |
| -0.3% | 4.6% | 199% |

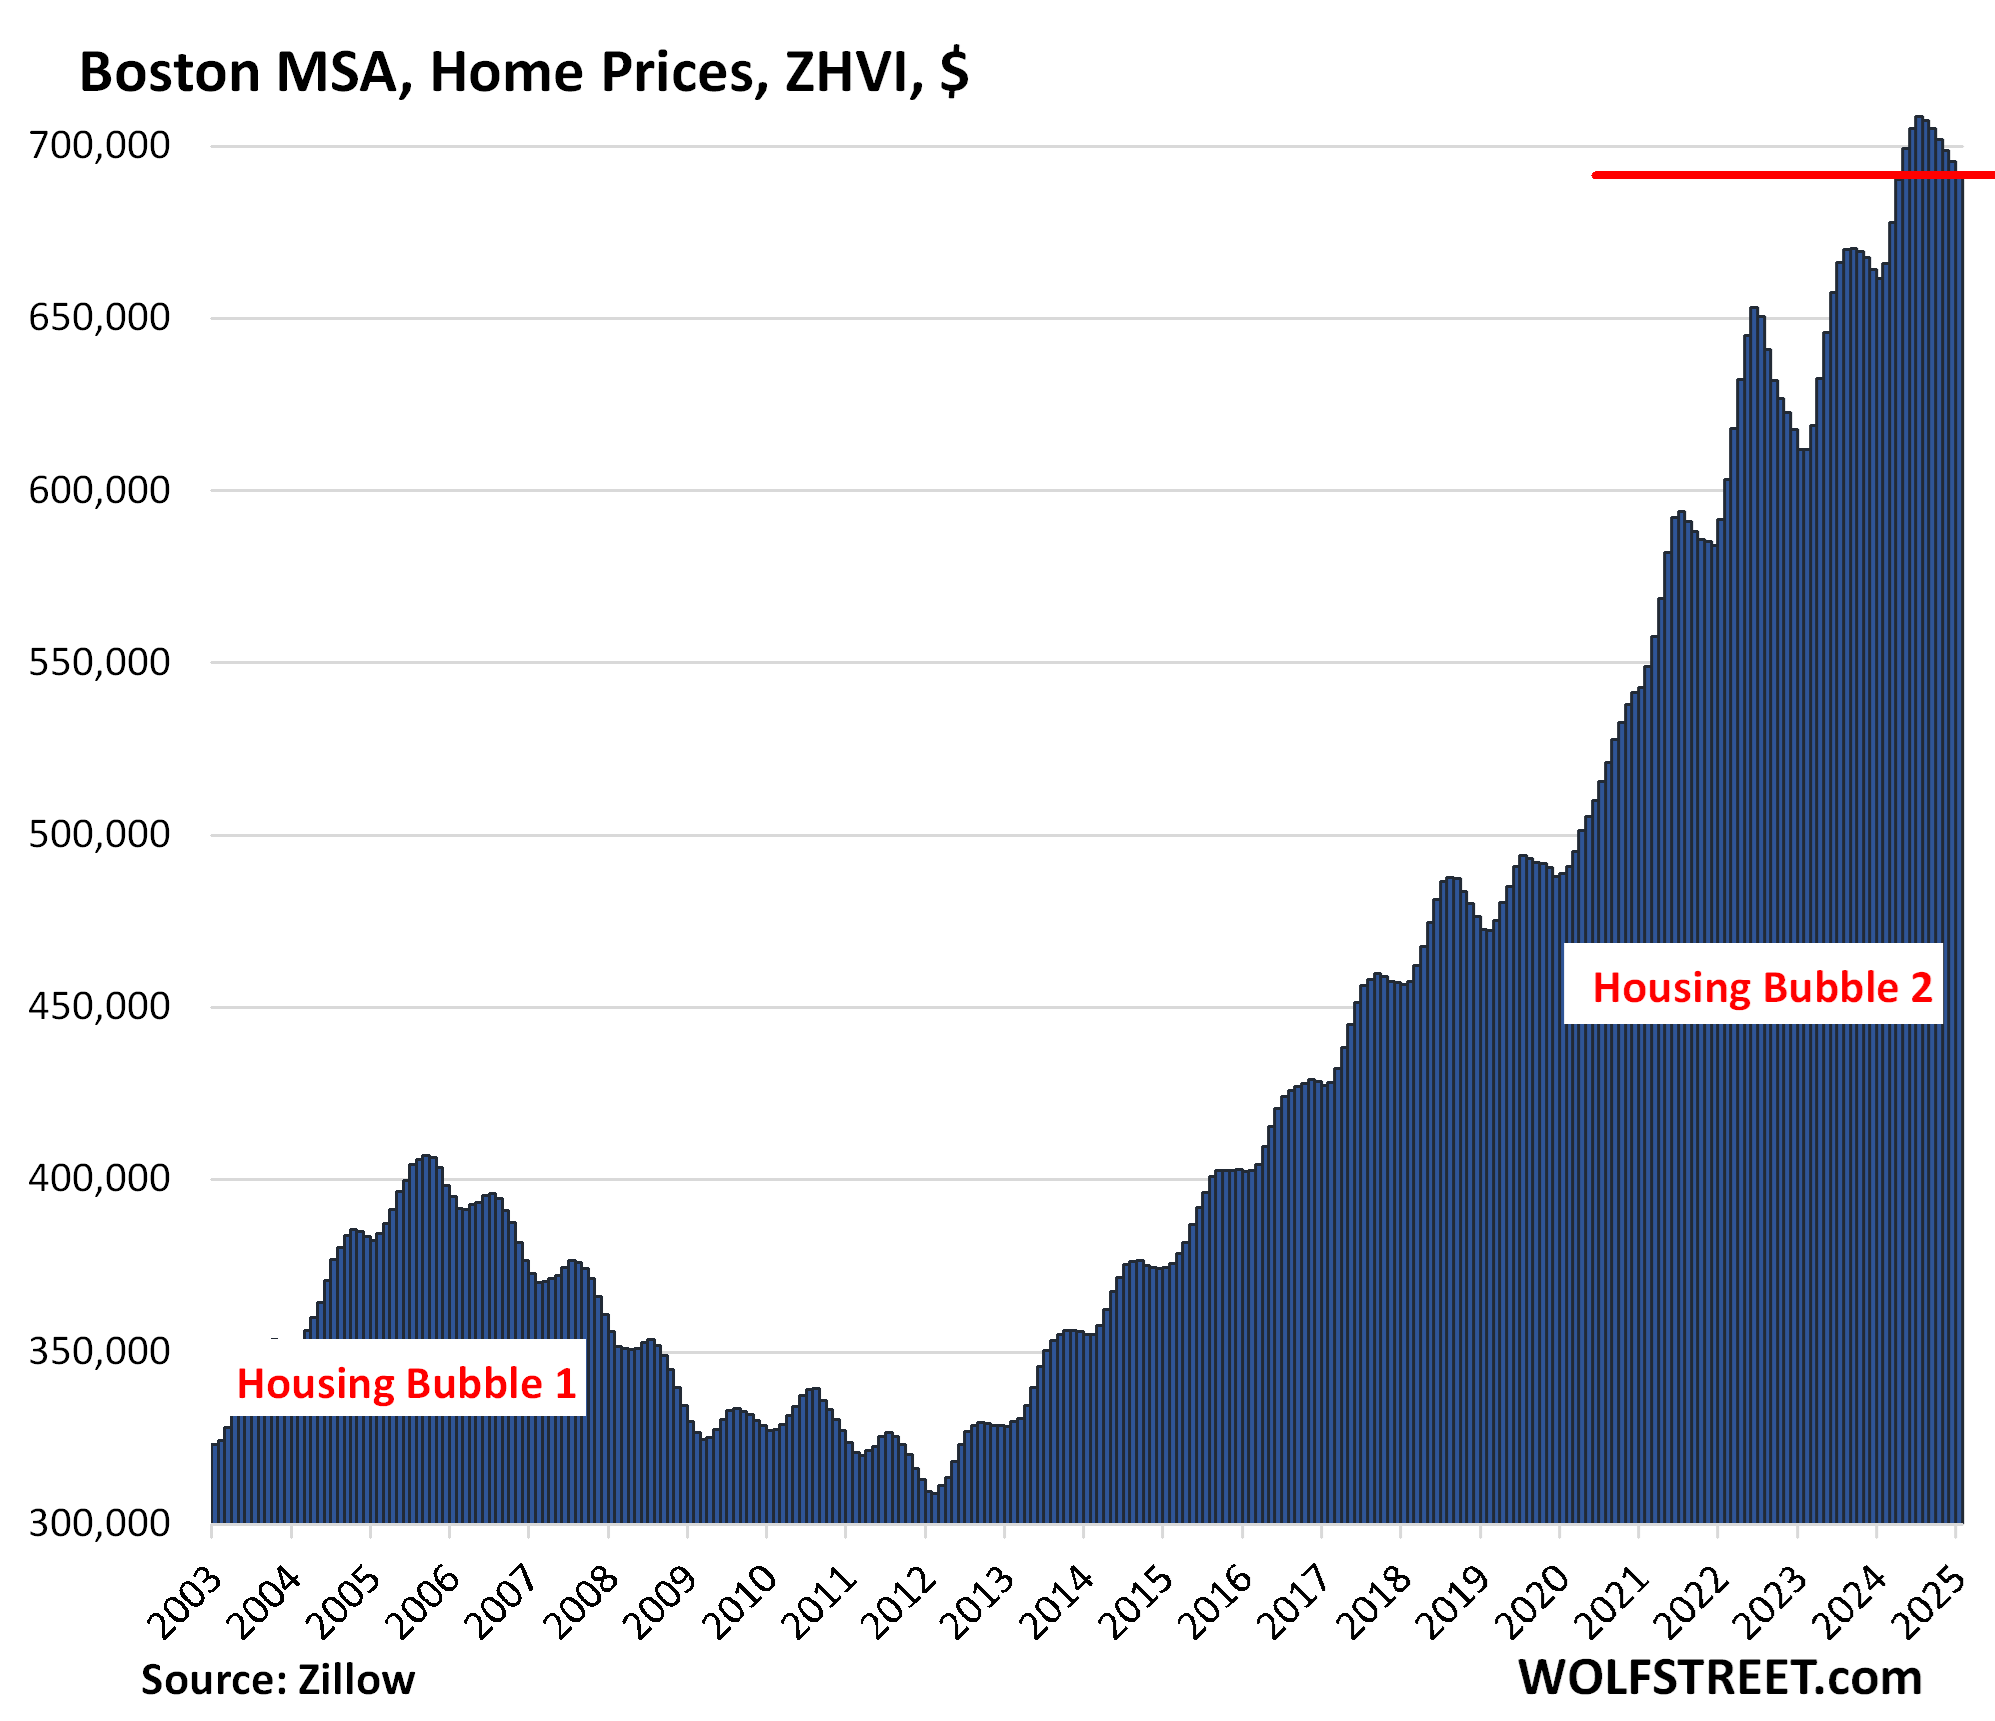
| Boston MSA, Home Prices | ||
| MoM | YoY | Since 2000 |
| -0.5% | 4.6% | 222% |
| Milwaukee MSA, Home Prices | ||
| MoM | YoY | Since 2000 |
| -0.4% | 5.5% | 141.3% |

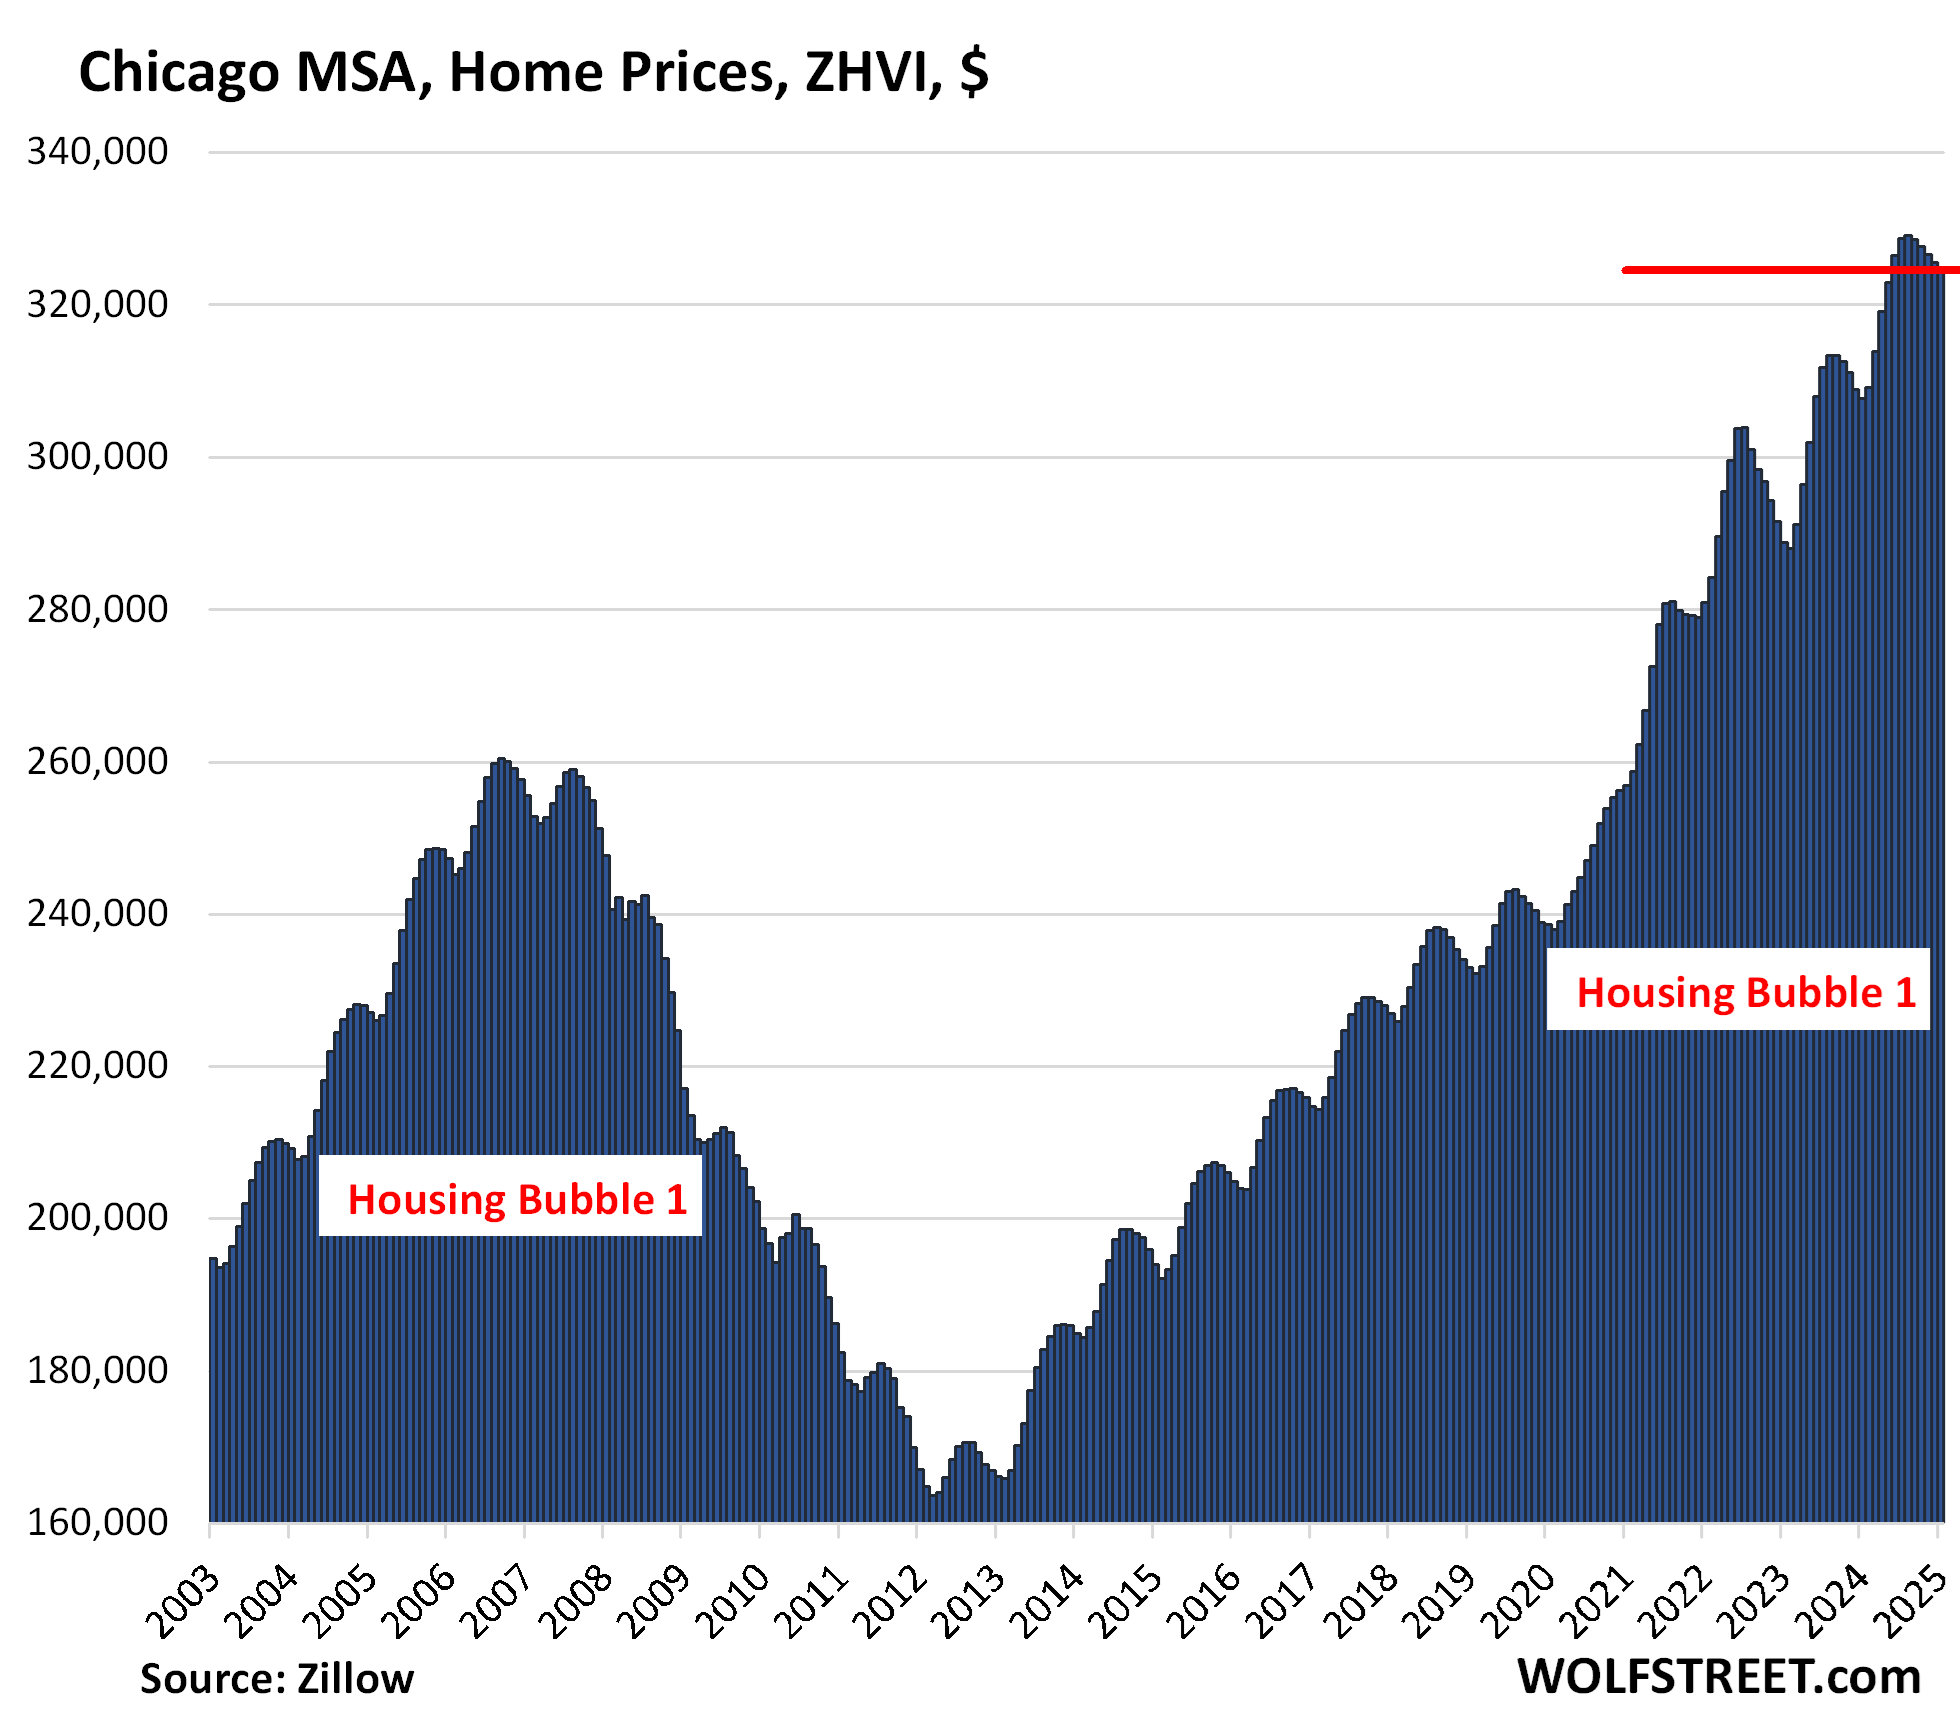
| Chicago MSA, Home Prices | ||
| MoM | YoY | Since 2000 |
| -0.3% | 5.5% | 111% |
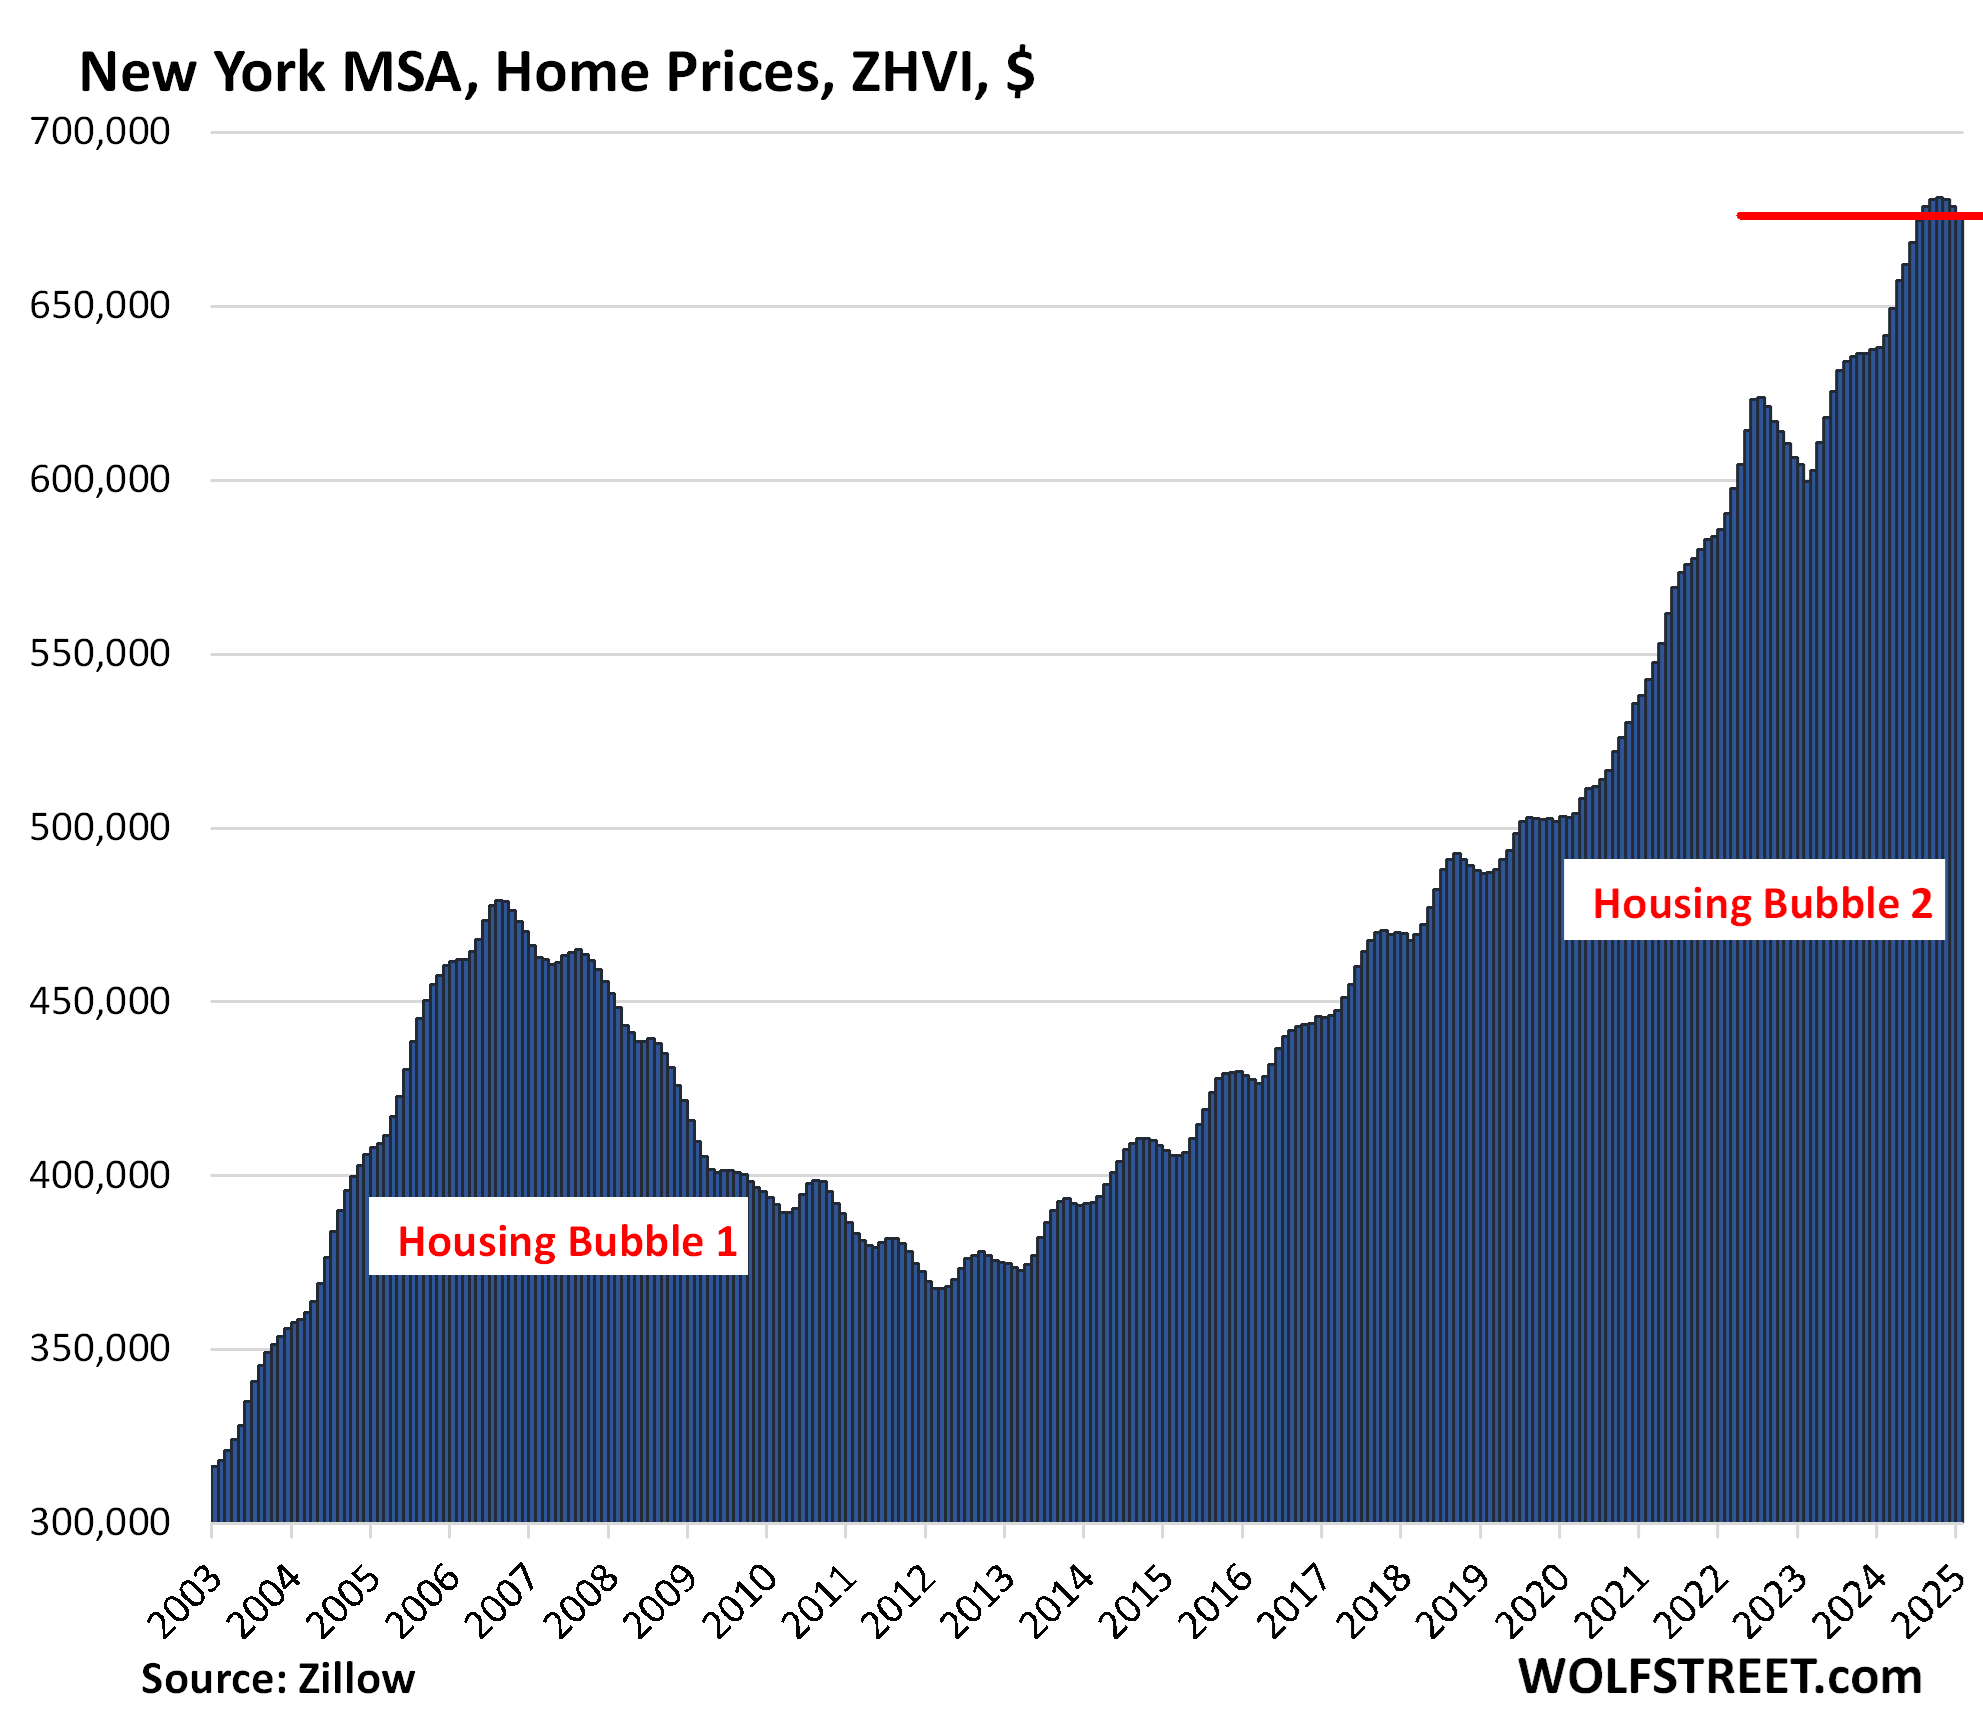
| New York MSA, Home Prices | ||
| MoM | YoY | Since 2000 |
| -0.3% | 6.0% | 210% |
Enjoy reading WOLF STREET and want to support it? You can donate. I appreciate it immensely. Click on the beer and iced-tea mug to find out how:

Would you like to be notified via email when WOLF STREET publishes a new article? Sign up here.
![]()
The post The Most Splendid Housing Bubbles in America, Jan 2024: The Price Drops & Gains in 33 of the Largest Housing Markets appeared first on Energy News Beat.
Energy News Beat