
Payrolls & wages jump, prior 2 months revised higher, solid bounce-back from Hurricanes and Boeing strike. 3-month average payrolls +173,000!
By Wolf Richter for WOLF STREET.
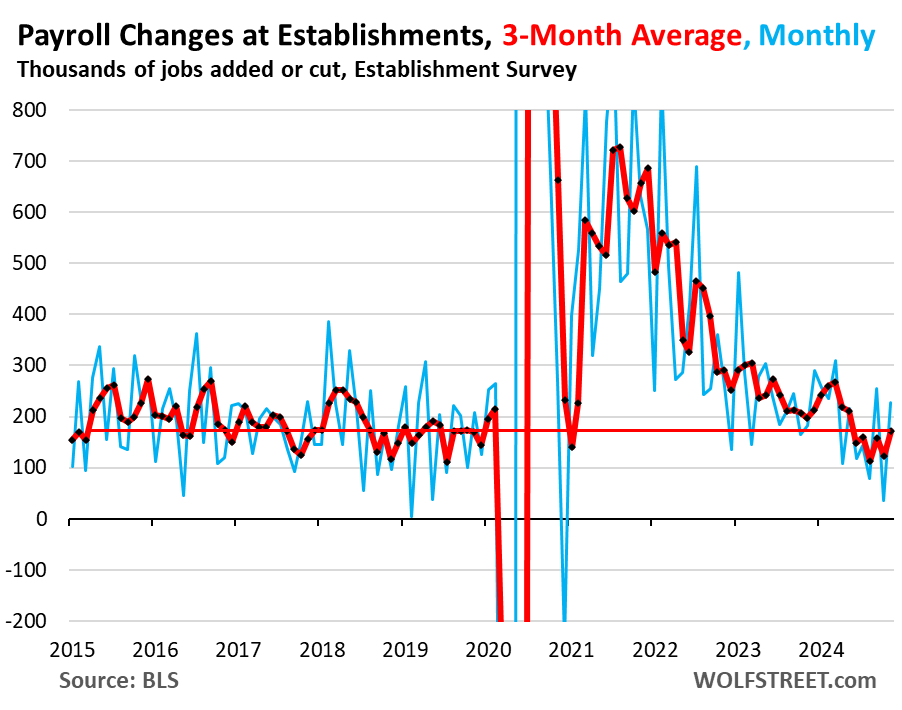
Payrolls jumped by 227,000 in November from October, and the prior two months were revised higher by a combined 56,000 jobs, which makes for an increase in payrolls of 283,000 for the month, according to the Bureau of Labor Statistics today.
The three-month average, which includes the revisions and effects of hurricanes and the Boeing strike, rose by 173,000 in November, a very solid increase.
Today’s figures reflect a big bounce-back from the October figures, which had gotten hammered down by the Boeing strike and the effects of the hurricanes in September and October that temporarily shut many work sites. By mid-November, the end of the reference period for today’s data, many of these sites were back in operation.
The Boeing strike ended on November 5, and many of these workers went back to work by the end of the survey reference period – the payroll that includes the 12th of November. So employment in Transportation Equipment Manufacturing jumped by 30,000 in November, after the strike-caused drop of 44,000 in October. Most of the remaining 14,000 workers that missed the mid-November cutoff will show up on the December payrolls data.
The Boeing strike had caused the unemployment rate in Transportation Equipment Manufacturing to spike from 2.2% in September to 5.3% in October. In November, it dropped back to 3.7%. As the remaining workers went back to work after mid-November, the rate will likely drop further in December.
Overall payrolls at employers rose by 227,000 jobs in November from October, and October was revised higher by 24,000 jobs and September by 32,000 jobs, for a total increase of 283,000 jobs, according the survey of establishments (blue line).
The three-month average job creation — which irons out the downs and ups from the hurricanes and the Boeing strike, other month-to-month squiggles, and the revisions — increased by 173,000 jobs in November, a healthy number of job gains, right in the middle of the Good Times before the pandemic (red line).
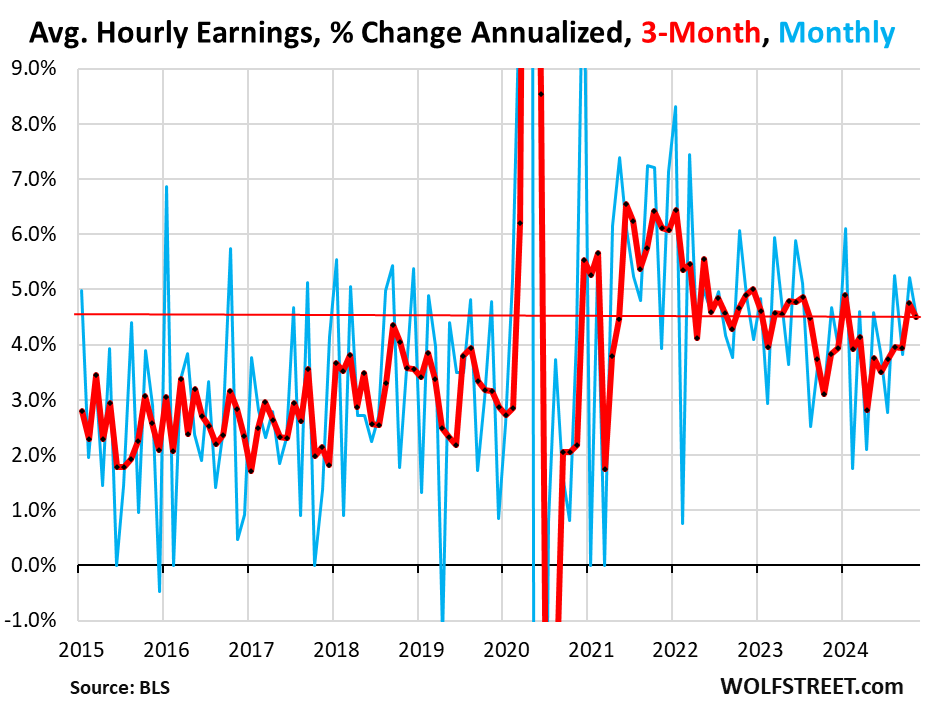
Average hourly earnings jumped by 4.5% annualized in November from October, and October’s gain was revised higher to +5.2% annualized (from the previously reported +4.5%), both the biggest wage gains since January (blue line).
The three-month average rose by 4.5% annualized. Due to the upward revisions for October, the October three-month average jumped to +4.8%, from +4.5% reported a month ago. It’s from this upwardly revised 4.8% gain of the three-month average in October, that the 4.5% gain in November decelerated. Both of them were the biggest increases since January (red line).
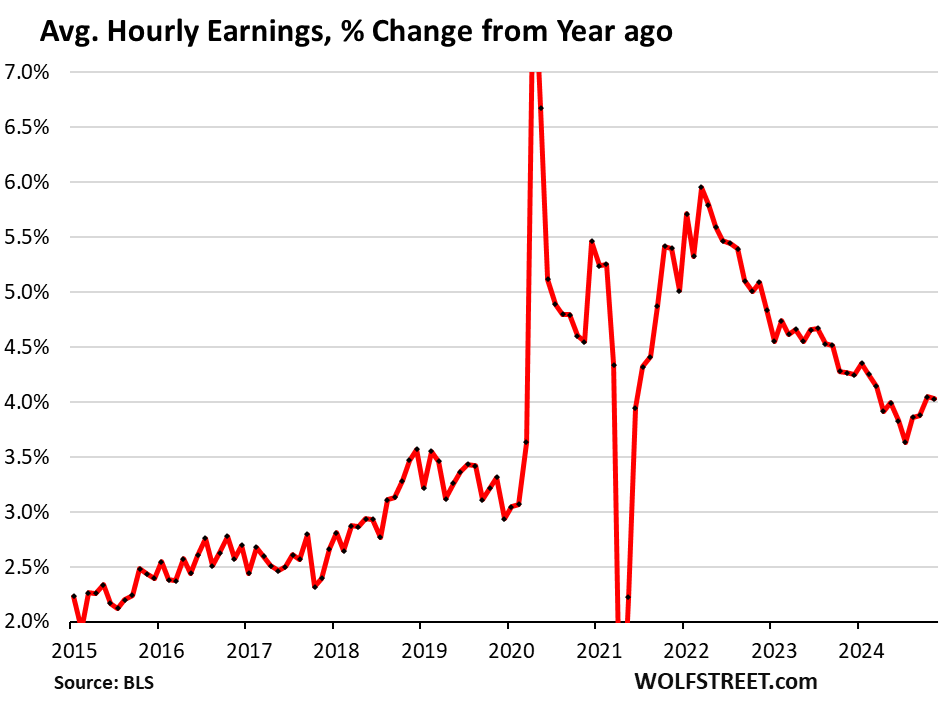
Year-over-year, average hourly earnings rose by 4.0% in November, same increase as in October, and both are the biggest year-over-year increases since March, and well above even the peaks of the 2017-2019 Good Times period.
These wage gains are adding to the reborn inflation worries.
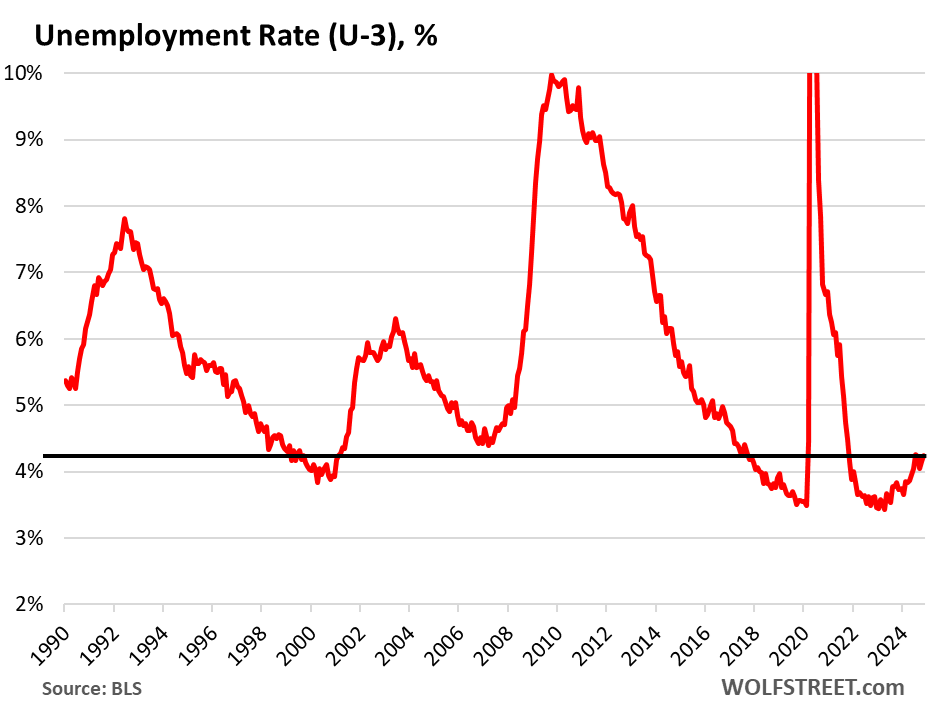
The headline unemployment rate (U-3), based on the survey of households, edged up to 4.2% in November from 4.1% in October.
Over the past seven months, the unemployment rate has stabilized at the historically low range of 4.0% to 4.3%, with July having been the high point.
The unemployment rate = number of unemployed people who are actively looking for a job divided by the labor force (number of working people plus the number of people who are actively looking for work).
The Fed, at the time of its rate-cut decision in September, projected an increase in the unemployment rate to 4.4% by the end of 2024 and 2025, according to the Fed’s most recent Summary of Economic Projections released at the September meeting (it’s going to release an updated SEP at the December meeting). This projection of a continued increase in the unemployment rate was one of the reasons for the rate cuts. But the unemployment rate has stabilized below the Fed’s median projection so far.
The wave of migrants and the coming revision of the Household Survey data.
The recent tsunami of migrants – causing a net population increase estimated by the Congressional Budget Office of 6 million in 2022 and 2023, plus some in 2024 – is hard to track for the household employment data because proportionately fewer of them respond to the household surveys.
In addition, the BLS uses the Census Bureau’s population data to extrapolate the survey data to the overall population. But the Census Bureau’s data that the BLS uses hasn’t been updated to reflect the wave of migrants, which is why the CBO came up with its own estimates, based on ICE data in addition to Census Bureau data.
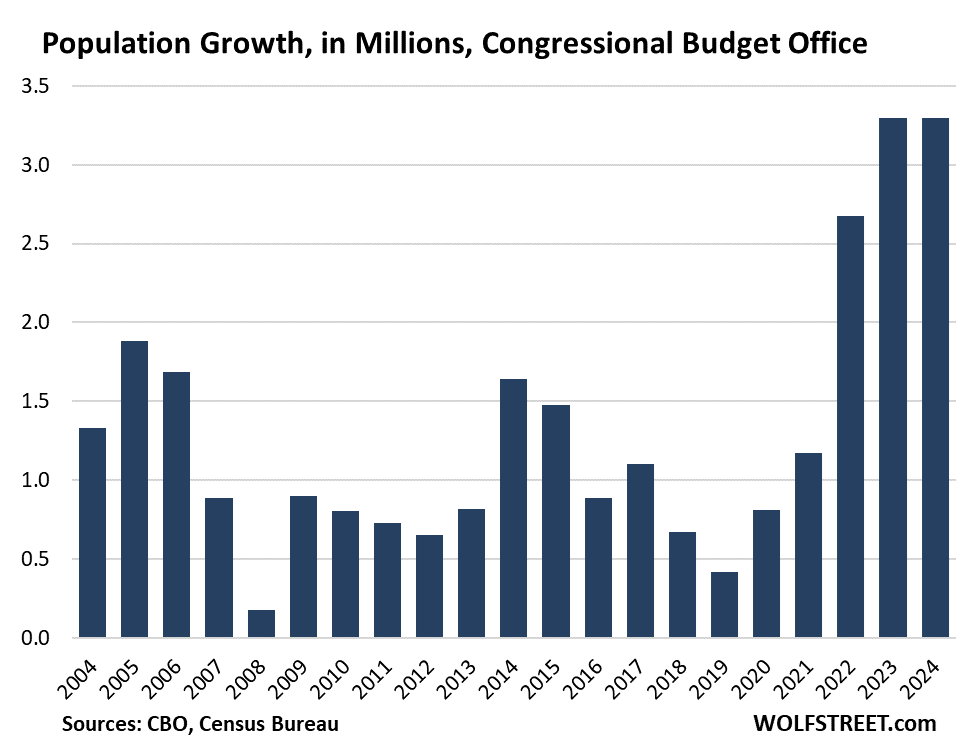
The BLS will revise the household survey data in January, hopefully based on updated population data that would include more of the migrants. And if that is the case, we expect large up-revisions of overall employment, the labor force, and related metrics. The household data has been in the fog for two years.
The up-revision of total employment in January should re-establish the historic relationship to nonfarm payroll jobs.
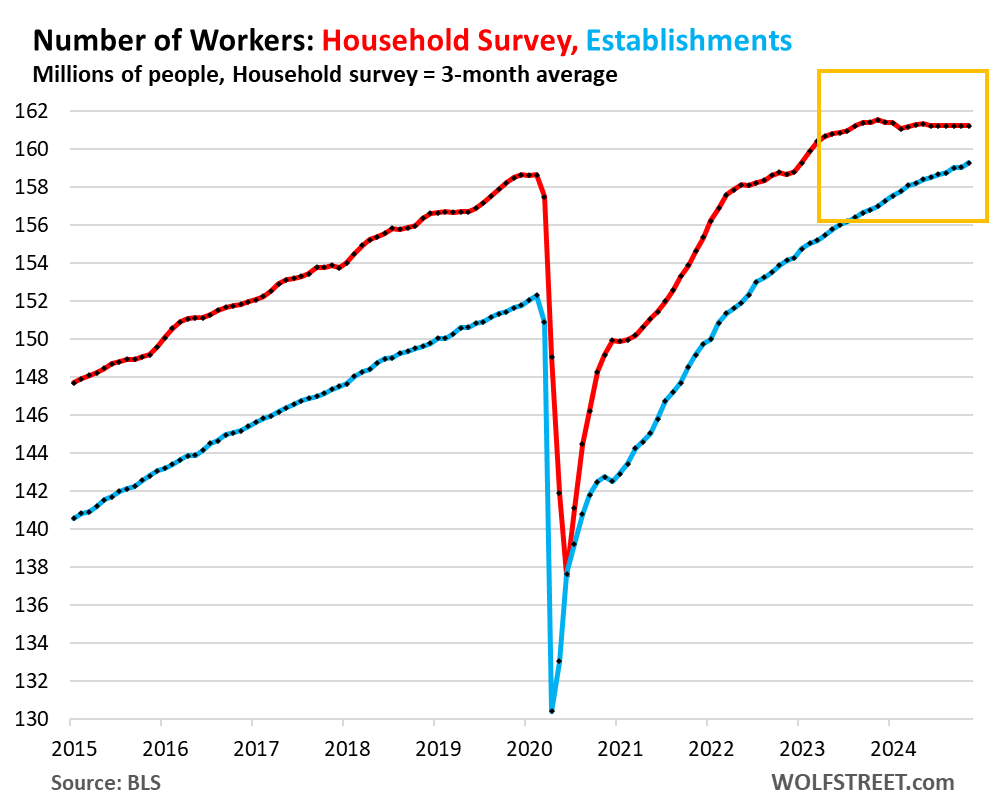
By not adequately accounting for the migrants, the household employment data started to massively diverge from the nonfarm payroll data in mid-2023.
Total employment, lacking the new migrants who are working, has been relatively flat since mid-2023 (red), while the nonfarm payrolls have continued to rise at a solid pace (blue).
We expect the up-revision in January to raise the red line and re-establish the typical difference to the blue line. That difference is mostly caused by certain self-employed workers and farm workers that are not included in the nonfarm payroll data:
The newly arrived immigrants who either already have a job or are looking for a job would count in the labor force, regardless of legal status. If they’re working, they would count as workers, regardless of legal status. Those that have not found a job yet, but are looking for a job, would show up in the unemployment rate regardless of legal status.
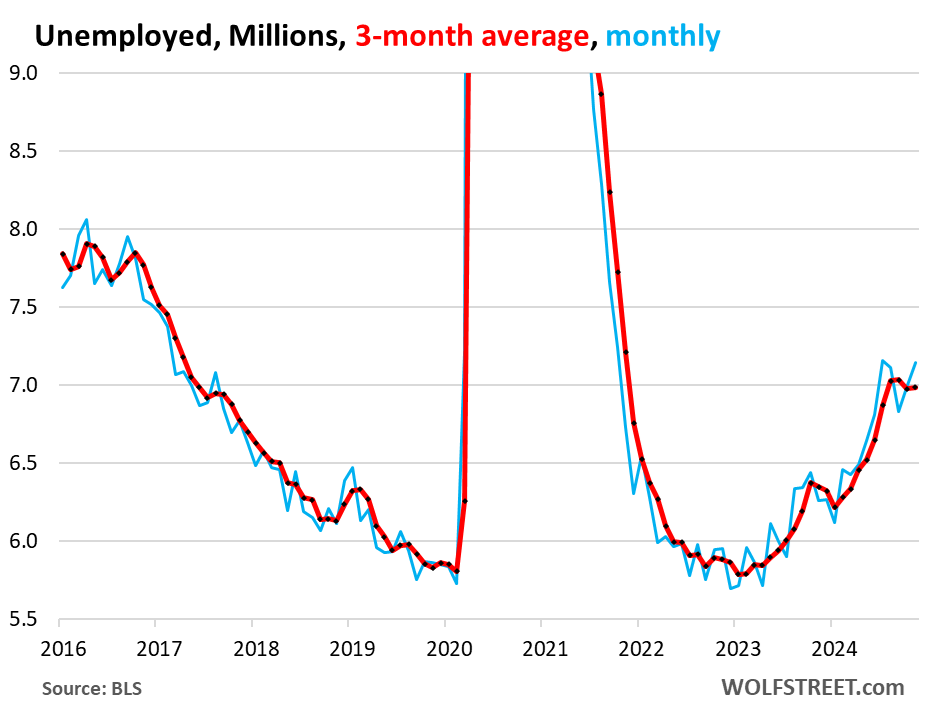
The unemployment rate rose earlier in 2024 due to this new supply of labor, not due to job losses – jobs have continued to grow at a solid rate. In a typical recession, the unemployment rate rises due to reduced demand for labor (job cuts and declines in employment).
The number of unemployed people looking for a job rose to 7.1 million. It has been in this 7-million range since June, with the high point in July (blue).
The three-month average remained at 7.0 million, same is in October, and down a hair from July and August.
This metric of the number of unemployed people does not take into account the growth of the labor force over the decades. But the unemployment rate (above) accounts for the growth of the labor force.
“Careful” with those rate cuts!
Today’s employment data is another reason why the Fed can be “careful” with its rate cuts. “Careful” is the new key word that Powell and Fed governors have used to describe their approach to future rate cuts: Slowing the pace of the rate cuts amid enormous uncertainty where that theoretical neutral rate is that the Fed aspires to meet with its rate cuts.
With current policy rates, the Fed may already be at the neutral rate – its policy rates may no longer be “restrictive” on the overall economy, but may be “neutral,” and we’ve been seeing evidence of that in above-average GDP growth, the solid labor market, stubborn and now re-accelerating inflation, and other economic data.
And if data like this keeps piling up, the Fed could and should do some wait-and-see, which it had already done for a big part of 2024.
But rate cuts are not permanent. If the Fed overdoes the cuts, and inflation re-ignites more seriously, it can always hike again. The Fed used to do that in the olden days, no problem.
Enjoy reading WOLF STREET and want to support it? You can donate. I appreciate it immensely. Click on the beer and iced-tea mug to find out how:
Would you like to be notified via email when WOLF STREET publishes a new article? Sign up here.
![]()
Energy News Beat

