
As homebuilders got aggressive with mortgage-rate buydowns, incentives, and lower prices, sales held up, unlike sales of existing homes, which collapsed.
By Wolf Richter for WOLF STREET.
With inventories of new single-family homes for sale very high – more on those in a moment – the big homebuilders have been aggressive in their efforts to sell the homes they’ve completed, and those they’re building and planning to build, because they’re in the business of building houses, and they have to try to keep their stocks from collapsing, and they cannot just stop building just because inventories are high or because the housing market is tough.
So they’re lowering prices, they’re building at lower price points, they’re throwing lots of incentives at potential customers, and most importantly, they’re buying down mortgage rates, which is costly for builders but less costly than just cutting the contract price far enough to get the payment down to the same level.
Lennar, for example, disclosed in its 10-Q filing that the total cost of incentives, including mortgage rate buydowns, rose to $60,000 per house sold on average in Q1, up from $50,600 a year ago, to 12.9% of its average sales price. And those incentives are in addition to any actual price cuts.
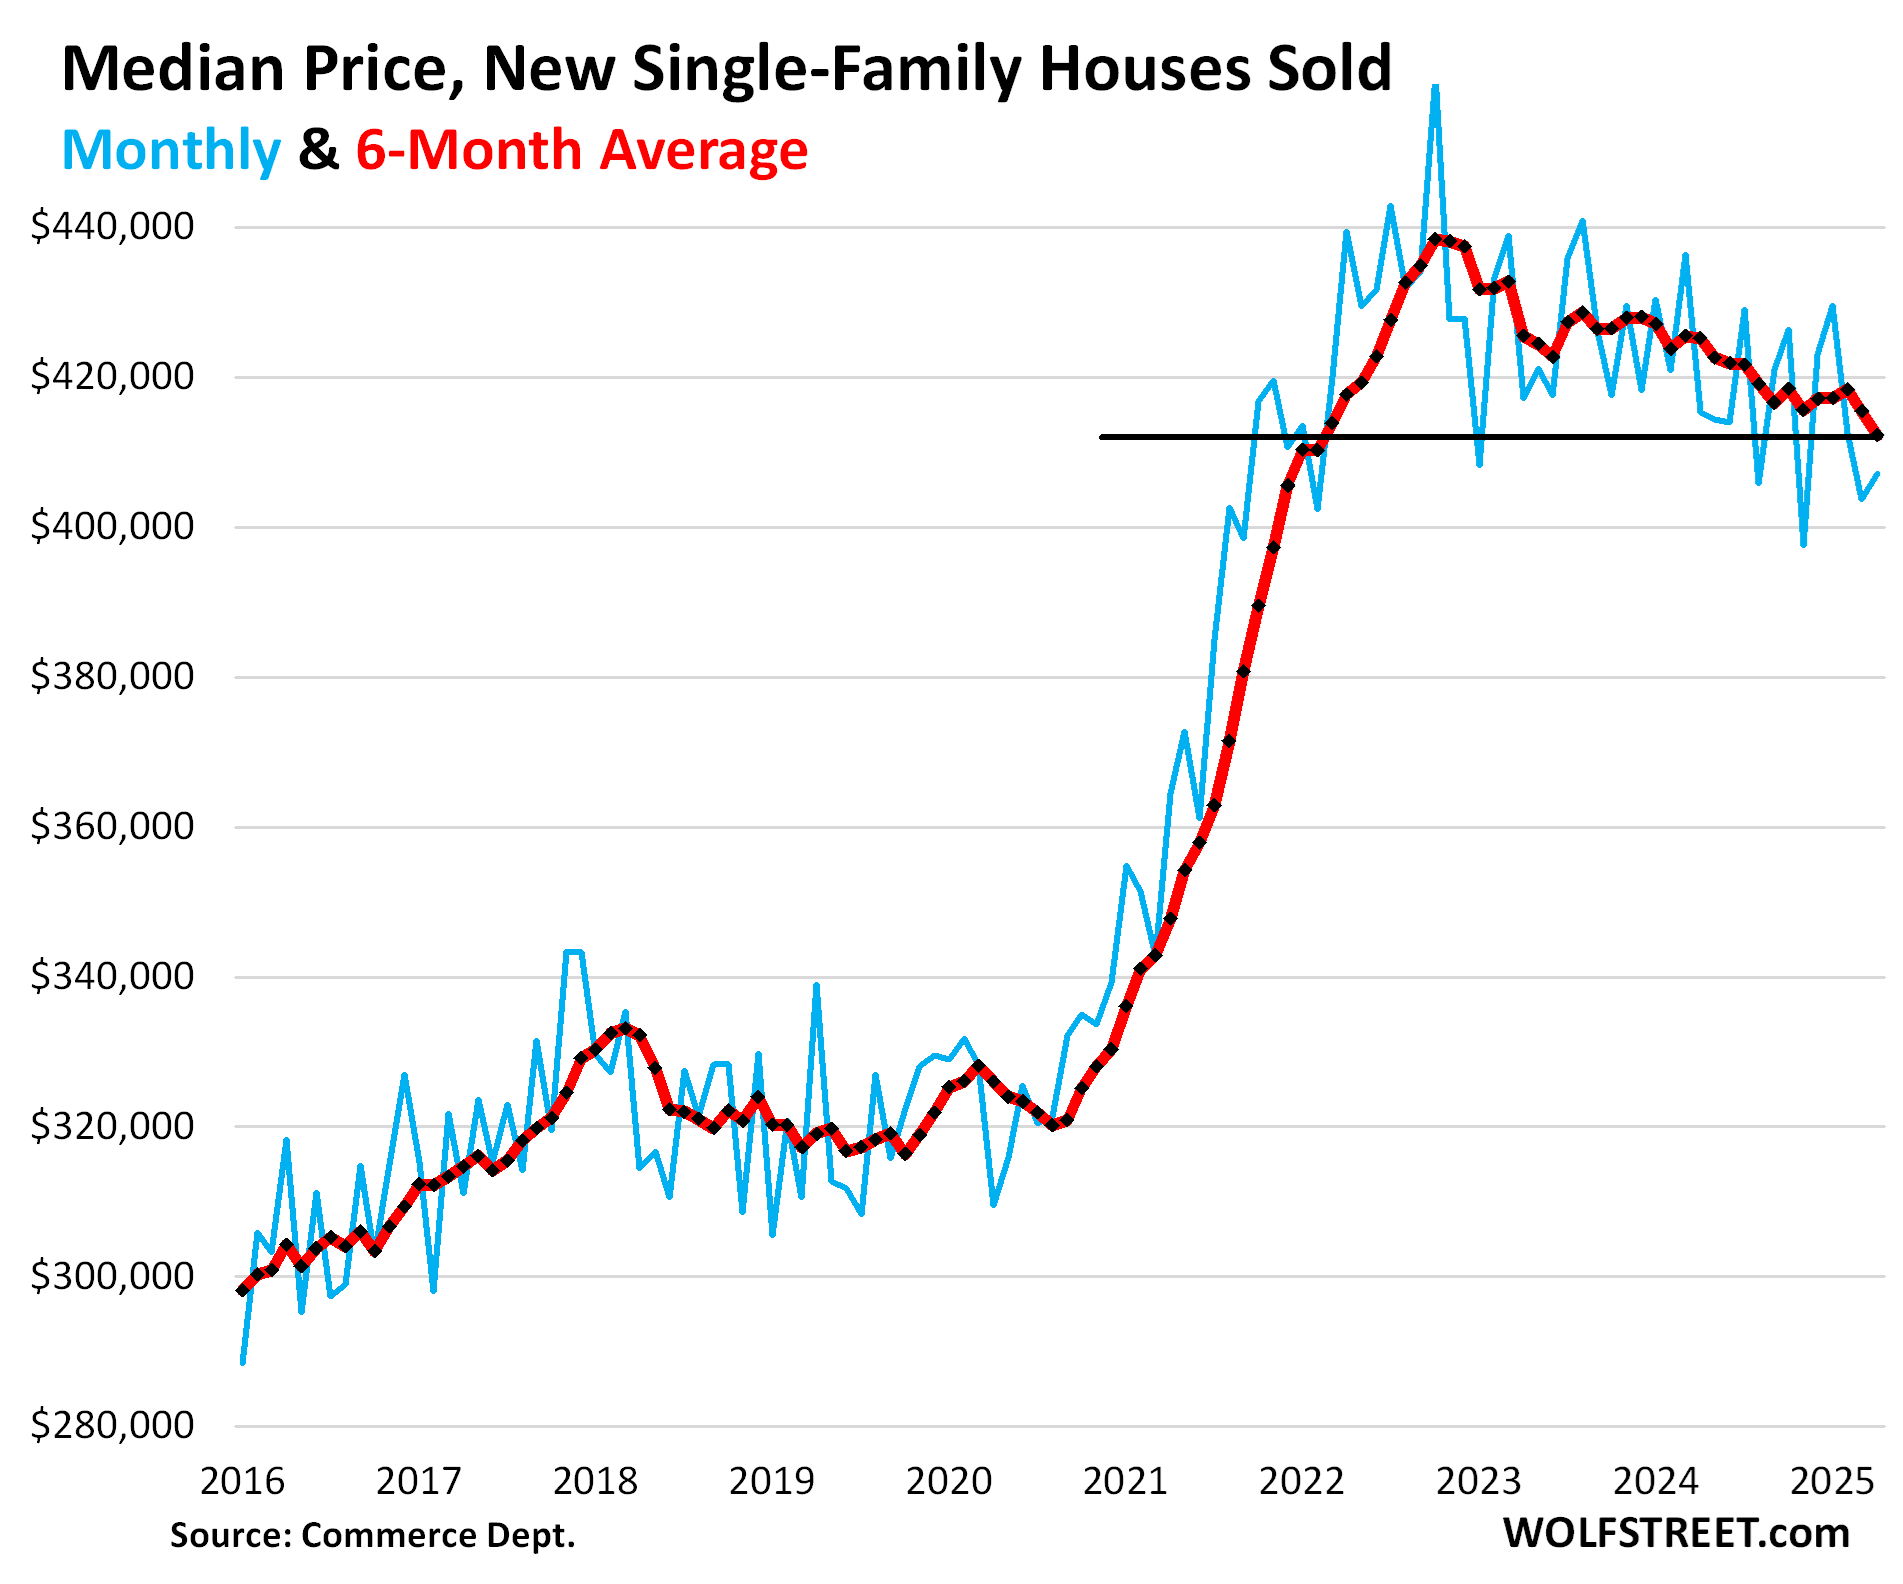
The sales prices in the contracts between the homebuilder and homebuyer do not include the costs of the mortgage rate buy-down and some other incentives, such as free upgrades. It is these contract prices that are tracked by the Census Bureau, and even though they don’t include the costs of mortgage-rate buydowns and some other incentives, they have been zig-zagging lower since late 2022.
In April, the median contract price, at $407,200, was down by 2.0% year-over-year and by 11.5% from the October 2022 peak, according to the Census Bureau today.
The six-month average, which irons out the month-to-month squiggles, declined to $412,300, the lowest since February 2022:
Inventories for sale are sky-high, especially in the South and West.
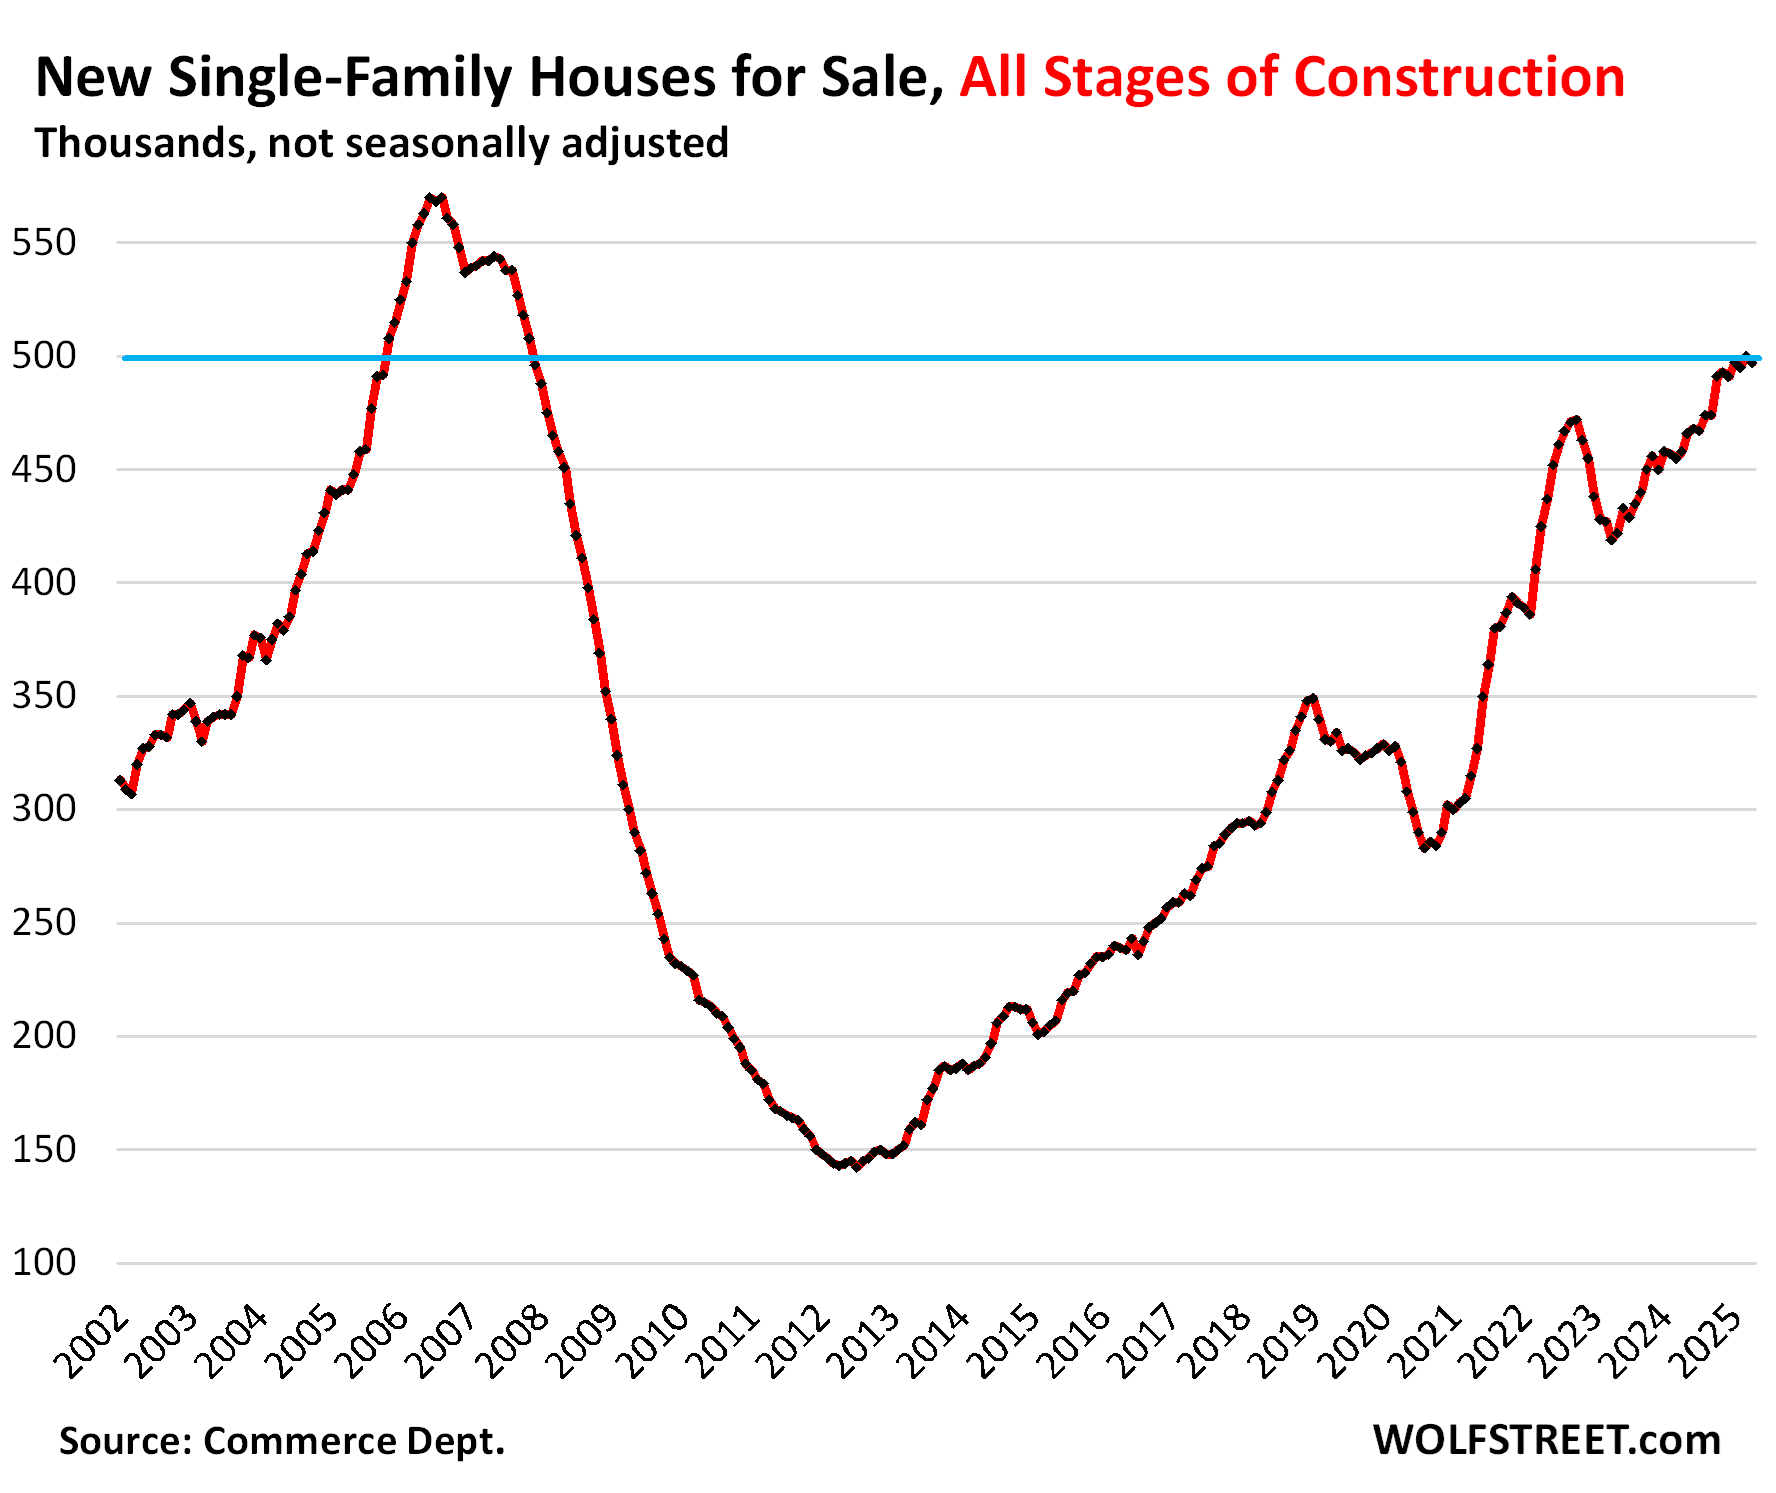
Single-family houses for sale at all stages of construction was revised up for March to 500,000 today, from the originally reported 493,000. In April, inventory was 497,000 houses, according to the Census Bureau today.
Inventories over the past four months, after revisions, have been right at 500,000, the highest since November 2007, when they were on the way down as the industry was near collapse during the Housing Bust, and up by 51% from March and April 2019.
Thanks to fairly brisk sales that homebuilders obtain with lower prices, mortgage-rate buydowns, and incentives, this inventory has translated into 8-9 months’ supply over the past six months – rather than double-digit supply.
A glut of new houses for sale is exactly what this overpriced housing market needs the most. And lower prices bring out more buyers. And we’re seeing that.
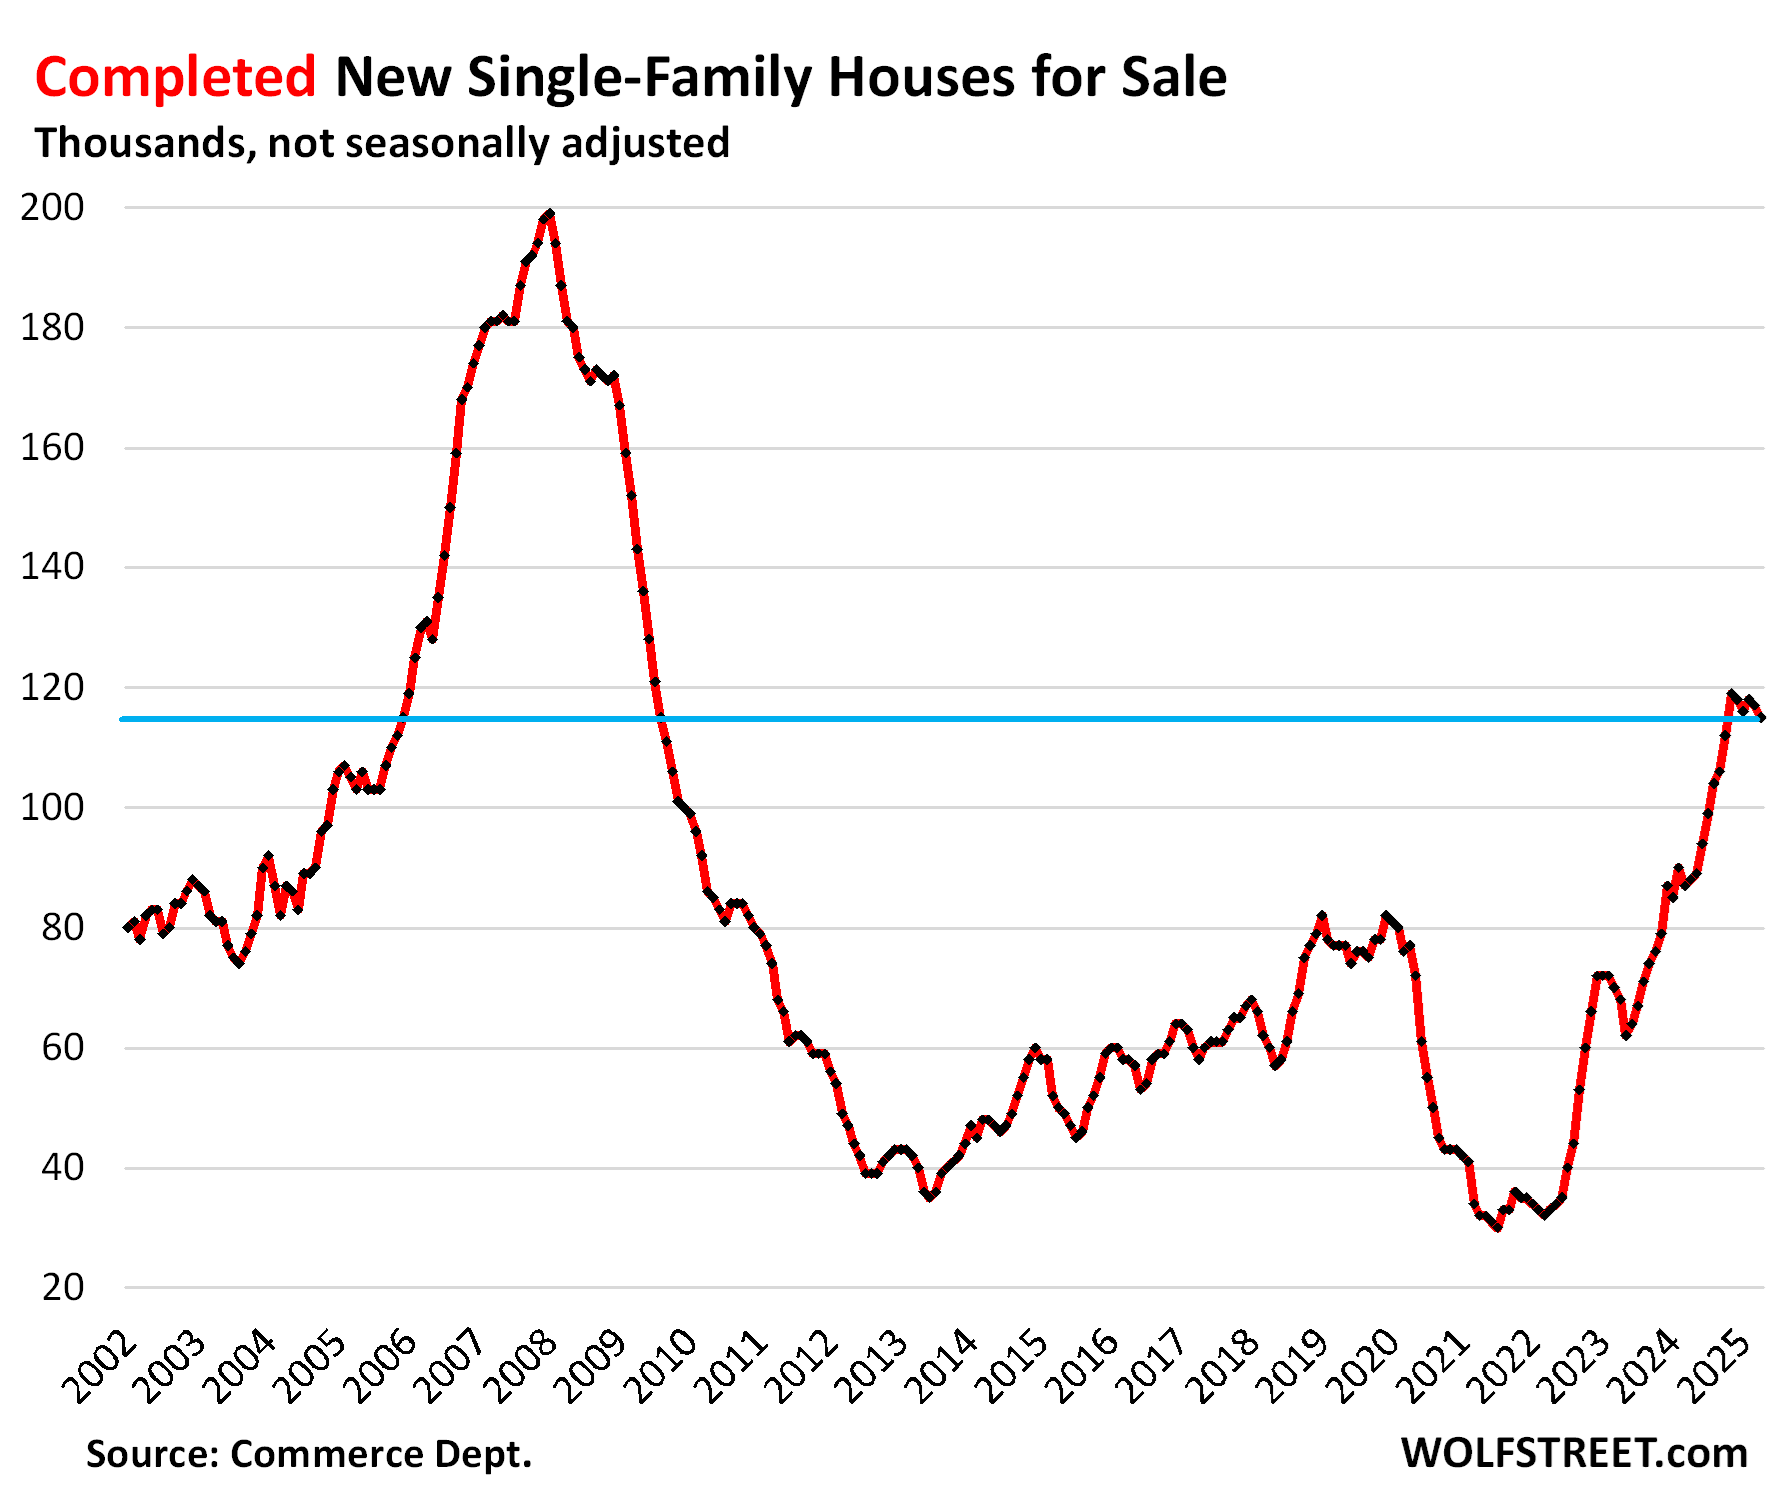
Inventories of completed single-family houses for sale in April, at 115,000, were up by 31% year-over-year, by 49% from April 2019, and about where they’d been on the eve of the Housing Bust in January 2006.
Homebuilders are very motivated to sell these spec houses quickly because they tie up a lot of capital.
Inventory for sale by region.
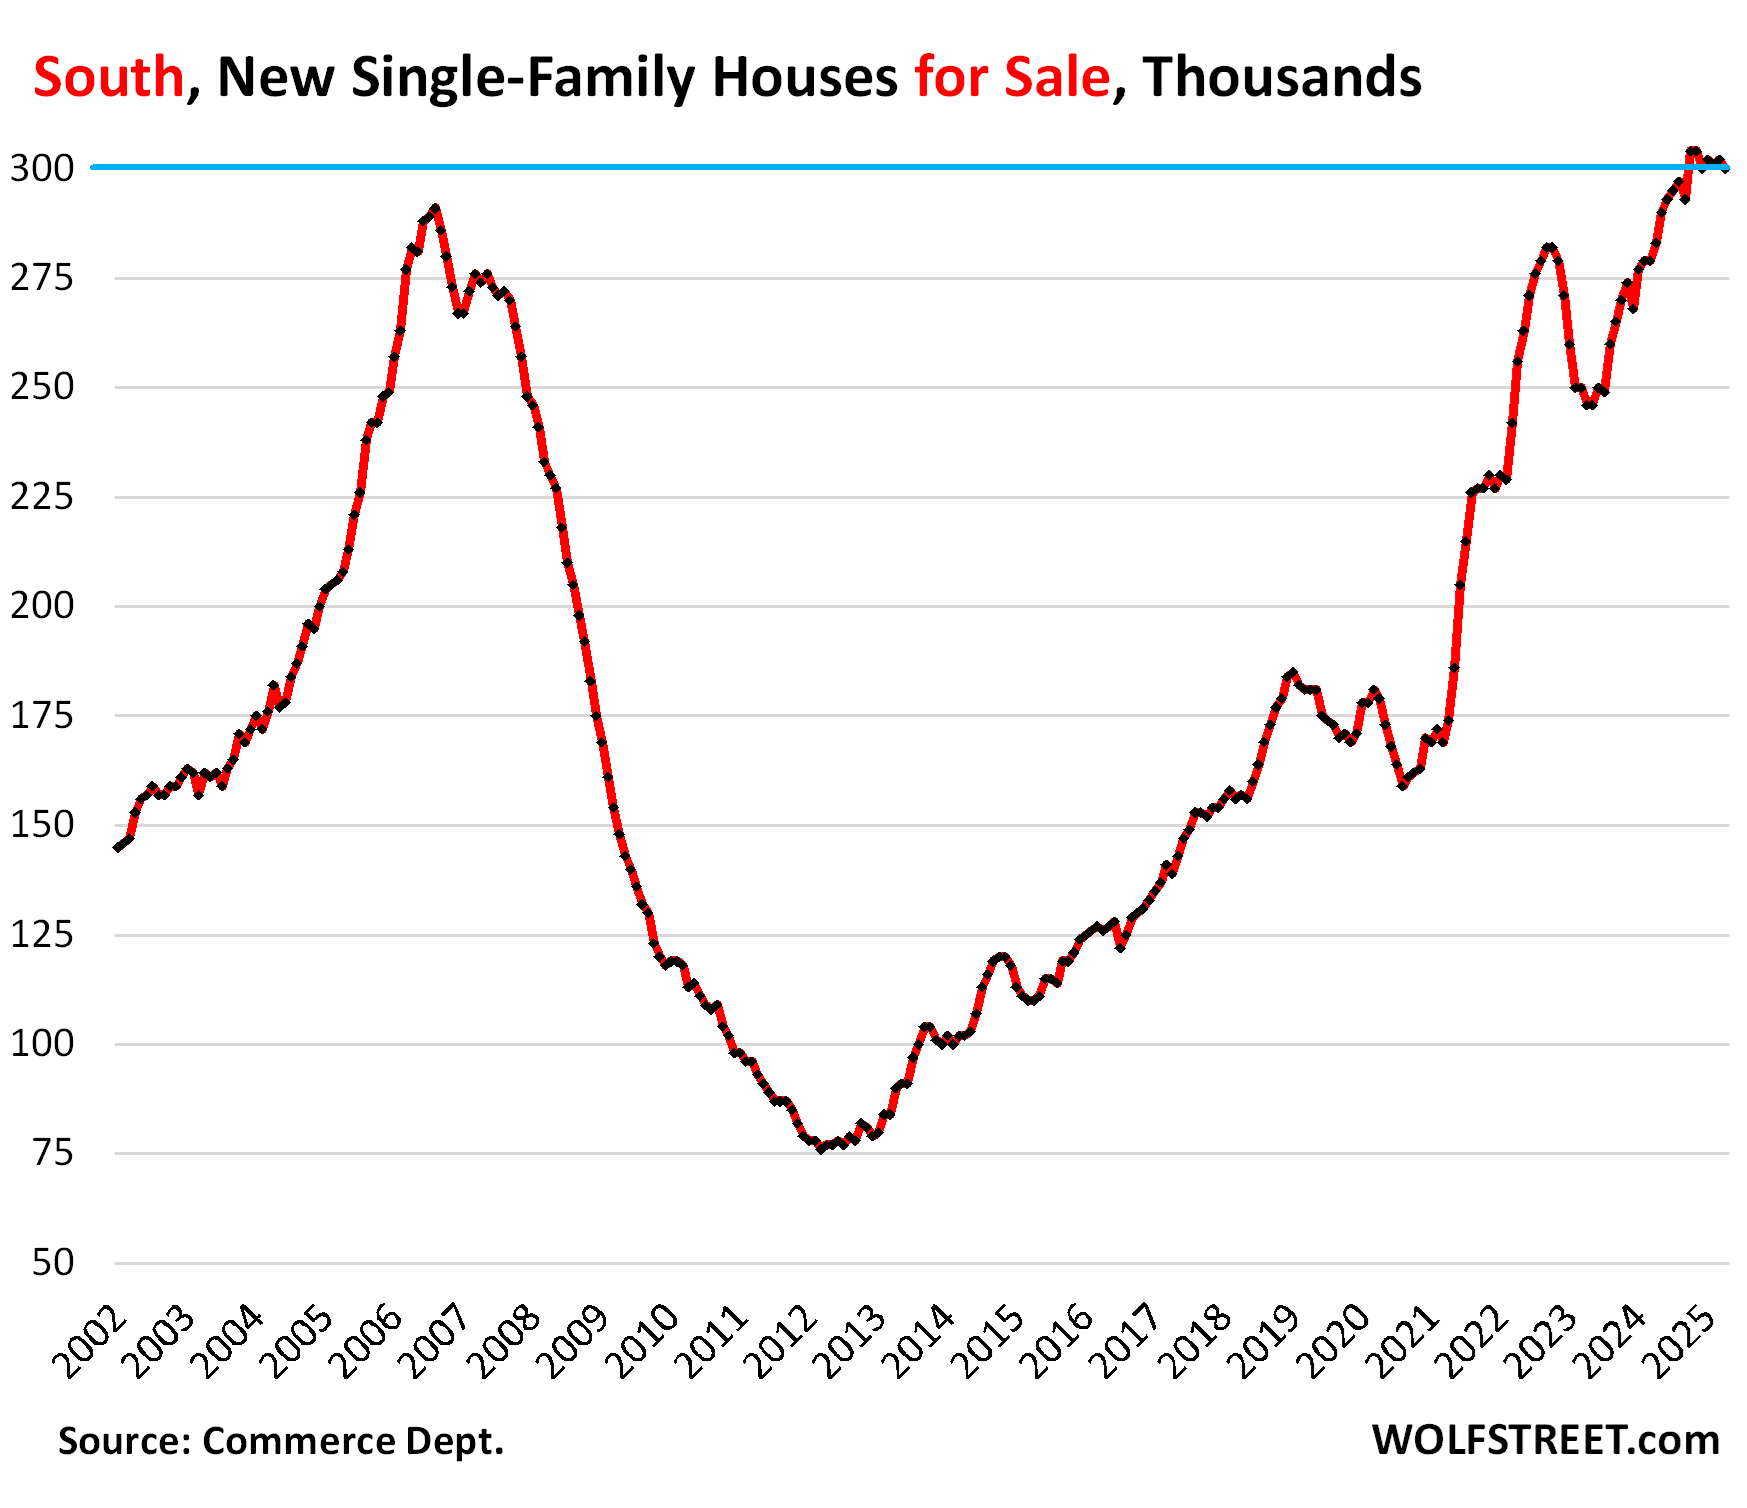
In the South, inventories of new houses for sale at all stages of construction in March was revised up to 302,000 (from the originally reported 295,000). And in April, reported today, the were 300,000 new single-family homes for sale, up by 6% from a year ago, and up by 66% from April 2019!
Inventory for sale has been above the Housing Bust peak since May 2024.
The South, dominated by Texas and Florida, is by far the largest market for new houses in the US, accounting for 60% of US inventory, and for 63% of US sales (a map of the four Census regions is in the comments below the article).
Sales rose by 5% year-over-year and by 5% from April 2019, pushed forward by mortgage-rate buydowns and incentives. At least, they didn’t plunge by 25%, as sales of existing homes have done in the US. This translates into 7 months’ supply.
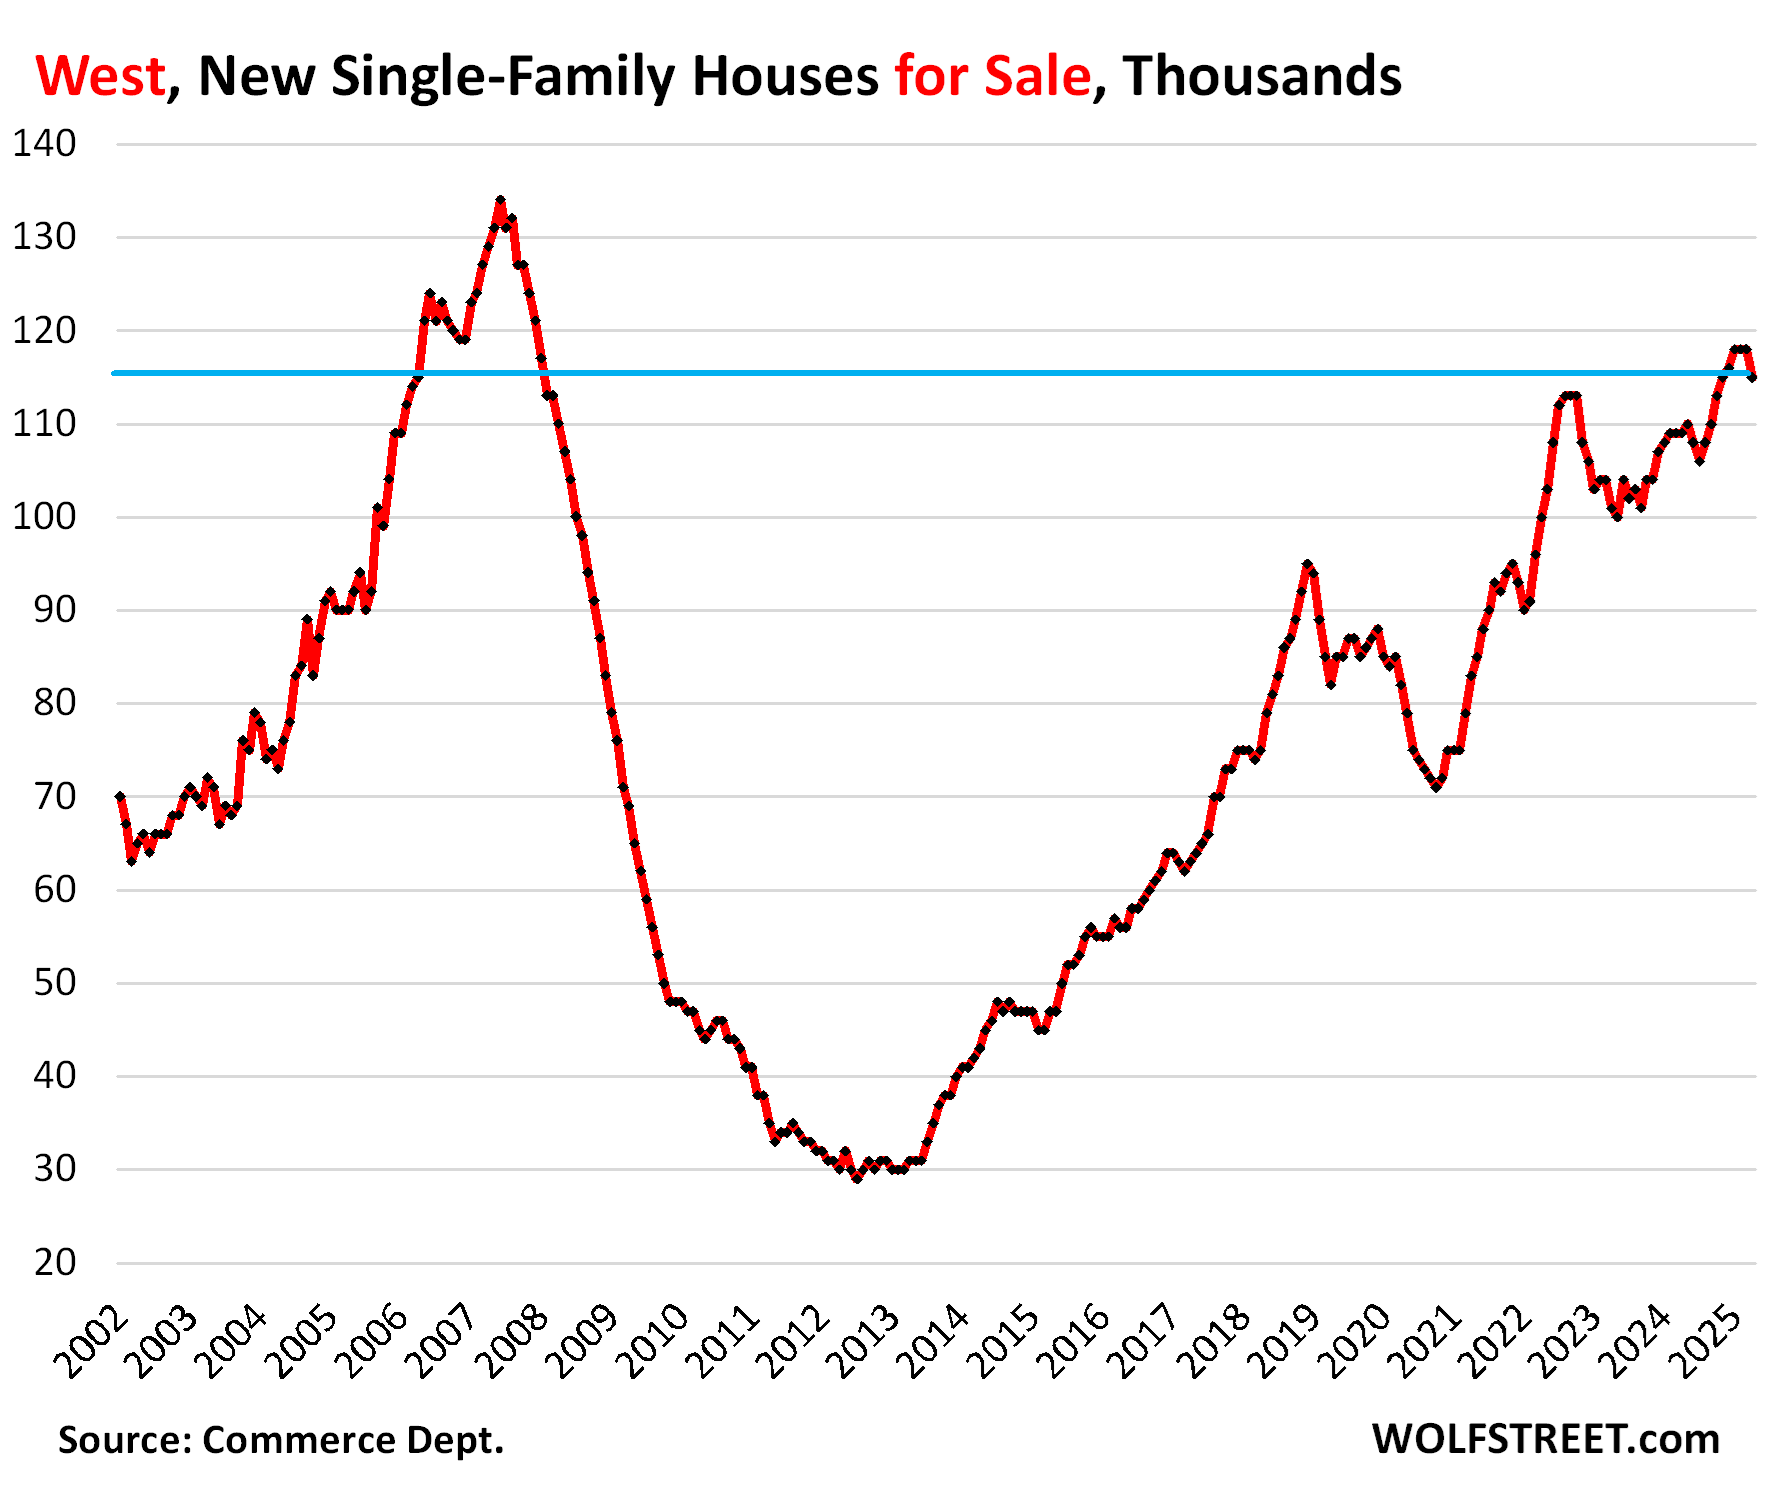
In the West, inventories of new houses, at 115,000, were up by 6% year-over-year, by 40% from April 2019, and where they’d been in March 2006. This represented about 8.2 months’ supply.
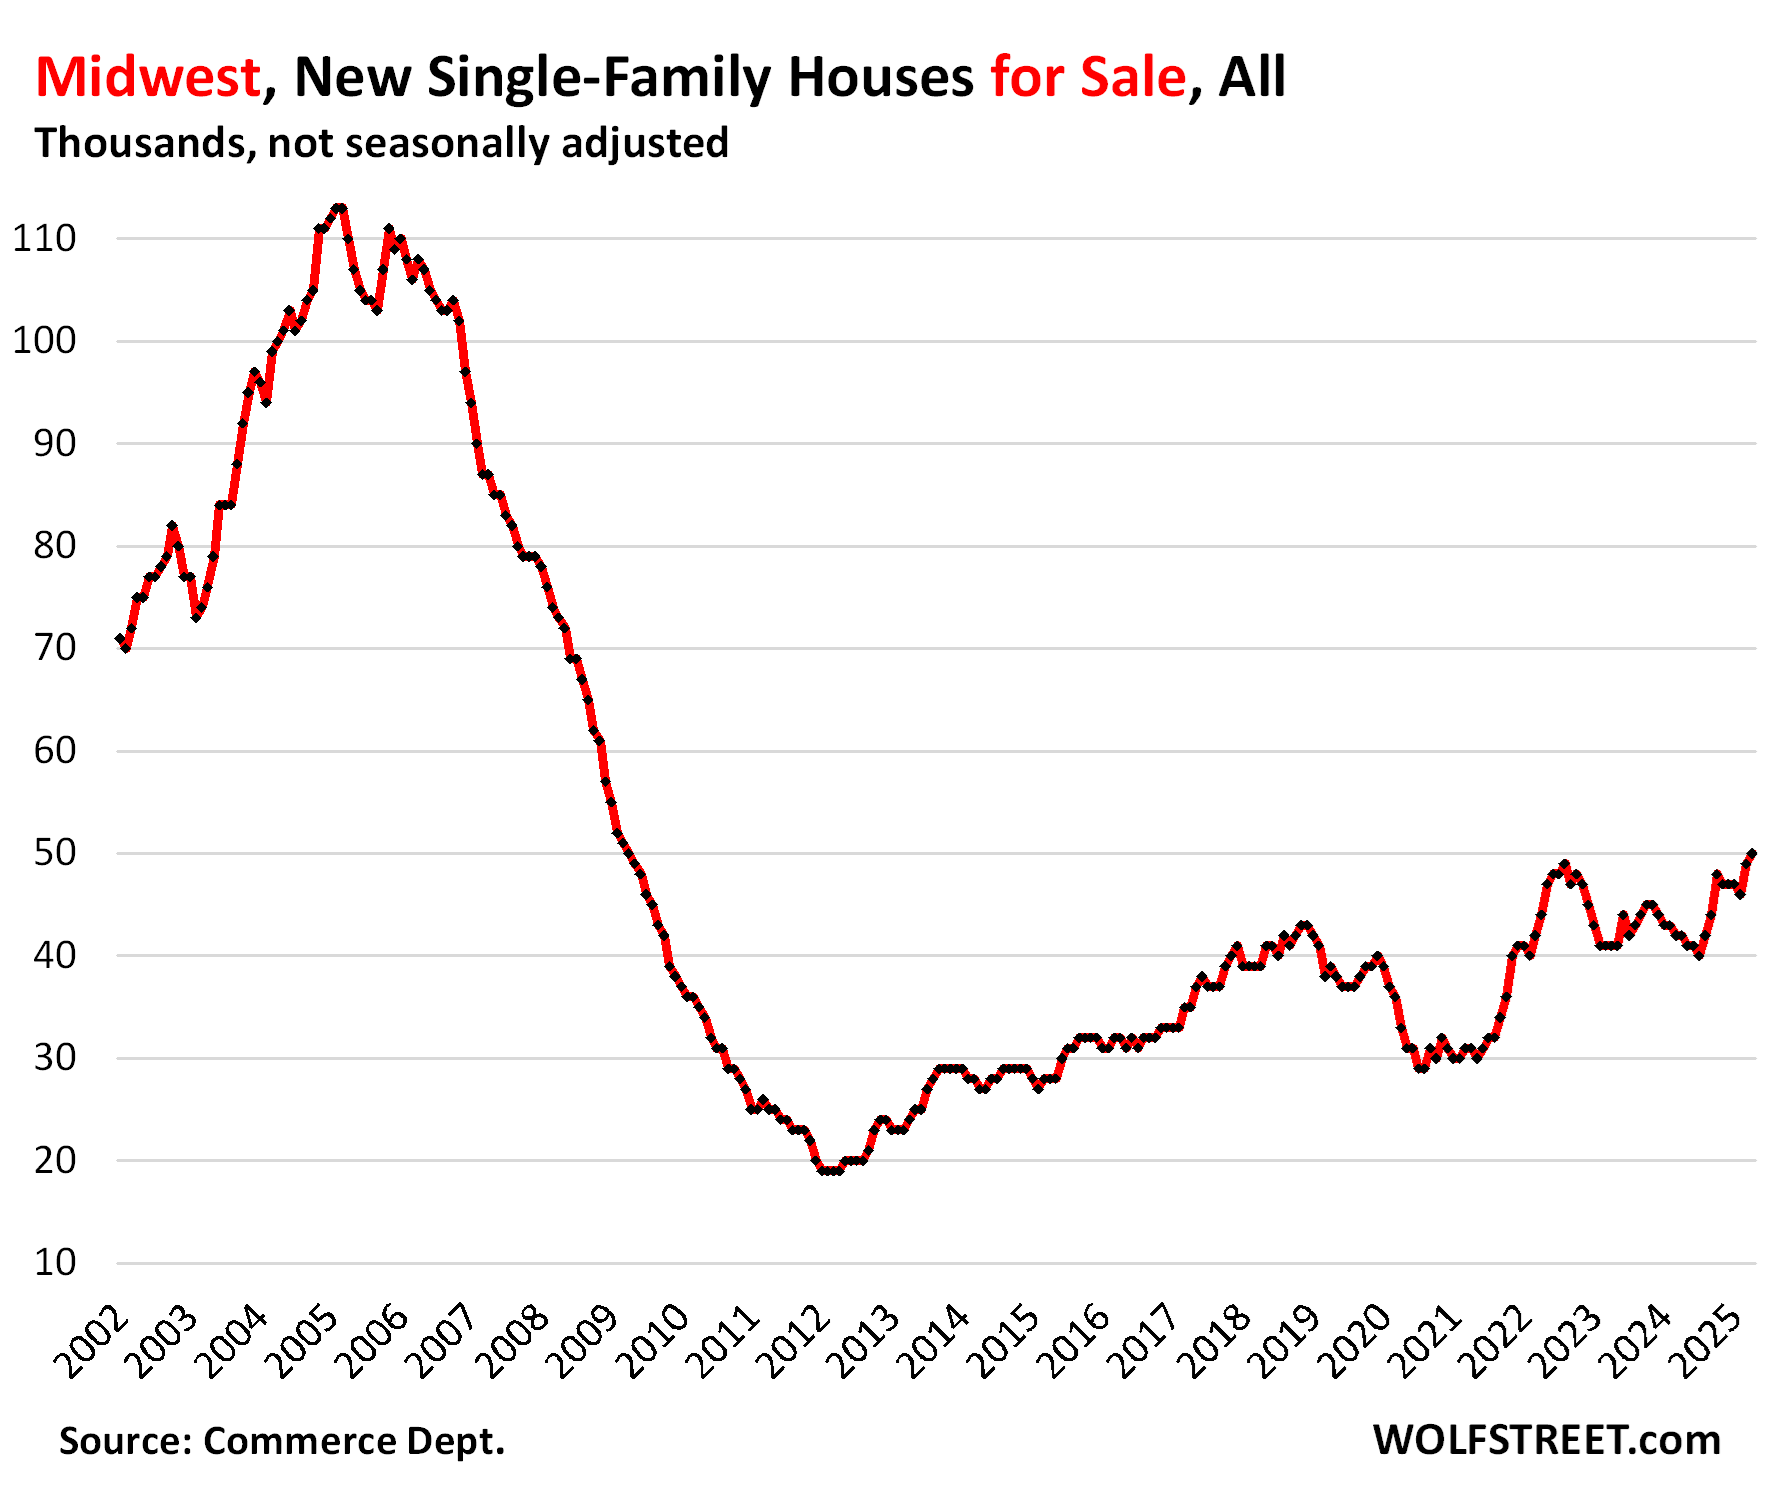
In the Midwest, inventory at 50,000 new houses for sale, was the highest since April 2009, up by 19% year-over-year and up by 28% from April 2019.
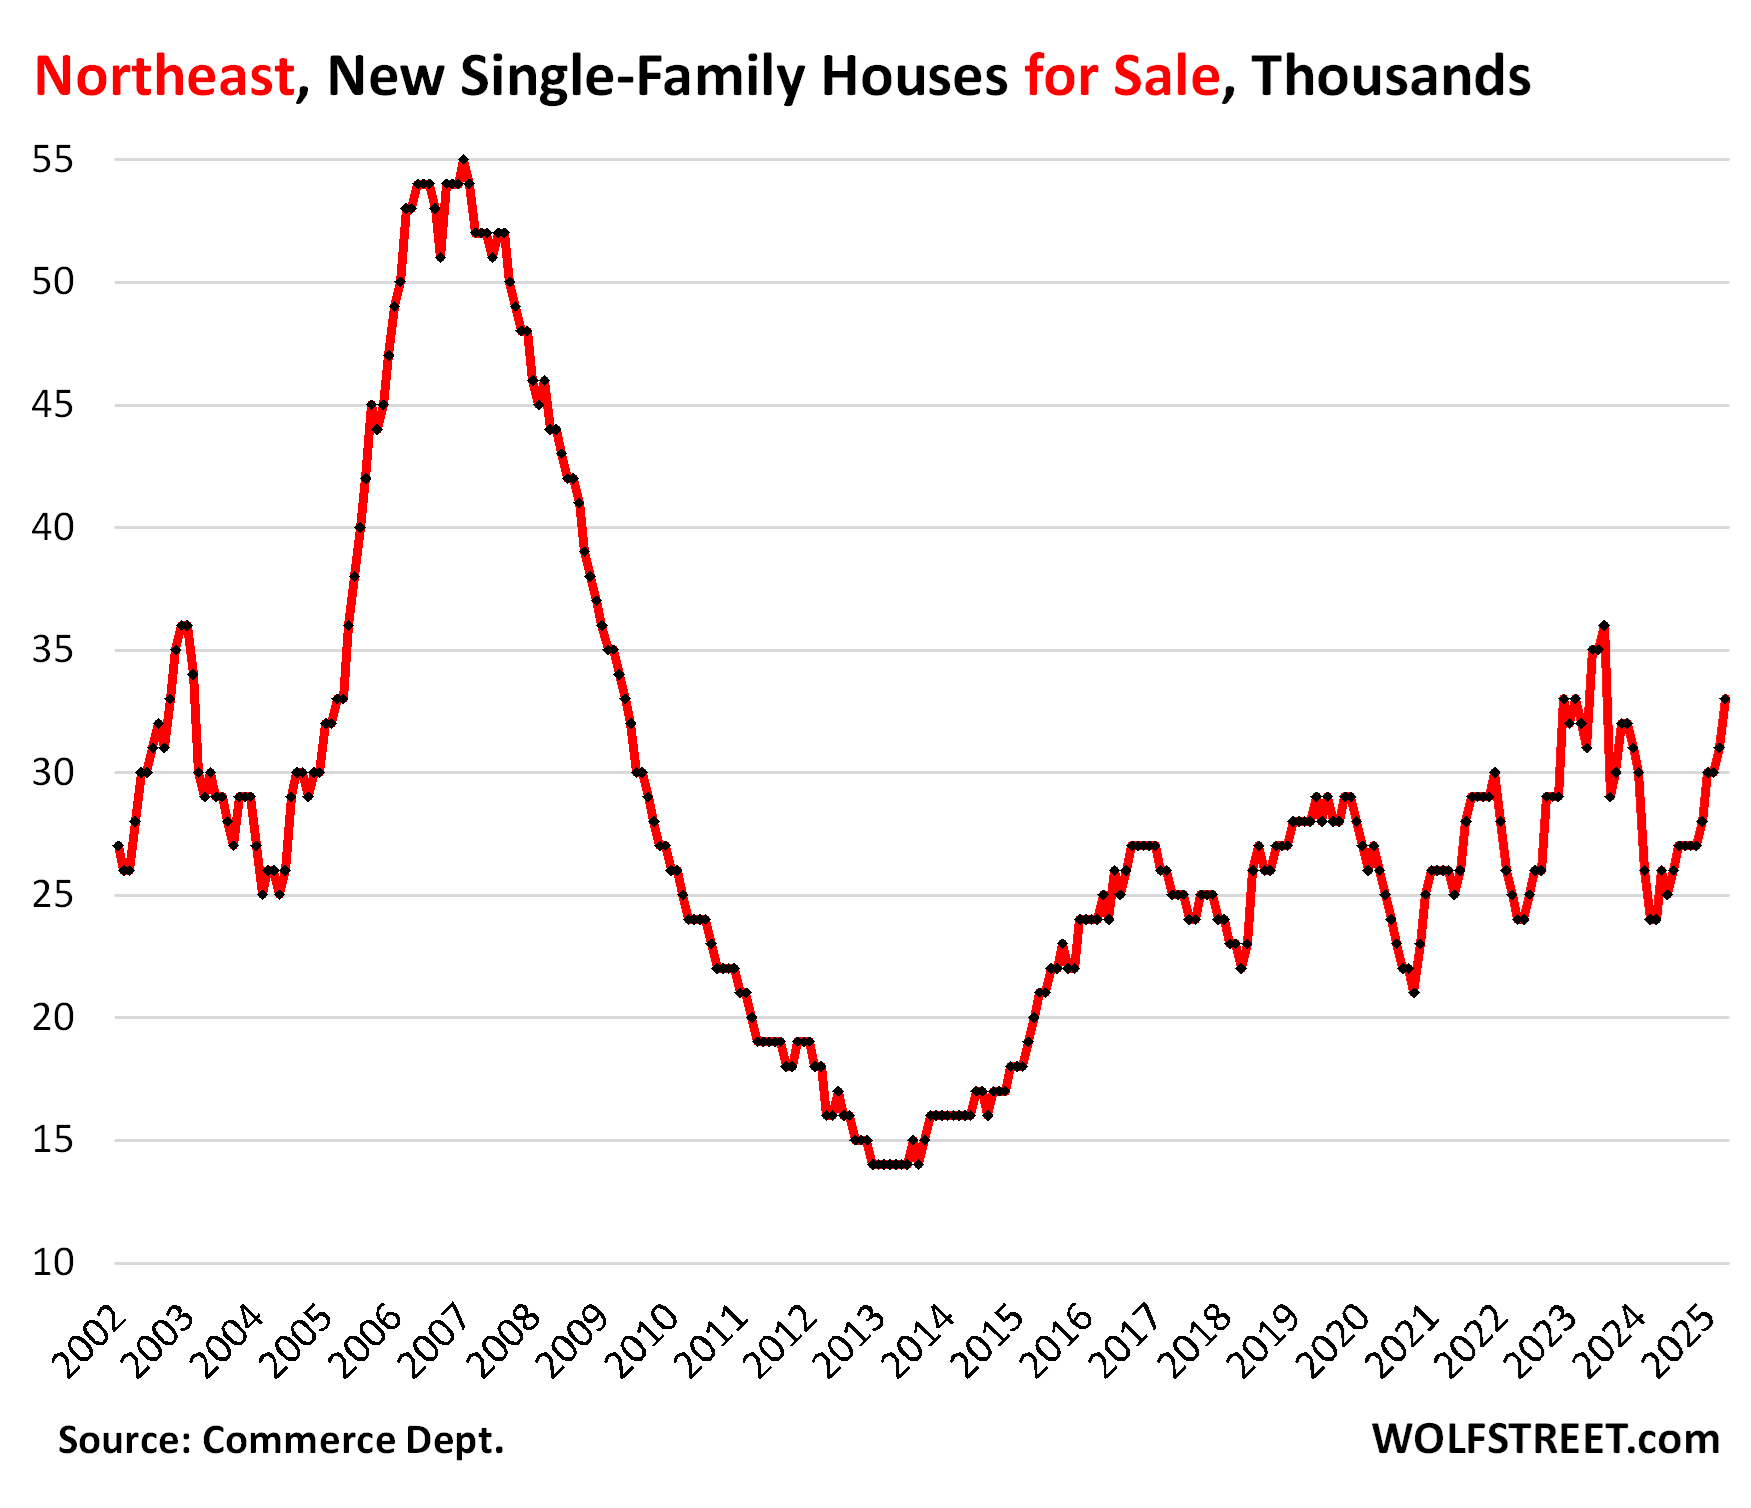
In the Northeast, inventory for sale, at 33,000 homes, was up by 37% year-over-year and by 18% from April 2019.
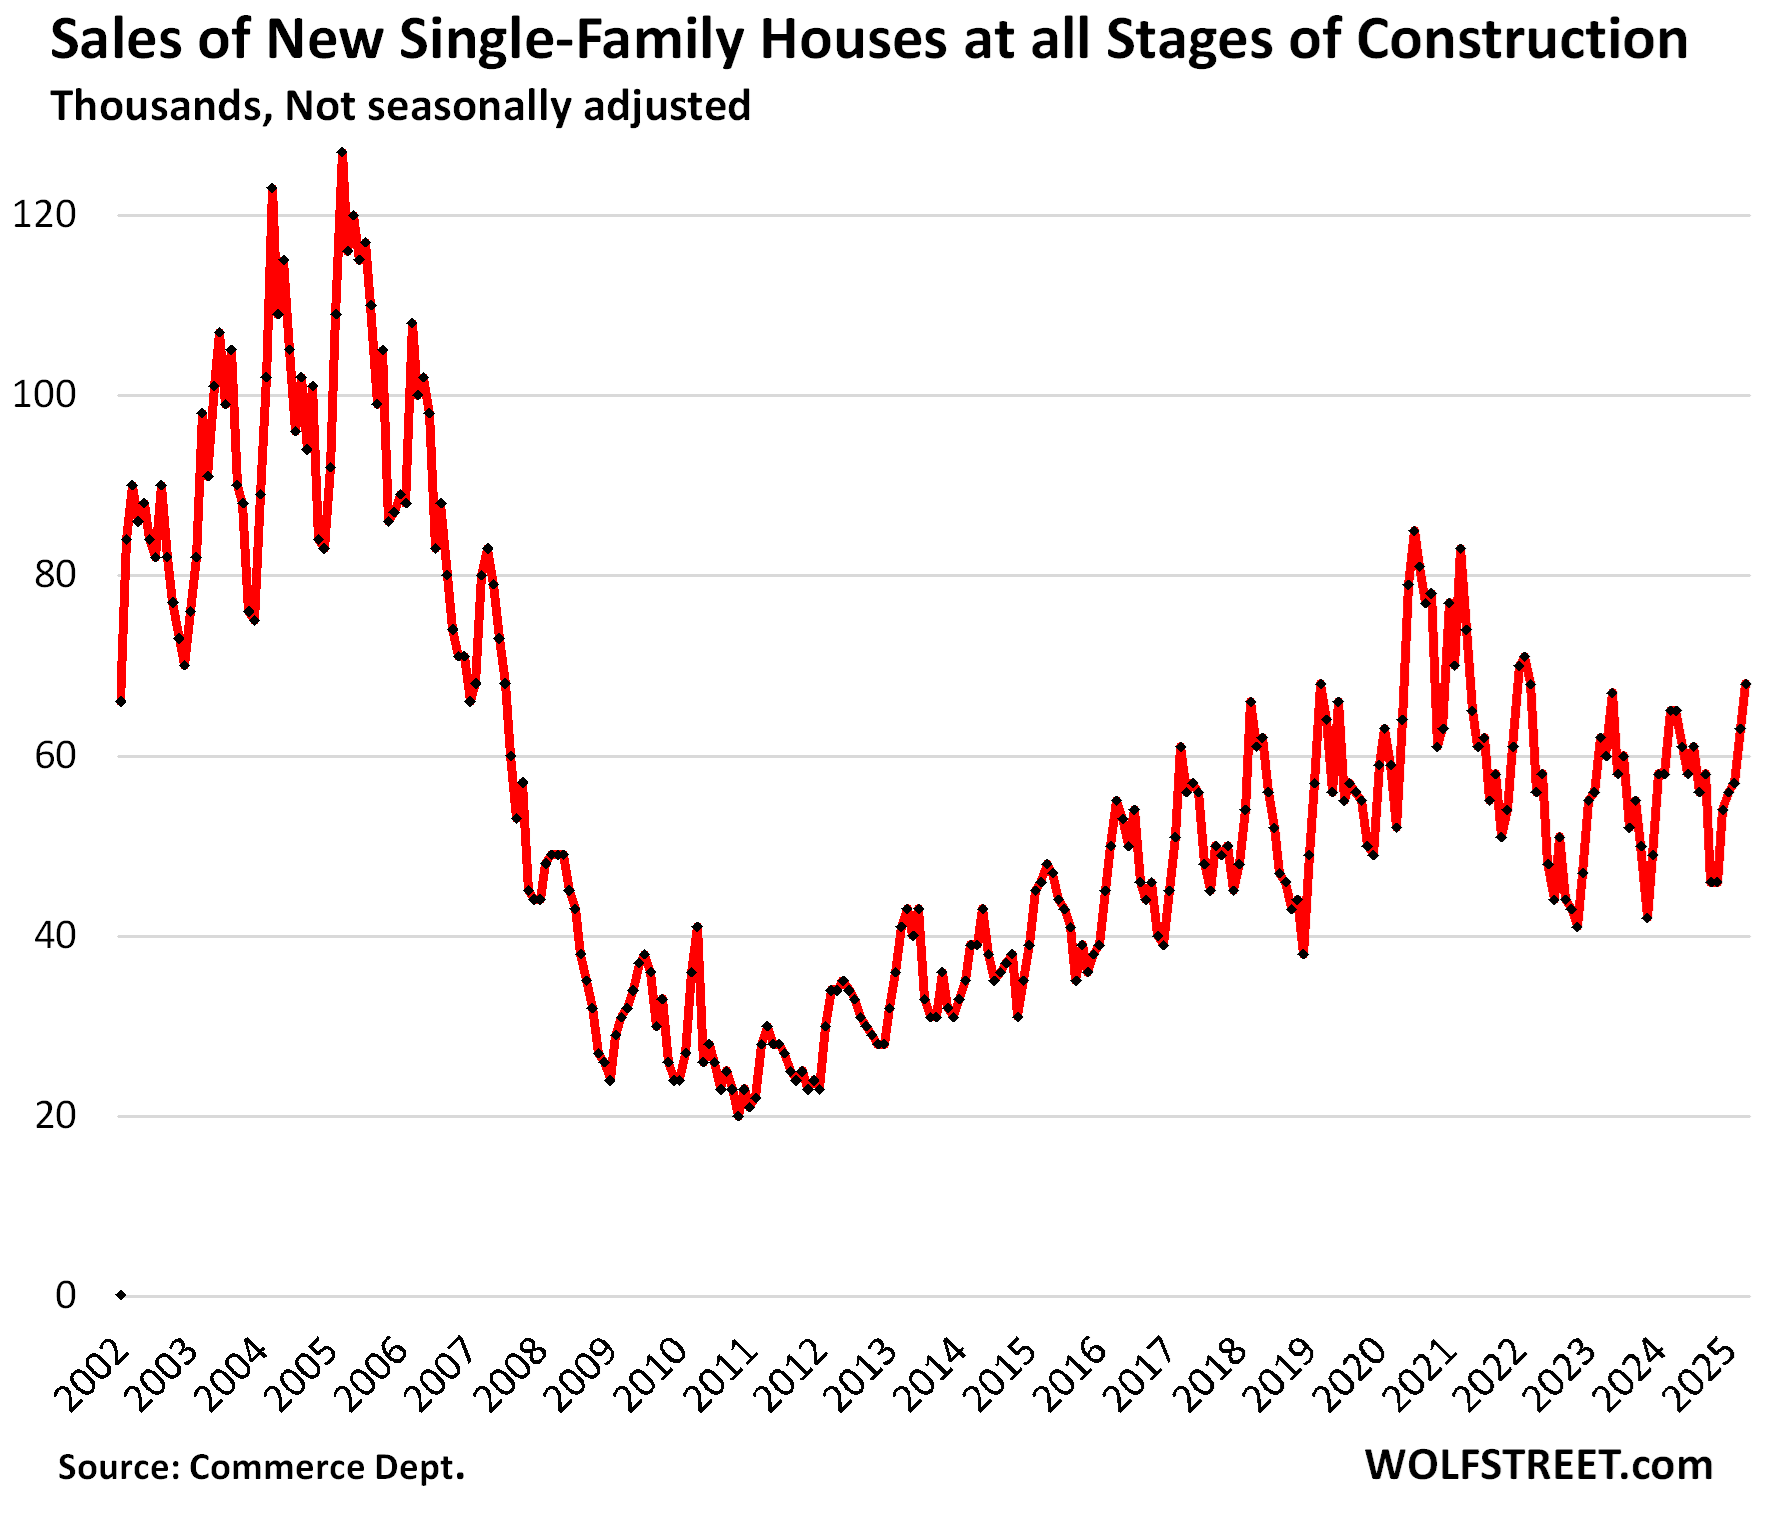
Sales in the US overall are decent.
Sales of new houses at all stages of construction for March was revised down to 63,000 signed contracts today, from the originally reported 69,000. In April, as reported today, 68,000 new houses were sold. Despite the down-revision for March, these are decent levels of sales.
April was up by 4.6% from a year ago and by 31% from April 2019. But we don’t get too excited about a strong figure in a first estimate as there is a good chance that it will be revised back into line, as March was.
At these sales, supply rose to 7.3 months in April, from 7.0 months in April 2024, and from 5.2 months in April 2019.
The homebuilders…
Homebuilders have grappled with this market by deploying a mix of lower prices, incentives, and mortgage-rate buydowns, and sales have held up, compared to sales of existing homes that have been at collapsed levels for over two years and just booked the worst April since 2009.
In this environment, stocks of the publicly traded homebuilders have zigzagged down from their highs in September, for example: DR Horton [DHI] -40%, Lennar [LEN] -44%, KB Home [KBH] -41%, and PulteGroup [PHM] -34%.
Enjoy reading WOLF STREET and want to support it? You can donate. I appreciate it immensely. Click on the mug to find out how:

![]()
Energy News Beat