
By Wolf Richter for WOLF STREET.
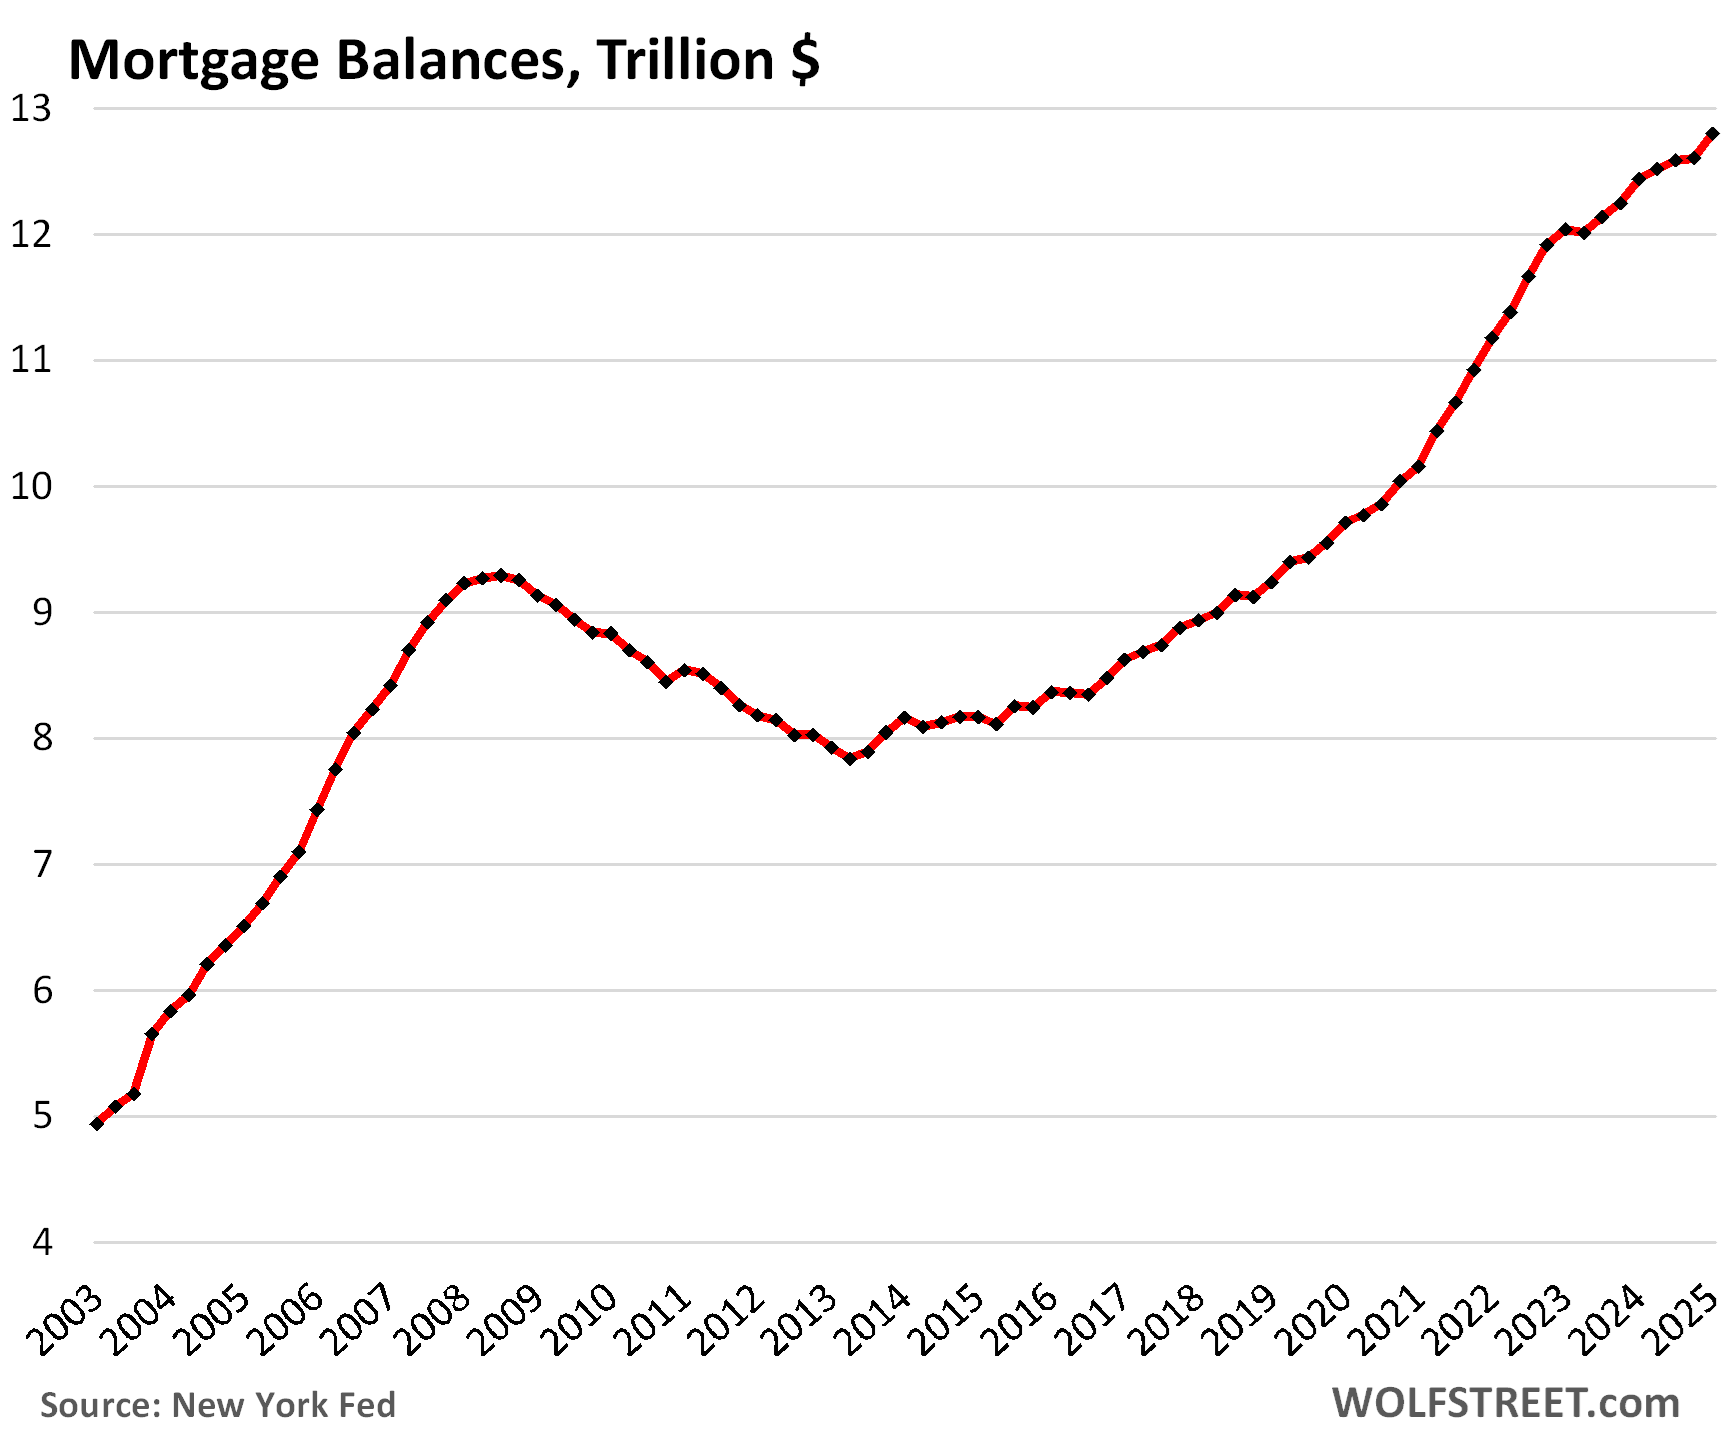
Mortgage balances rose by $195 billion (+1.5%) in Q1 from Q4, and by $358 billion (+2.9%) year-over-year, to $12.8 trillion, according to the Household Debt and Credit Report from the New York Fed, based on Equifax credit report data.
The year-over-year increases in Q1 and Q4, both at 2.9%, were small compared to year-over-year increases in the 8-10% range in 2021 and 2022. Since then demand for existing homes has plunged, while demand for new houses has been decent, and mortgages got a little bigger with home prices.
Here come the HELOCs: +27% in three years.
Balances of Home Equity Lines of Credit rose by 1.6% quarter-to-quarter in Q1, and by 6.9% year-over-year, to $402 billion. Over the past three years, HELOC balances have shot up by 27%.
Even after the 27% surge, HELOC balances remain relatively low after 13 years of lessons-learned declines coming out of the Housing Bust during which HELOCs did a lot of additional damage. These are the actual balances drawn on HELOCs:
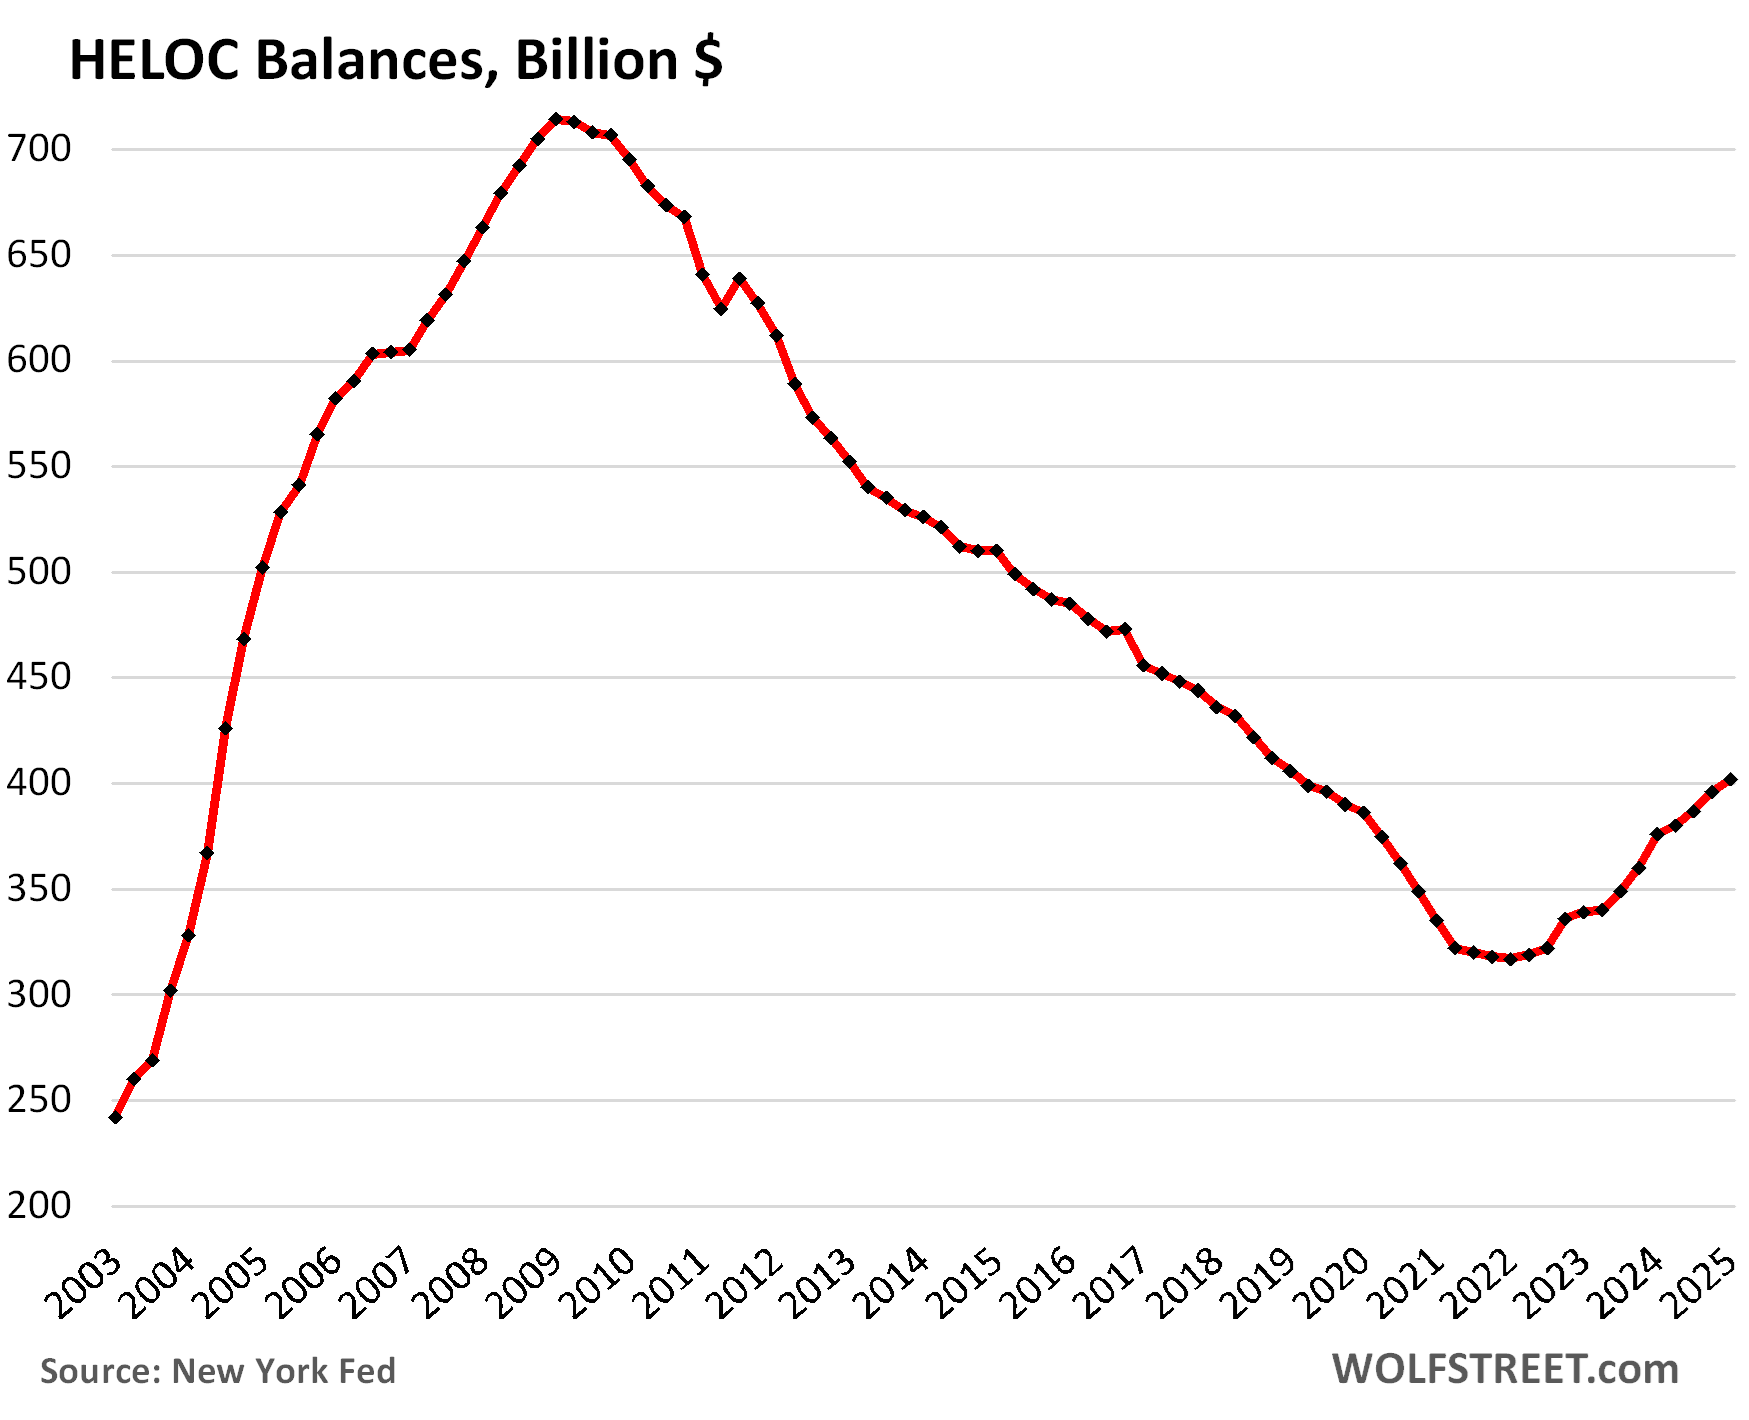
People who want some cash for home improvement projects or other purposes, or at least have the ability to draw on this cash when needed, are doing the math: It can be less costly for homeowners with a 3% mortgage to take out a HELOC at the higher rates that HELOCs come with, and not cash-out-refinance the entire existing 3% mortgage at 7%. In addition, HELOCs are lines of credit that can be kept on standby, for just in case, with no interest being due until actually drawn on.
About three-quarters of recently originated HELOCs had credit limits below $150,000, according to an earlier report from the New York Fed. At the top end, about a quarter had credit limits of $150,000 to $650,000, and only 1% had credit limits of over $650,000.
HELOCs come with a second lien on the home, and if homeowners default on the HELOC while keeping the first-lien mortgage current, they can still end up in foreclosure. In addition, after a foreclosure, when the first-lien lender takes the home, lenders of the HELOC can haunt homeowners with deficiency judgements for the unpaid HELOC balances even in the 12 “nonrecourse” states, including California, that don’t allow deficiency judgements on first-lien mortgages.
So HELOCs come with some extra risks for borrowers and lenders – which is also why lenders charge a higher rate for HELOCs than for first-lien mortgages.
The burden of housing debt: Housing-debt-to-Income Ratio.
A common way of looking at borrowers’ ability to manage the burden of debt is the debt-to-income ratio, or a debt-to-cash-flow ratio. With households, “disposable income” roughly represents cash flow after payroll taxes that is available to spend on housing, debt payments, food, fuel, and other expenses. The portion of disposable income that households don’t spend represents savings.
Disposable income is household income from all sources except capital gains, minus payroll taxes: So income from after-tax wages, plus income from interest, dividends, rentals, farm income, small business income, transfer payments from the government, etc.
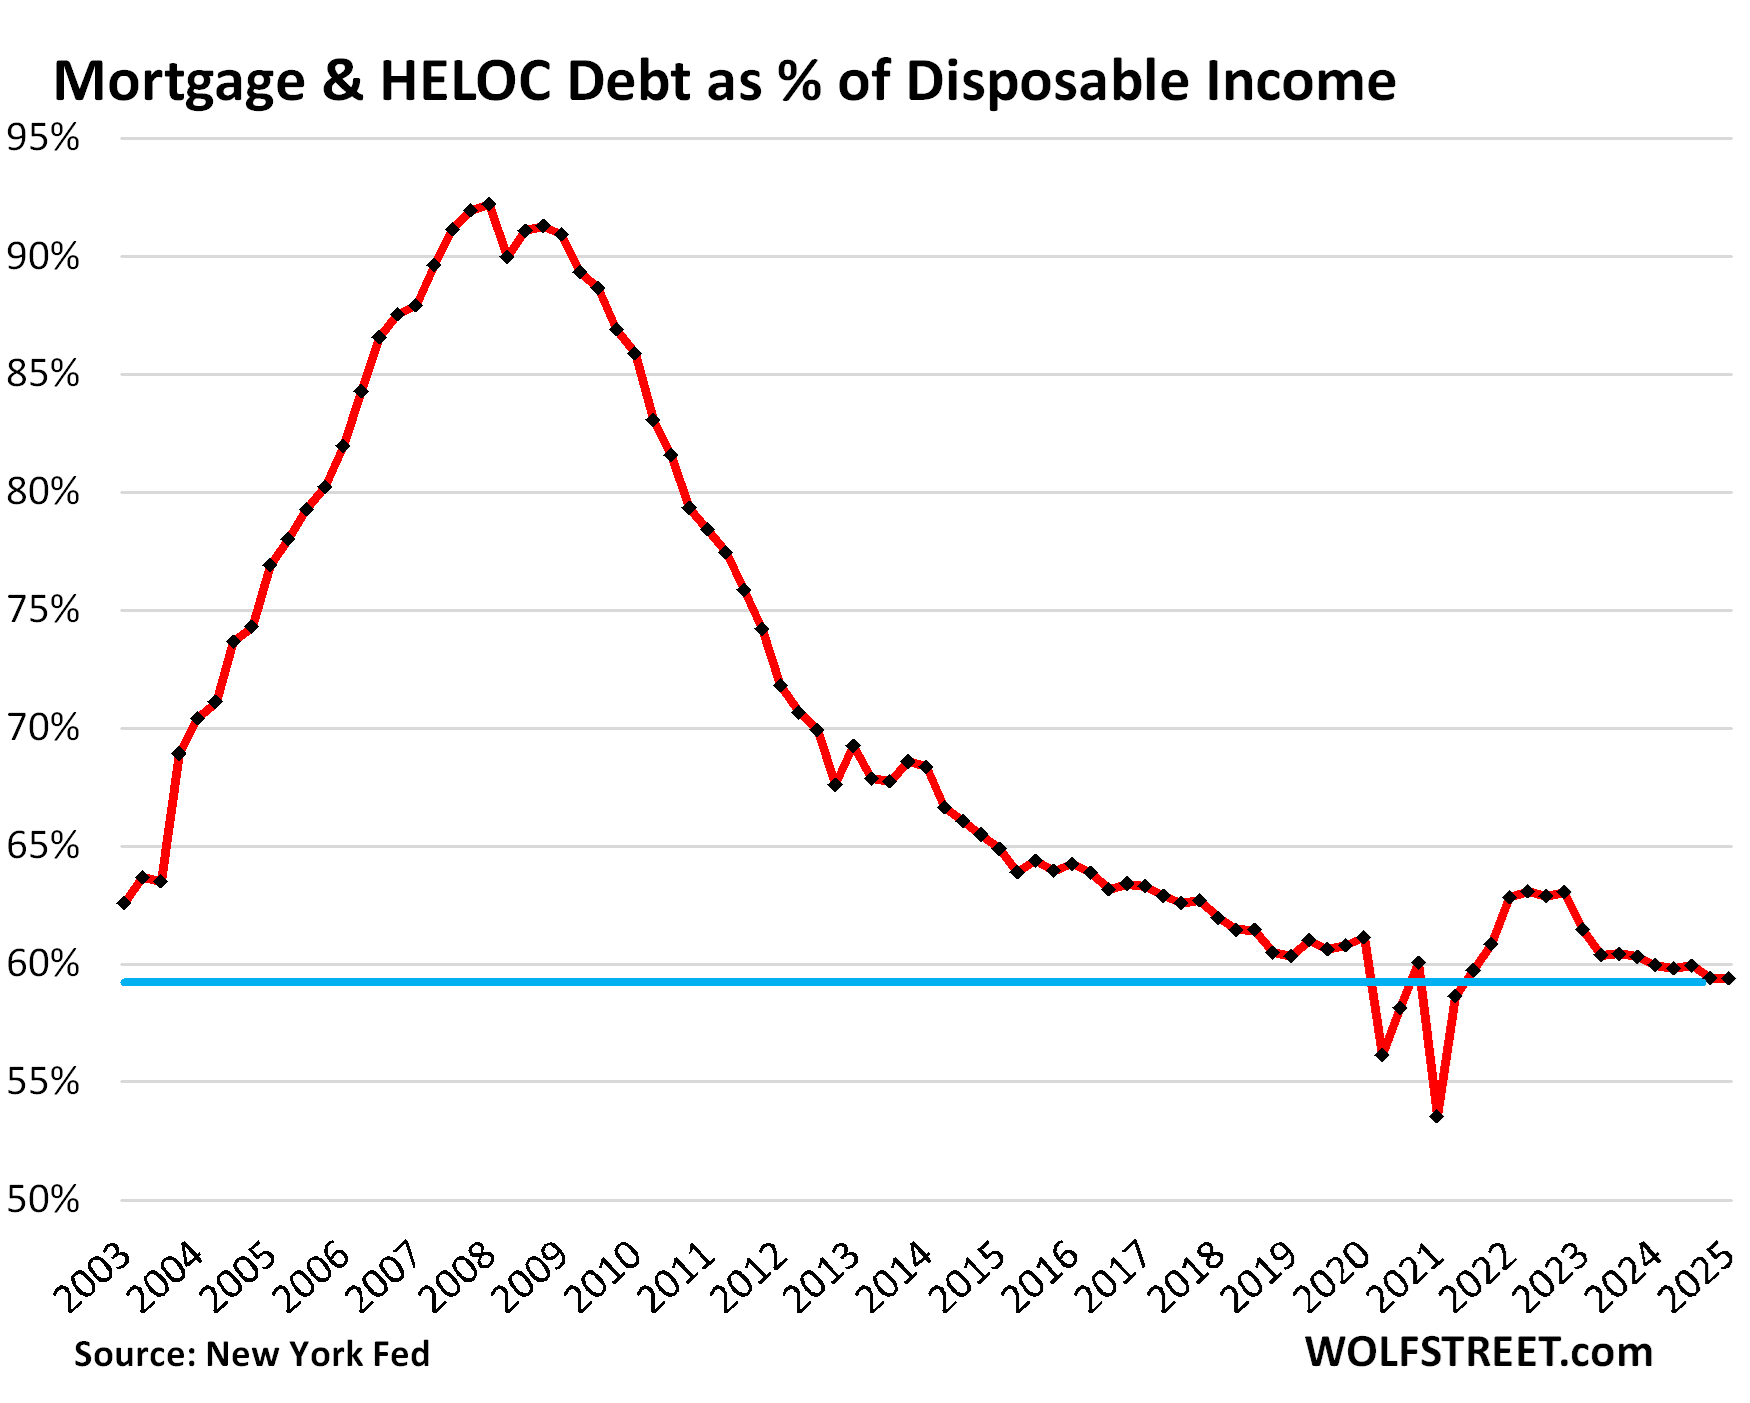
To view the burden of total housing debt on households, while accounting for more homes and higher incomes, we use the housing-debt-to-disposable-income ratio.
Disposable income rose faster year-over-year than total housing debt – mortgage debt plus HELOC debt – and kept up with housing debt growth quarter to quarter:
- QoQ: disposable income +1.6%, housing debts +1.5%.
- YoY: disposable income +4.0%, housing debts +3.0%.
With disposable income keeping up with the growth of housing debt on a quarter-to-quarter basis, the housing-debt-to-income ratio remained at 59.4% in Q1, same as in Q4, and both were the lowest in the data, except for the brief period when free-money from the government wildly distorted disposable income.
It’s obvious where the problem was in the run-up to the mortgage crisis that nearly blew up the financial system in 2008.
Housing debt is bigger now than it was in 2008 (+33%), but there are a lot more households, and they earn a lot more money, which translates into far higher disposable income (+107%), which is why the burden has plunged, even as the absolute debt has risen:
Who is on the hook this time?
Banks are mostly off the hook, except for HELOCs. Of the $12.8 trillion in mortgages outstanding (first chart above), commercial banks only held $2.37 trillion, or 18.6%, according to Federal Reserve bank balance sheet data.
Banks are more exposed to HELOCs, but the numbers are smaller. Of the $402 billion in HELOC balances outstanding, commercial banks have $267 billion, or 66.4%, on their books. But $267 billion amounts to only 1% of the $24 trillion in total assets in vast US banking system.
Mostly the taxpayer. The government through a slew of entities – Fannie Mae, Freddie Mac, Ginnie Mae, VA, FHA, USDA, etc. – guarantees the majority of residential mortgages. Those mortgages were packaged into MBS and sold to investors. If borrowers default, the taxpayer has to eat the loss.
And some institutional investors. Mortgages that banks didn’t keep on their books and that the government didn’t guarantee, such as jumbo mortgages, have been packaged into “private label” MBS and sold to institutional investors around the globe, such as pension funds and bond funds, and it’s these investors that carry the credit risk for those mortgages.
That shift from banks to the government is one of the huge changes coming out of the Financial Crisis: It’s no longer the banks and investors that are primarily at risk from bad mortgages, but US taxpayers.
So far, so good.
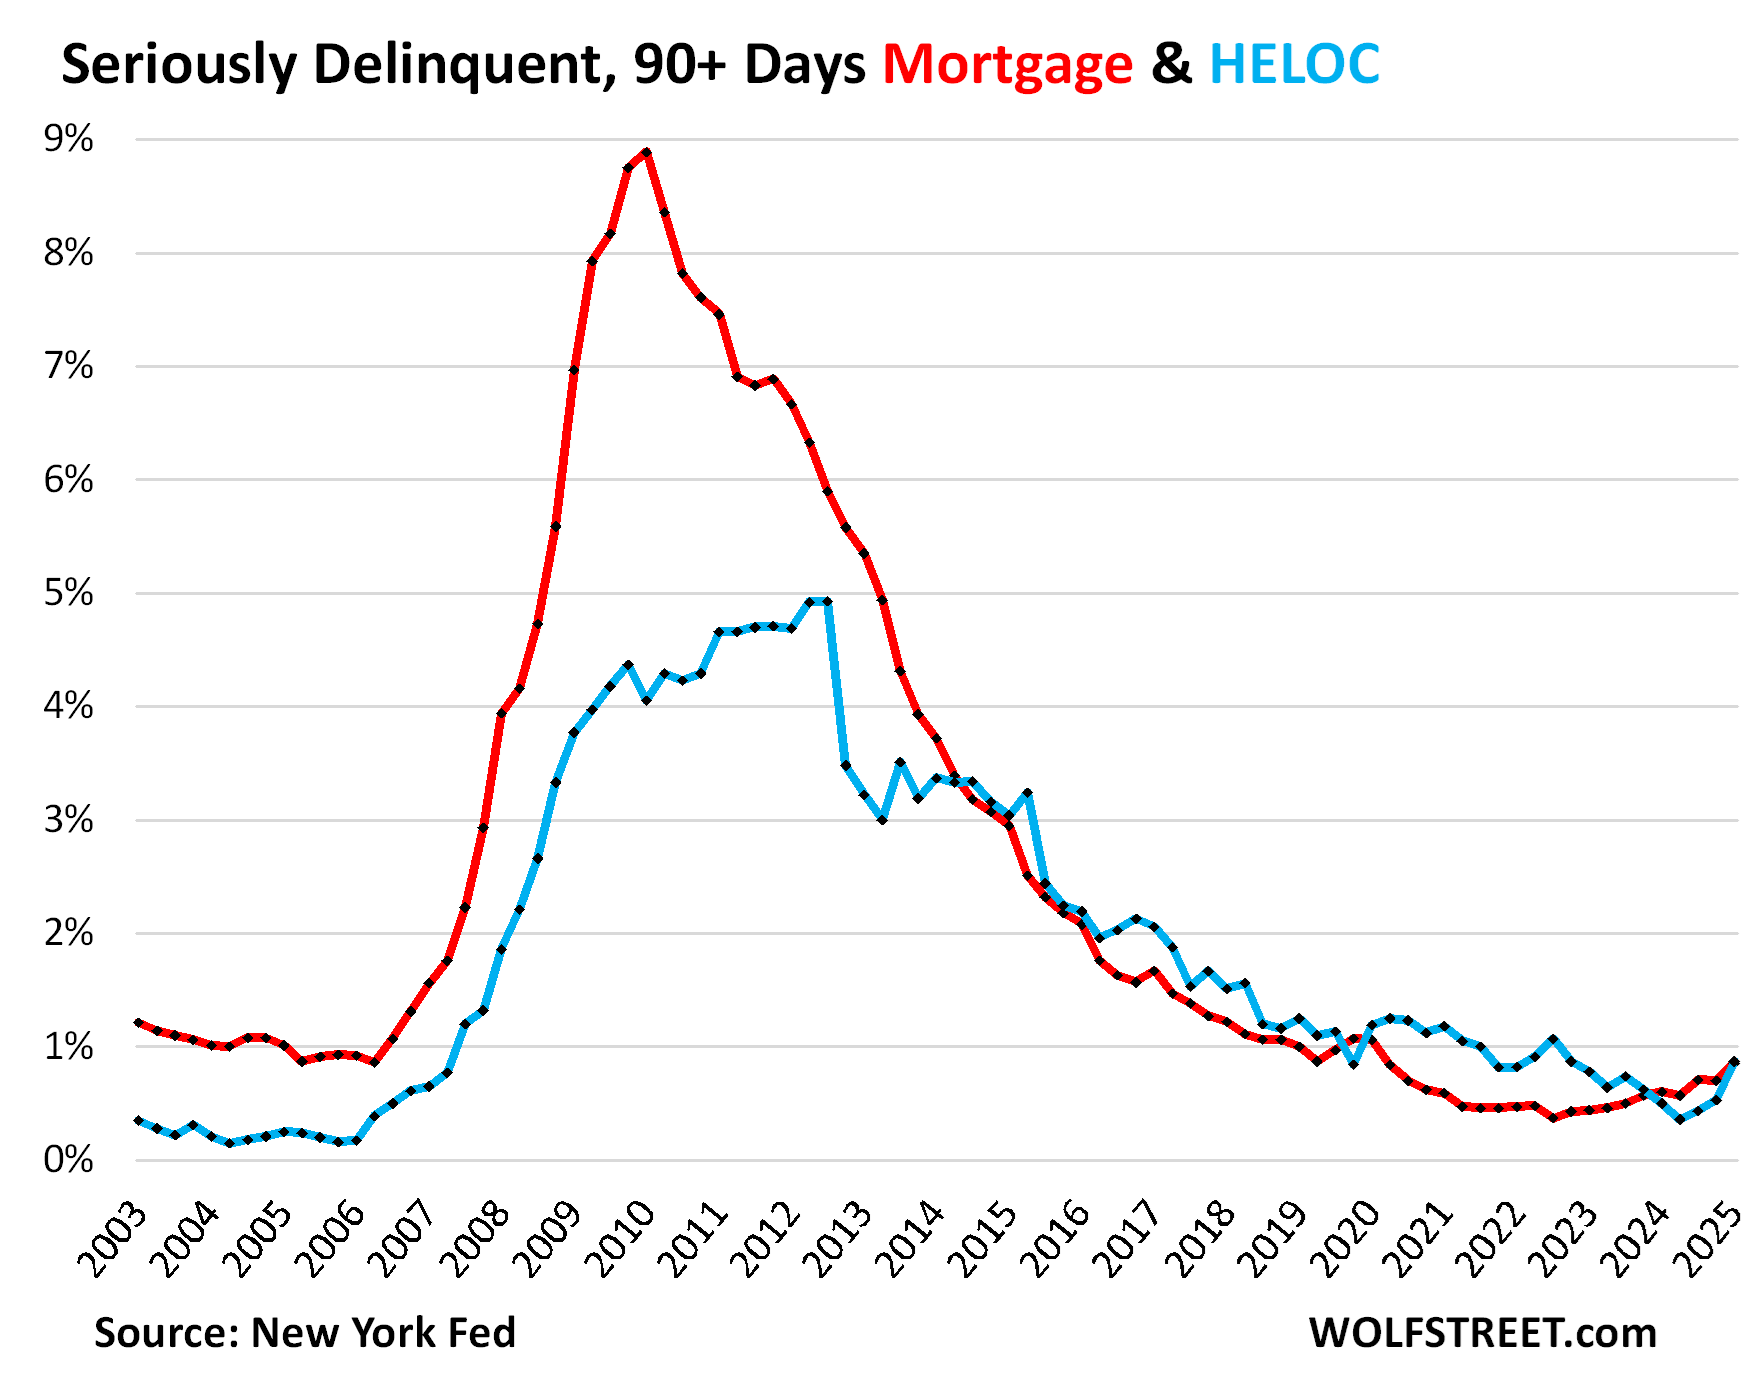
Serious delinquencies have come up, but remain low. Mortgage balances that were 90 days or more delinquent have risen from the free-money lows during the pandemic to 0.86% in Q1, which is still below the prepandemic low in Q2 2019 and substantially below the range of 1.0% and 1.7% of the rest of the quarters in 2017-2019 (red in the chart).
HELOC balances that were 90 days or more delinquent jumped to 0.87% in Q1, from 0.53% in Q4, still below the prepandemic range, but that was quite a jump, albeit from very low levels (blue).
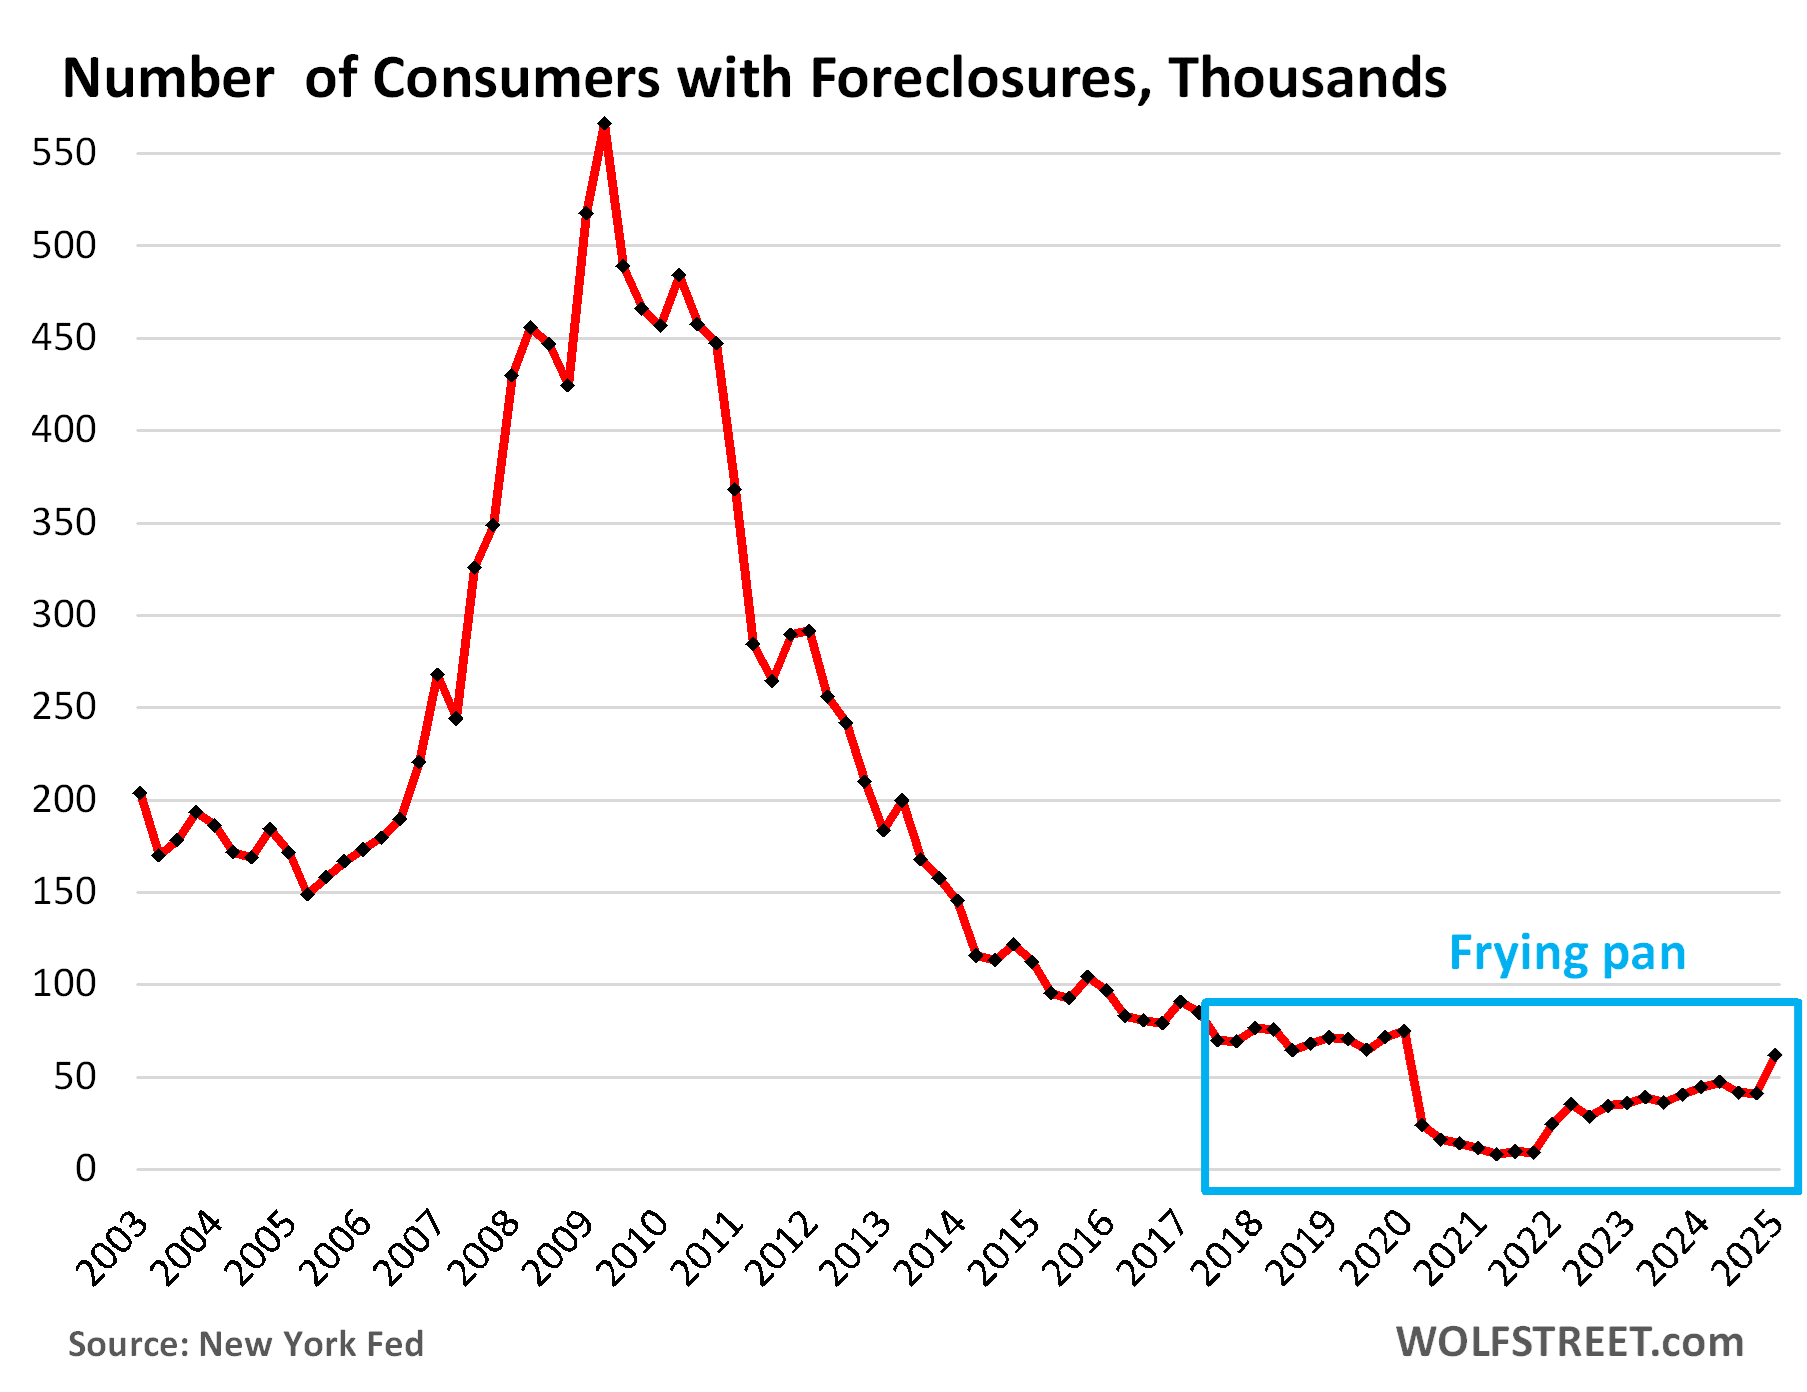
Foreclosures are low: the “frying-pan pattern.” The number of consumers with foreclosures in Q1 rose to 61,660. Though that was quite an increase, the number is still below the range of the Good Times in 2018-2019 between 65,000 and 90,000.
The mortgage forbearance programs and foreclosure bans during the pandemic, and other government programs for government mortgages, essentially made foreclosures impossible, and the number of foreclosures fell to near zero.
Most of these programs have ended, and some are now being ended, and foreclosures have risen from the free-money lows and are on their way to normal-ish levels, forming a “frying pan pattern” that has been cropping up in other credit metrics of the pandemic and its aftermath.
What is keeping foreclosures still low currently is that home prices exploded during the free-money era – see our Most Splendid Housing Bubbles in America – so most homeowners that cannot make the payments can sell their home for more than they owe on it, pay off the mortgage, and walk away with some cash. At this point, only a relatively small number of defaulting homeowners are enough underwater to not be able to pay off the mortgage with the proceeds from a sale. And those are primary candidates for foreclosure.
And in case you missed it on Wednesday: Household Debts, Debt-to-Income Ratio, Serious Delinquencies, Collections, Foreclosures, Bankruptcies: Our Drunken Sailors’ Debts in Q1 2025
Enjoy reading WOLF STREET and want to support it? You can donate. I appreciate it immensely. Click on the mug to find out how:

![]()
Energy News Beat