
Current Report
Fourth Quarter | January 2, 2025
Oil and gas activity edges higher as outlooks brighten
Special questions this quarter focus on capital spending in 2025, the oil price firms use for budgeting, changes to 2025 investment plans since the last survey, permitting times on federal lands and plans for reducing greenhouse emissions.
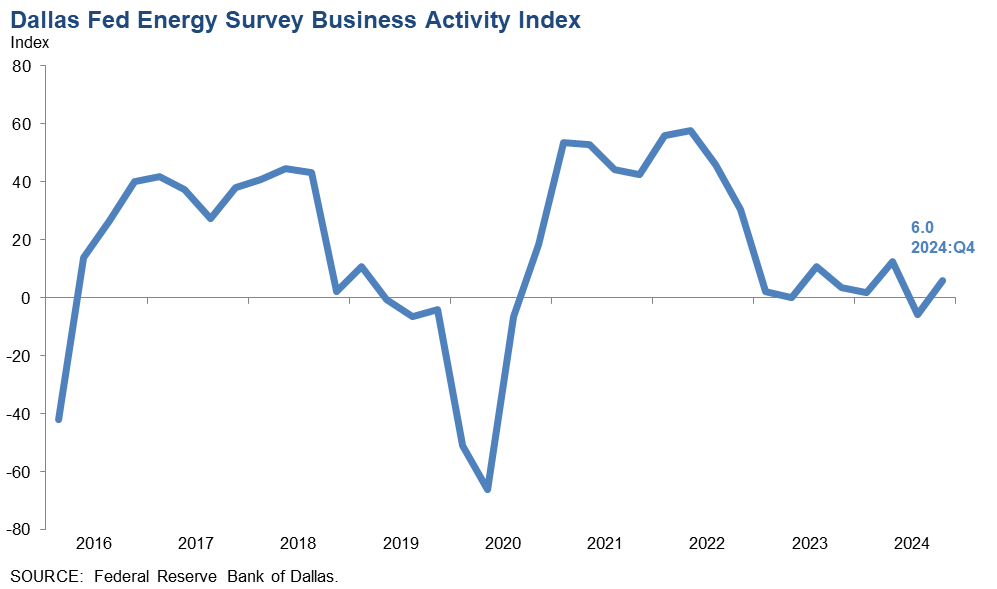
Activity in the oil and gas sector increased slightly in fourth quarter 2024, according to oil and gas executives responding to the Dallas Fed Energy Survey. The business activity index, the survey’s broadest measure of the conditions energy firms face in the Eleventh District, increased from -5.9 in the third quarter to 6.0 in the fourth quarter.
The company outlook index turned positive in the fourth quarter, increasing 19 points from -12.1 to 7.1, suggesting mild optimism among firms. The outlook uncertainty index declined 26 points to 22.4.
Oil and gas production was mixed in the fourth quarter, according to executives at exploration and production (E&P) firms. The oil production index remained positive but declined from 7.9 in the third quarter to 1.1 in the fourth quarter, suggesting oil production was relatively unchanged during the period. Meanwhile, the natural gas production index remained in negative territory but lifted from -13.3 to -3.5, indicating gas production edged lower.
Costs rose at a similar pace when compared with the prior quarter. Among oilfield services firms, the input cost index was relatively unchanged at 23.9. Among E&P firms, the finding and development costs index was relatively unchanged at 11.5. Meanwhile, the lease operating expenses index increased slightly, from 21.3 to 25.6.
Conditions among oilfield services firms weakened, albeit at a slower rate. The equipment utilization index for oilfield services firms remained in negative territory, improving from -20.9 in the third quarter to -4.4 in the fourth quarter, suggesting the pace of the decline slowed significantly. The operating margin index increased from -32.6 to -17.8, indicating margins declined at a slower rate. The prices received for services index declined from -2.3 to -13.0.
The aggregate employment index was relatively unchanged at 2.2 in the fourth quarter. While this is the 16th consecutive positive reading, the low-single-digit result suggests little net hiring. The aggregate employee hours index moved up to zero. Additionally, the aggregate wages and benefits index ticked up from 18.6 to 21.7.
On average, respondents expect a West Texas Intermediate (WTI) oil price of $71 per barrel at year-end 2025; responses ranged from $53 to $100 per barrel. When asked about longer-term expectations, respondents on average expect a WTI oil price of $74 per barrel two years from now and $80 per barrel five years from now. Survey participants anticipate a Henry Hub natural gas price of $3.19 per million British thermal units (MMBtu) at year-end 2025. When asked about longer-term expectations, respondents on average anticipate a Henry Hub gas price of $3.63 per MMBtu two years from now and $4.16 per MMBtu five years from now. For reference, WTI spot prices averaged $70.66 per barrel during the survey collection period, and Henry Hub spot prices averaged $3.04 per MMBtu.
Next release: March 26, 2025
Special Questions
Data were collected Dec. 11–19; 134 oil and gas firms responded to the special questions survey.
All firms
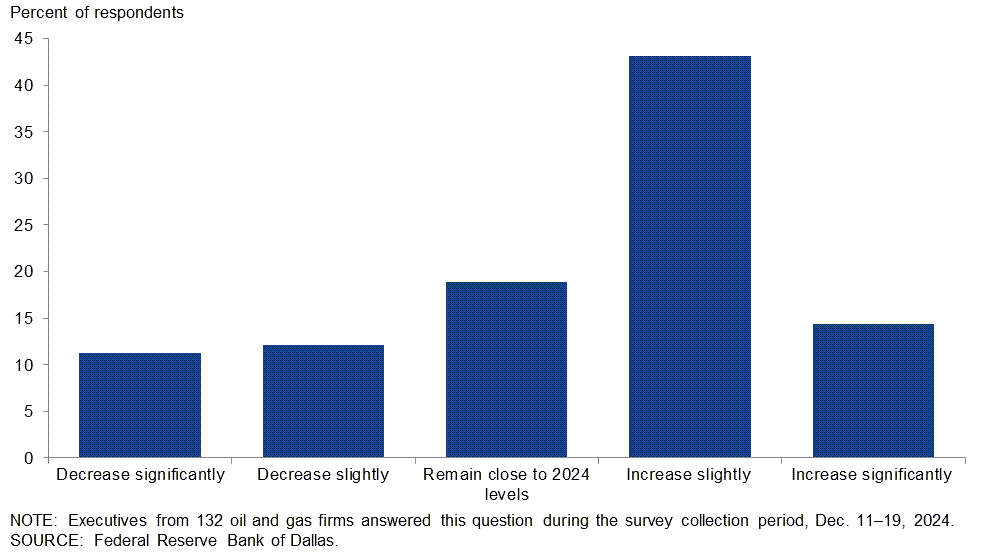
What are your expectations for your firm’s capital spending in 2025 versus 2024?
Most executives expect their firm’s capital spending to rise in 2025 compared with 2024. Forty-three percent of executives said they expect capital spending to increase slightly, while an additional 14 percent anticipate a significant increase. Nineteen percent expect spending in 2025 to remain close to 2024 levels. Twenty-three percent anticipate reductions in spending in 2025.
Responses differed depending on the firm’s size and type. A breakdown of the data for large and small exploration and production (E&P) companies and oil and gas support services is in the table below. E&P firms were classified as small if they produced fewer than 10,000 barrels per day (b/d) or large if they produced 10,000 b/d or more. In the U.S., small E&P firms are greater in number, but large E&P firms make up the majority of production (more than 80 percent).
More executives at large E&P firms expect their firm’s capital spending in 2025 to decrease relative to the number of executives anticipating capital spending to increase. “Increase slightly” was the most selected response from executives of both small E&P firms (46 percent) and service firms (40 percent).
| Response | Percent of respondents (among each group) | |||
| All firms | Large E&P | Small E&P | Services | |
| Increase significantly | 14 | 0 | 17 | 15 |
| Increase slightly | 43 | 36 | 46 | 40 |
| Remain close to 2024 levels | 19 | 14 | 21 | 17 |
| Decrease slightly | 12 | 21 | 11 | 11 |
| Decrease significantly | 11 | 29 | 4 | 17 |
| NOTES: Executives from 85 exploration and production firms and 47 oil and gas support services firms answered this question during the survey collection period, Dec. 11–19, 2024. Small E&P firms produced fewer than 10,000 barrels per day (b/d) in fourth quarter 2024, while large E&P firms produced 10,000 b/d or more. Responses came from 71 small firms and 14 large firms. Percentages may not sum to 100 due to rounding. SOURCE: Federal Reserve Bank of Dallas. |
||||
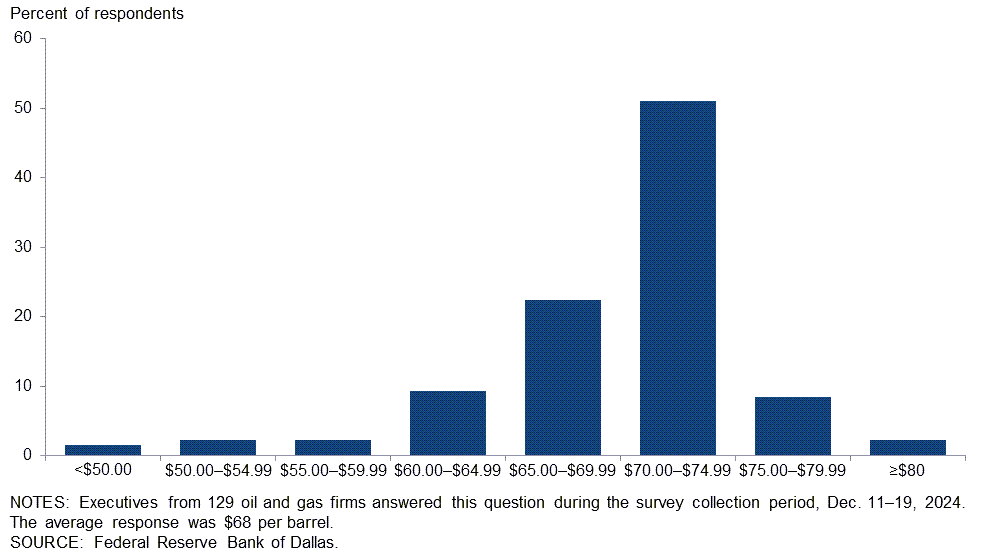
What West Texas Intermediate crude oil price is your firm using for capital planning in 2025?
For this special question, executives were asked to provide the WTI price they use for planning capital expenditures in 2025. The average response was $68 per barrel, with the median and the mode at $70 per barrel. The average price used is slightly below the price used in the budget in 2024 at $71.
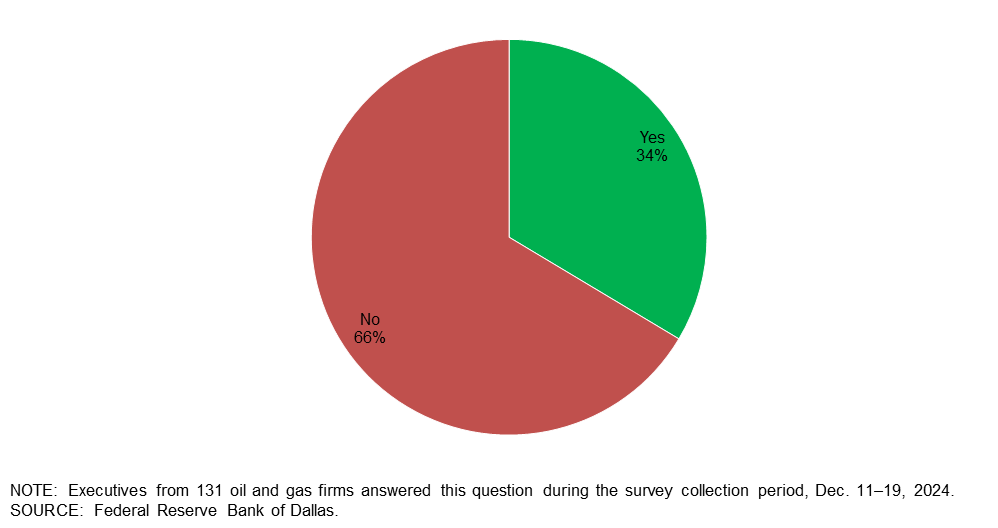
Do you anticipate increasing your investment in 2025 beyond your plans as of three months ago?
Sixty-six percent of executives said they plan no increase in their investment in 2025 beyond their plans as of three months ago. The remaining 34 percent said their firm plans to do so.
Exploration and production (E&P) firms
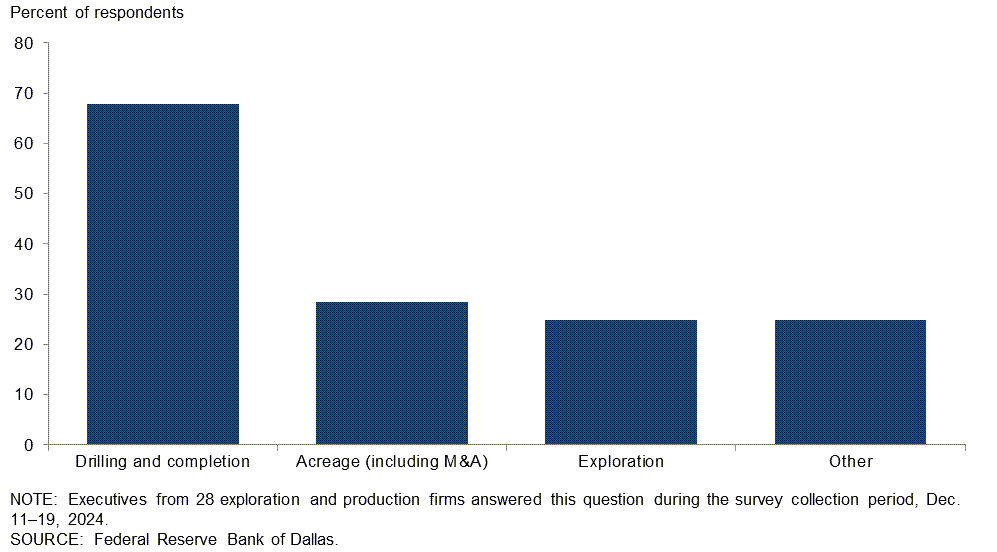
What are the areas in which you expect to invest more in? Please select all that apply.
This question was posed to exploration and production executives who said their firm anticipates increasing investment in 2025 beyond their plans as of three months ago. Of the executives surveyed, 68 percent selected “drilling and completion,” 29 percent selected “acreage (including M&A),” and 25 percent each selected “exploration” and “other.” The reasons for “other” varied widely.
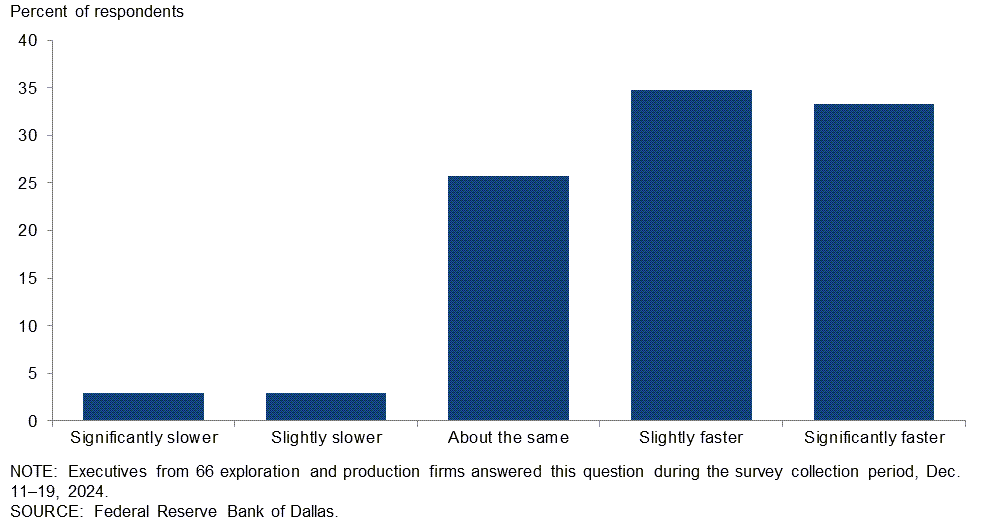
How do you expect permitting times for drilling wells on federal lands to change over the next four years?
Most executives expect permitting times for drilling wells on federal lands to improve over the next four years. Thirty-five percent of executives said they expect permitting times to decrease slightly, while an additional 33 percent expect significantly quicker permitting. Twenty-six percent anticipate little change. Only six percent anticipate permitting times to increase.
Which of the following plans does your firm have? (Check all that apply.)
E&P firms were first asked to define their size based on fourth quarter 2024 crude oil production. They were then asked if they had any of the following plans: reduce carbon emissions; reduce methane emissions; reduce flaring; recycle/reuse water; invest in renewables. Respondents could choose more than one answer for this special question.
For the large firms, 57 percent of executives said their firms plans to reduce carbon dioxide emissions, 64 percent indicated plans to reduce methane emissions, 86 percent to reduce flaring, 43 percent to recycle/reuse water and 7 percent to invest in renewables.
For the small firms, 18 percent of executives said their firms plan to reduce carbon dioxide emissions, 29 percent anticipate reducing methane emissions, 14 percent plan to reduce flaring, 18 percent plan to recycle/reuse water and 5 percent to invest in renewables. Among the smaller firms, 58 percent said they have no mitigation plans, compared with 7 percent of large E&P firms.
| Response | Percent of respondents (among each group) | ||
| Small firms | Large firms | All firms | |
| Plan to reduce CO2 emissions | 18 | 57 | 25 |
| Plan to reduce methane emissions | 29 | 64 | 35 |
| Plan to reduce flaring | 14 | 86 | 27 |
| Plan to recycle/reuse water | 18 | 43 | 23 |
| Plan to invest in renewables | 5 | 7 | 5 |
| None of the above | 58 | 7 | 49 |
| NOTES: Executives from 79 exploration and production firms answered this question during the survey collection period, Dec. 11–19, 2024. Small firms produced less than 10,000 b/d in fourth quarter 2024, while large firms produced 10,000 b/d or more. There were 65 small firms and 14 large firms responding to this question. SOURCE: Federal Reserve Bank of Dallas. |
|||
Special Questions Comments
Exploration and Production (E&P) Firms
- Permitting for wells, pipelines, construction, etc., are all being delayed, and the costs for the process are getting astronomical and taking many years for what should be a straightforward process. Different states within the U.S. are operating as if they are independent countries making up individual terms, rules and bureaucracies.
Oil and Gas Support Services Firms
- Stacked rigs will remain stacked, and no upgrades or rebuilds will be started at current day rates.
Results Table
Historical data are available from first quarter 2016 to the most current release quarter.
Business Indicators: Quarter/Quarter
| Business Indicators: All Firms Current Quarter (versus previous quarter) |
|||||
| Indicator | Current Index | Previous Index | % Reporting Increase |
% Reporting No Change |
% Reporting Decrease |
| Level of Business Activity | 6.0 | –5.9 | 25.4 | 55.2 | 19.4 |
| Capital Expenditures | 1.5 | –3.8 | 28.8 | 43.9 | 27.3 |
| Supplier Delivery Time | –4.6 | –3.8 | 2.3 | 90.8 | 6.9 |
| Employment | 2.2 | 2.9 | 16.4 | 69.4 | 14.2 |
| Employee Hours | 0.0 | –2.3 | 13.4 | 73.1 | 13.4 |
| Wages and Benefits | 21.7 | 18.6 | 26.9 | 67.9 | 5.2 |
| Indicator | Current Index | Previous Index | % Reporting Improved |
% Reporting No Change |
% Reporting Worsened |
| Company Outlook | 7.1 | –12.1 | 29.9 | 47.2 | 22.8 |
| Indicator | Current Index | Previous Index | % Reporting Increase |
% Reporting No Change |
% Reporting Decrease |
| Uncertainty | 22.4 | 48.6 | 38.8 | 44.8 | 16.4 |
| Business Indicators: E&P Firms Current Quarter (versus previous quarter) |
|||||
| Indicator | Current Index | Previous Index | % Reporting Increase |
% Reporting No Change |
% Reporting Decrease |
| Level of Business Activity | 8.0 | 0.0 | 24.1 | 59.8 | 16.1 |
| Oil Production | 1.1 | 7.9 | 28.7 | 43.7 | 27.6 |
| Natural Gas Wellhead Production | –3.5 | –13.3 | 25.6 | 45.3 | 29.1 |
| Capital Expenditures | 3.6 | 0.0 | 31.8 | 40.0 | 28.2 |
| Expected Level of Capital Expenditures Next Year | 24.1 | 12.1 | 42.5 | 39.1 | 18.4 |
| Supplier Delivery Time | –5.9 | –4.5 | 1.2 | 91.8 | 7.1 |
| Employment | 4.6 | 1.1 | 13.8 | 77.0 | 9.2 |
| Employee Hours | –2.3 | 2.2 | 8.0 | 81.6 | 10.3 |
| Wages and Benefits | 24.1 | 16.5 | 28.7 | 66.7 | 4.6 |
| Finding and Development Costs | 11.5 | 9.9 | 19.5 | 72.4 | 8.0 |
| Lease Operating Expenses | 25.6 | 21.3 | 32.6 | 60.5 | 7.0 |
| Indicator | Current Index | Previous Index | % Reporting Improved |
% Reporting No Change |
% Reporting Worsened |
| Company Outlook | 13.8 | –14.8 | 33.8 | 46.3 | 20.0 |
| Indicator | Current Index | Previous Index | % Reporting Increase |
% Reporting No Change |
% Reporting Decrease |
| Uncertainty | 24.1 | 52.7 | 40.2 | 43.7 | 16.1 |
| Business Indicators: O&G Support Services Firms Current Quarter (versus previous quarter) |
|||||
| Indicator | Current Index | Previous Index | % Reporting Increase |
% Reporting No Change |
% Reporting Decrease |
| Level of Business Activity | 2.2 | –18.1 | 27.7 | 46.8 | 25.5 |
| Utilization of Equipment | –4.4 | –20.9 | 21.7 | 52.2 | 26.1 |
| Capital Expenditures | –2.1 | –11.9 | 23.4 | 51.1 | 25.5 |
| Supplier Delivery Time | –2.2 | –2.3 | 4.3 | 89.1 | 6.5 |
| Lag Time in Delivery of Firm’s Services | 0.0 | 4.7 | 6.5 | 87.0 | 6.5 |
| Employment | –2.1 | 6.8 | 21.3 | 55.3 | 23.4 |
| Employment Hours | 4.3 | –12.1 | 23.4 | 57.4 | 19.1 |
| Wages and Benefits | 17.0 | 22.8 | 23.4 | 70.2 | 6.4 |
| Input Costs | 23.9 | 23.3 | 26.1 | 71.7 | 2.2 |
| Prices Received for Services | –13.0 | –2.3 | 8.7 | 69.6 | 21.7 |
| Operating Margin | –17.8 | –32.6 | 13.3 | 55.6 | 31.1 |
| Indicator | Current Index | Previous Index | % Reporting Improved |
% Reporting No Change |
% Reporting Worsened |
| Company Outlook | –4.3 | –6.9 | 23.4 | 48.9 | 27.7 |
| Indicator | Current Index | Previous Index | % Reporting Increase |
% Reporting No Change |
% Reporting Decrease |
| Uncertainty | 19.2 | 40.0 | 36.2 | 46.8 | 17.0 |
Business Indicators: Year/Year
| Business Indicators: All Firms Current Quarter (versus same quarter a year ago) |
|||||
| Indicator | Current Index | Previous Index | % Reporting Increase |
% Reporting No Change |
% Reporting Decrease |
| Level of Business Activity | –3.2 | –2.3 | 34.6 | 27.6 | 37.8 |
| Capital Expenditures | 4.8 | 7.2 | 36.0 | 32.8 | 31.2 |
| Supplier Delivery Time | –8.1 | –4.8 | 5.7 | 80.5 | 13.8 |
| Employment | 4.0 | 9.5 | 26.0 | 52.0 | 22.0 |
| Employee Hours | 5.5 | 7.2 | 23.8 | 57.9 | 18.3 |
| Wages and Benefits | 45.3 | 39.0 | 51.6 | 42.1 | 6.3 |
| Indicator | Current Index | Previous Index | % Reporting Improved |
% Reporting No Change |
% Reporting Worsened |
| Company Outlook | 5.2 | –13.1 | 36.8 | 31.6 | 31.6 |
| Business Indicators: E&P Firms Current Quarter (versus same quarter a year ago) |
|||||
| Indicator | Current Index | Previous Index | % Reporting Increase |
% Reporting No Change |
% Reporting Decrease |
| Level of Business Activity | 6.2 | 7.0 | 38.3 | 29.6 | 32.1 |
| Oil Production | –5.1 | 7.1 | 35.4 | 24.1 | 40.5 |
| Natural Gas Wellhead Production | –12.5 | –17.1 | 28.8 | 30.0 | 41.3 |
| Capital Expenditures | 7.6 | 7.1 | 39.2 | 29.1 | 31.6 |
| Expected Level of Capital Expenditures Next Year | 19.0 | 17.8 | 44.3 | 30.4 | 25.3 |
| Supplier Delivery Time | –3.9 | –4.9 | 5.1 | 85.9 | 9.0 |
| Employment | 5.0 | 1.1 | 21.0 | 63.0 | 16.0 |
| Employee Hours | 6.2 | 7.1 | 17.5 | 71.3 | 11.3 |
| Wages and Benefits | 43.7 | 35.3 | 50.0 | 43.8 | 6.3 |
| Finding and Development Costs | 16.1 | 14.2 | 34.6 | 46.9 | 18.5 |
| Lease Operating Expenses | 38.5 | 36.9 | 51.3 | 35.9 | 12.8 |
| Indicator | Current Index | Previous Index | % Reporting Improved |
% Reporting No Change |
% Reporting Worsened |
| Company Outlook | 8.3 | –9.4 | 37.5 | 33.3 | 29.2 |
| Business Indicators: O&G Support Services Firms Current Quarter (versus same quarter a year ago) |
|||||
| Indicator | Current Index | Previous Index | % Reporting Increase |
% Reporting No Change |
% Reporting Decrease |
| Level of Business Activity | –19.5 | –21.0 | 28.3 | 23.9 | 47.8 |
| Utilization of Equipment | –24.4 | –20.0 | 20.0 | 35.6 | 44.4 |
| Capital Expenditures | 0.0 | 7.2 | 30.4 | 39.1 | 30.4 |
| Supplier Delivery Time | –15.5 | –4.8 | 6.7 | 71.1 | 22.2 |
| Lag Time in Delivery of Firm’s Services | –11.4 | –4.8 | 6.8 | 75.0 | 18.2 |
| Employment | 2.2 | 25.6 | 34.8 | 32.6 | 32.6 |
| Employment Hours | 4.4 | 7.3 | 34.8 | 34.8 | 30.4 |
| Wages and Benefits | 47.8 | 46.5 | 54.3 | 39.1 | 6.5 |
| Input Costs | 51.1 | 50.0 | 60.0 | 31.1 | 8.9 |
| Prices Received for Services | –11.6 | 7.2 | 25.6 | 37.2 | 37.2 |
| Operating Margin | –22.7 | –31.0 | 25.0 | 27.3 | 47.7 |
| Indicator | Current Index | Previous Index | % Reporting Improved |
% Reporting No Change |
% Reporting Worsened |
| Company Outlook | 0.0 | –20.0 | 35.6 | 28.9 | 35.6 |
Activity Chart
Comments
Comments from Survey Respondents
These comments are from respondents’ completed surveys and have been edited for publication. Comments from the Special Questions survey can be found below the special questions.
Exploration and Production (E&P) Firms
- Operating cost is a concern for the energy industry, and it could impact production levels.
- The change in political landscape is helpful insofar as regulations, but it appears that crude oil prices are headed down.
- We’re assuming that the new administration will encourage more development of oil and gas projects.
- Production for our firm has decreased with increased costs to remediate production issues with the prospect of lower crude oil prices.
- The continued weak natural gas market in areas of primary production is a significant drag on revenue. Negative gas charges (gas disposal fees) are as high as 15 percent of oil revenue on one lease in New Mexico.
- The new administration should have a positive effect on the economy, thus lifting the oil industry.
- Regulatory issues continue to be the biggest hindrance to our business. Plaintiff lawsuits are on the increase.
- Permitting politics by California regulatory agencies are intrusive and problematic. California is usurping federal leases and blocking federally permitted operations. This prevents development and, therefore, reduces payments to the federal government in lease royalties. This needs significant federal, Bureau of Land Management and political intervention immediately.
- The low price for natural gas is crushing current cash flow. For smaller independents, cash flow is what feeds future investment. We need restrictions to be lifted for selling LNG (liquefied natural gas) to overseas buyers so that demand for natural gas will increase the prices we receive.
- Uncertainty in commodity pricing futures affect our business in multiple ways. Firstly, through putting pressure on mergers and acquisitions (M&A), which our company depends on for growth. Secondly, through monthly net revenue that is controlled by front-month strip pricing, as our company does not hedge any production volumes. The severe degree of uncertainty in commodity pricing futures makes capital planning difficult outside of M&A. The commodity pricing uncertainty is caused by many different factors.
- We are seeking development drilling capital to extend our business as our current private equity funder needs their capital returned through distributions. We will pay off debt in 2025 and start cash distributions to our investors in 2026, which means we’ll reduce drilling and capital expenditures net to the company.
- We have two main asset positions, one that is fully developed and one that we are currently delineating. As such, one’s position on production is declining rapidly while the development of the other position is in a slower portion of its life cycle. Thus, our declining production is more a function of our company and the relative asset cycles than it is related to any broad market trends.
- We are anticipating that regulatory compliance issues will decrease, primarily due to an incoming administration that is pro-business and pro-fossil-fuel production.
- Higher interest rates discourage long-term capital investments.
- The recent election result is changing outlooks. The new administration will lift regulations, stop subsiding green energy and seek LNG build-outs to place more demand on natural gas.
- We are more optimistic.
Oil and Gas Support Services Firms
- There is more optimism looking at first quarter 2025 than first quarter 2024. Much of 2024 felt like a waiting game as M&A activity kept clients in a holding pattern. First quarter 2025 has more people talking about putting rigs in the ground (versus first quarter 2024). We think the election results will be good for activity even if it’s just because operators and service companies have a clear direction for planning.
- “Drill, baby, drill” will not be positive for the oilfield services space if WTI [West Texas Intermediate] drops below $65 per barrel for a substantial period.
- We expect a slowdown in 2025 with muted growth compared with the previous three years. Reasons for the slowdown include consolidation of E&P customers, flat or reduced capital budgets and lack of electrical infrastructure growth.
- E&P consolidation over the past 12 months has negatively impacted oilfield services. The effect from that consolidation has been amplified in the second half of 2024 as the deals have closed.
- As always, international politics play havoc with the price of oil. Output from Iran and the ability of Russia to transport its products are uncertain, particularly with the EU [European Union] cracking down on Russia’s ghost ships. OPEC is continuing its production cuts. For now, oil seems to be stable, but that could change at any time. Also uncertain is whether the Permian Basin can continue to produce at current levels. The big question is where the next big drilling push will be; perhaps it will be the Central Basin Platform.
- There is significant uncertainty with the new regime in Washington soon and the state of international relations. The deepwater O&G [oil and gas] industry still has long lead times to react to a need to increase production quickly.
- We are encouraged that the new administration in Washington, D.C., will enact some positive regulatory changes for offshore drilling in the U.S.
- Lower demand for oil and gas is limiting drilling and completion expansion. Efficiency gains in extraction technology have improved production with no increase in activity. It appears supply and demand are in close balance while production is sufficient for market needs.
- The end-of-year slowdown in onshore activity is greater than anticipated.
- The outcome of the presidential election removes the risk of the unknown, and the incoming president is not expected to be a barrier for the oil and gas industry, as the current one was. Though no immediate relief, at least policies will be clear and likely supportive, or at the least, not restrictive. We expect the ban on permits for LNG export terminals to be lifted, which will eventually lead to stabilizing natural gas prices and reduced barriers to oil production via providing a market for the associated gas production. Of course, all of this is very optimistic and hinges on a combination of OPEC control and improvement in the Chinese economic situation.
- The insurance market is becoming more and more problematic as a result of tort liability associated with on-road exposure. Accidents that have no injuries inevitably result in a lawsuit. Carriers do not fight these claims and try to settle for the cost of defense, ranging from $200,000–$500,000.
- The backlog of work for our firm has increased.
We give you energy news and help invest in energy projects too, click here to learn more
Crude Oil, LNG, Jet Fuel price quote
ENB Top News
ENB
Energy Dashboard
ENB Podcast
ENB Substack
Energy News Beat
