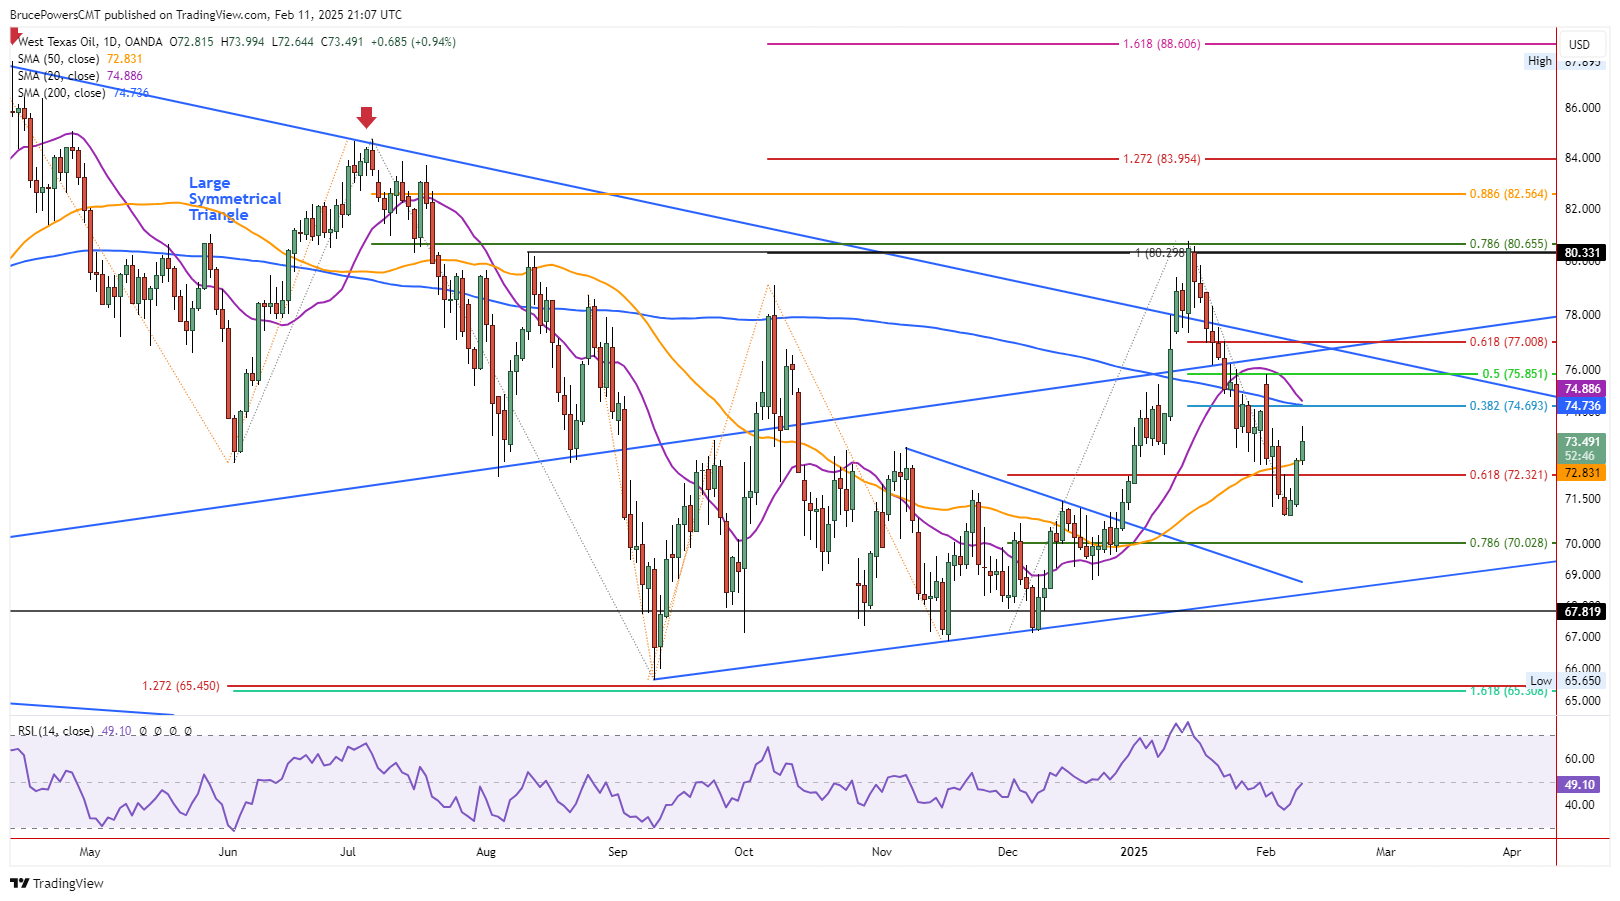
Crude oil reclaimed the 50-Day MA at $72.83, signaling strength. Watch resistance between $74.60-$74.89 and potential support at $70.91.
Crude oil further confirmed the recent swing low of $70.91 as support. On Tuesday, crude triggered a continuation of the rally from that low, reaching a new high of $73.99 for the bounce. Strength was also indicated by the reclaim of the 50-Day MA today, now at $72.83. Resistance was seen at the 50-Day line on Monday.
Today’s decisive breakout above the 50-Day line shows strength that should be sustained towards a test of higher prices. The day is likely to end with crude in a relatively strong position, in the top third of the day’s trading range. That top third of the range is above $73.54. Also, be aware that today’s low was a successful test of support at the 50-Day MA, which is a sign of strength.

Next Upside Target is $74.74
The next upside targets are the 200-Day MA at $74.74 and the 20-Day MA, now at $74.89. Notice that the 20-Day line is falling and close to converging with the 200-Day line. Each line presents potentially solid resistance on its own but more so if combined to identify a similar price area. Confirming the 200-Day line is the 38.2% Fibonacci retracement at $74.69. Together, they put a bull’s eye on a price zone from $74.6 to $74.89 and increases the chance of the price zone being tested as resistance.
Strong Resistance Looks Likely Around $75.85
Higher price targets start with the 50% retracement at $75.85. That price area is confirmed by the interim swing high at $75.82. The swing high is part of the bearish price structure for the recent correction as it was a lower swing high, relative to the recent $80.76 peak. Once support is successfully tested at the lower end of the week’s range, as seen on Monday, a swing back toward the top of the range is possible. This would be similar behavior to what is seen inside a consolidation pattern.
Once one side of the pattern is tested as either support or resistance, and a reversal sets up, the other side of the pattern becomes a potential target. If crude follows through as it might, the top of the weekly range at $75.82 becomes a target. Since the week’s high gives credence to the 50% target zone, it is possible that it is eventually reached. Moreover, the 50-Week MA is also nearby at $76.02.
For a look at all of today’s economic events, check out our economic calendar.
We give you energy news and help invest in energy projects too, click here to learn more
Energy News Beat
