
Too-high prices trigger demand destruction, market freezes.
By Wolf Richter for WOLF STREET.
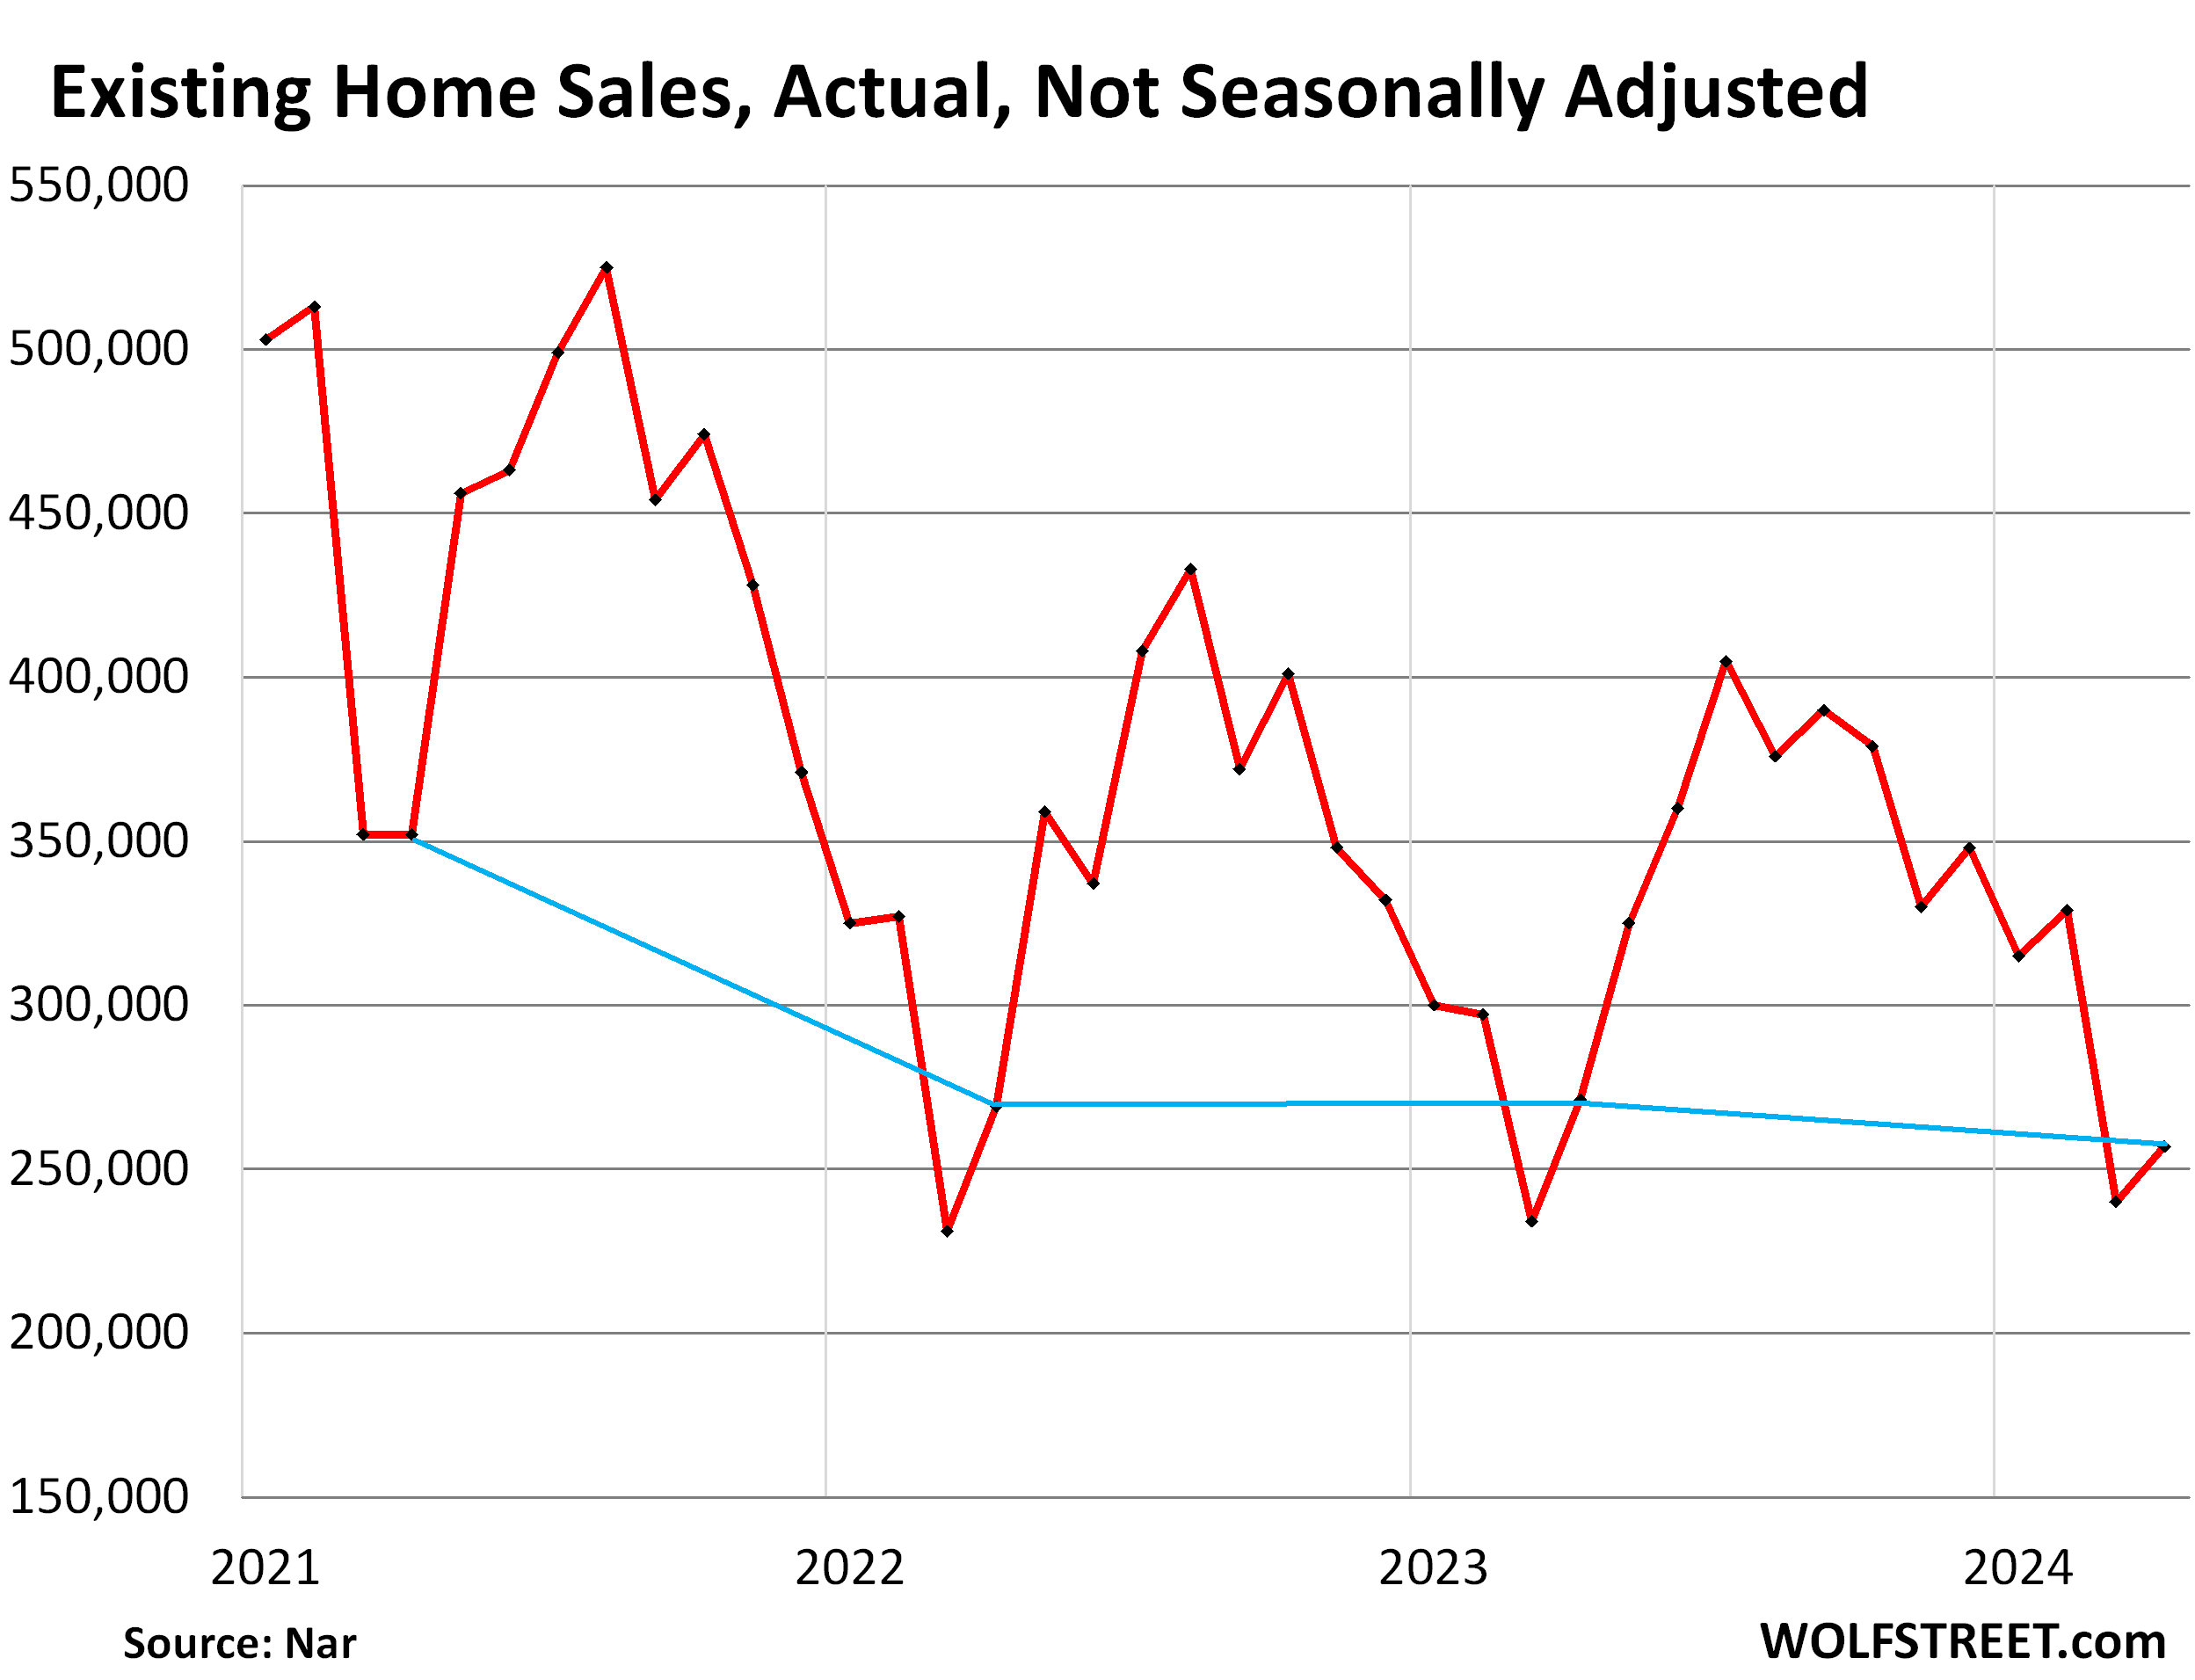
Sales of existing homes – single-family houses, townhouses, condos, and co-ops – that closed in February fell by 5.2% from the abysmally low levels a year ago to 257,000 deals, not seasonally adjusted, down by 27% from February 2022 when home sales began their free-fall after prices had spiked to ridiculous levels, thereby crushing demand.
The blue lines connect the Februarys.
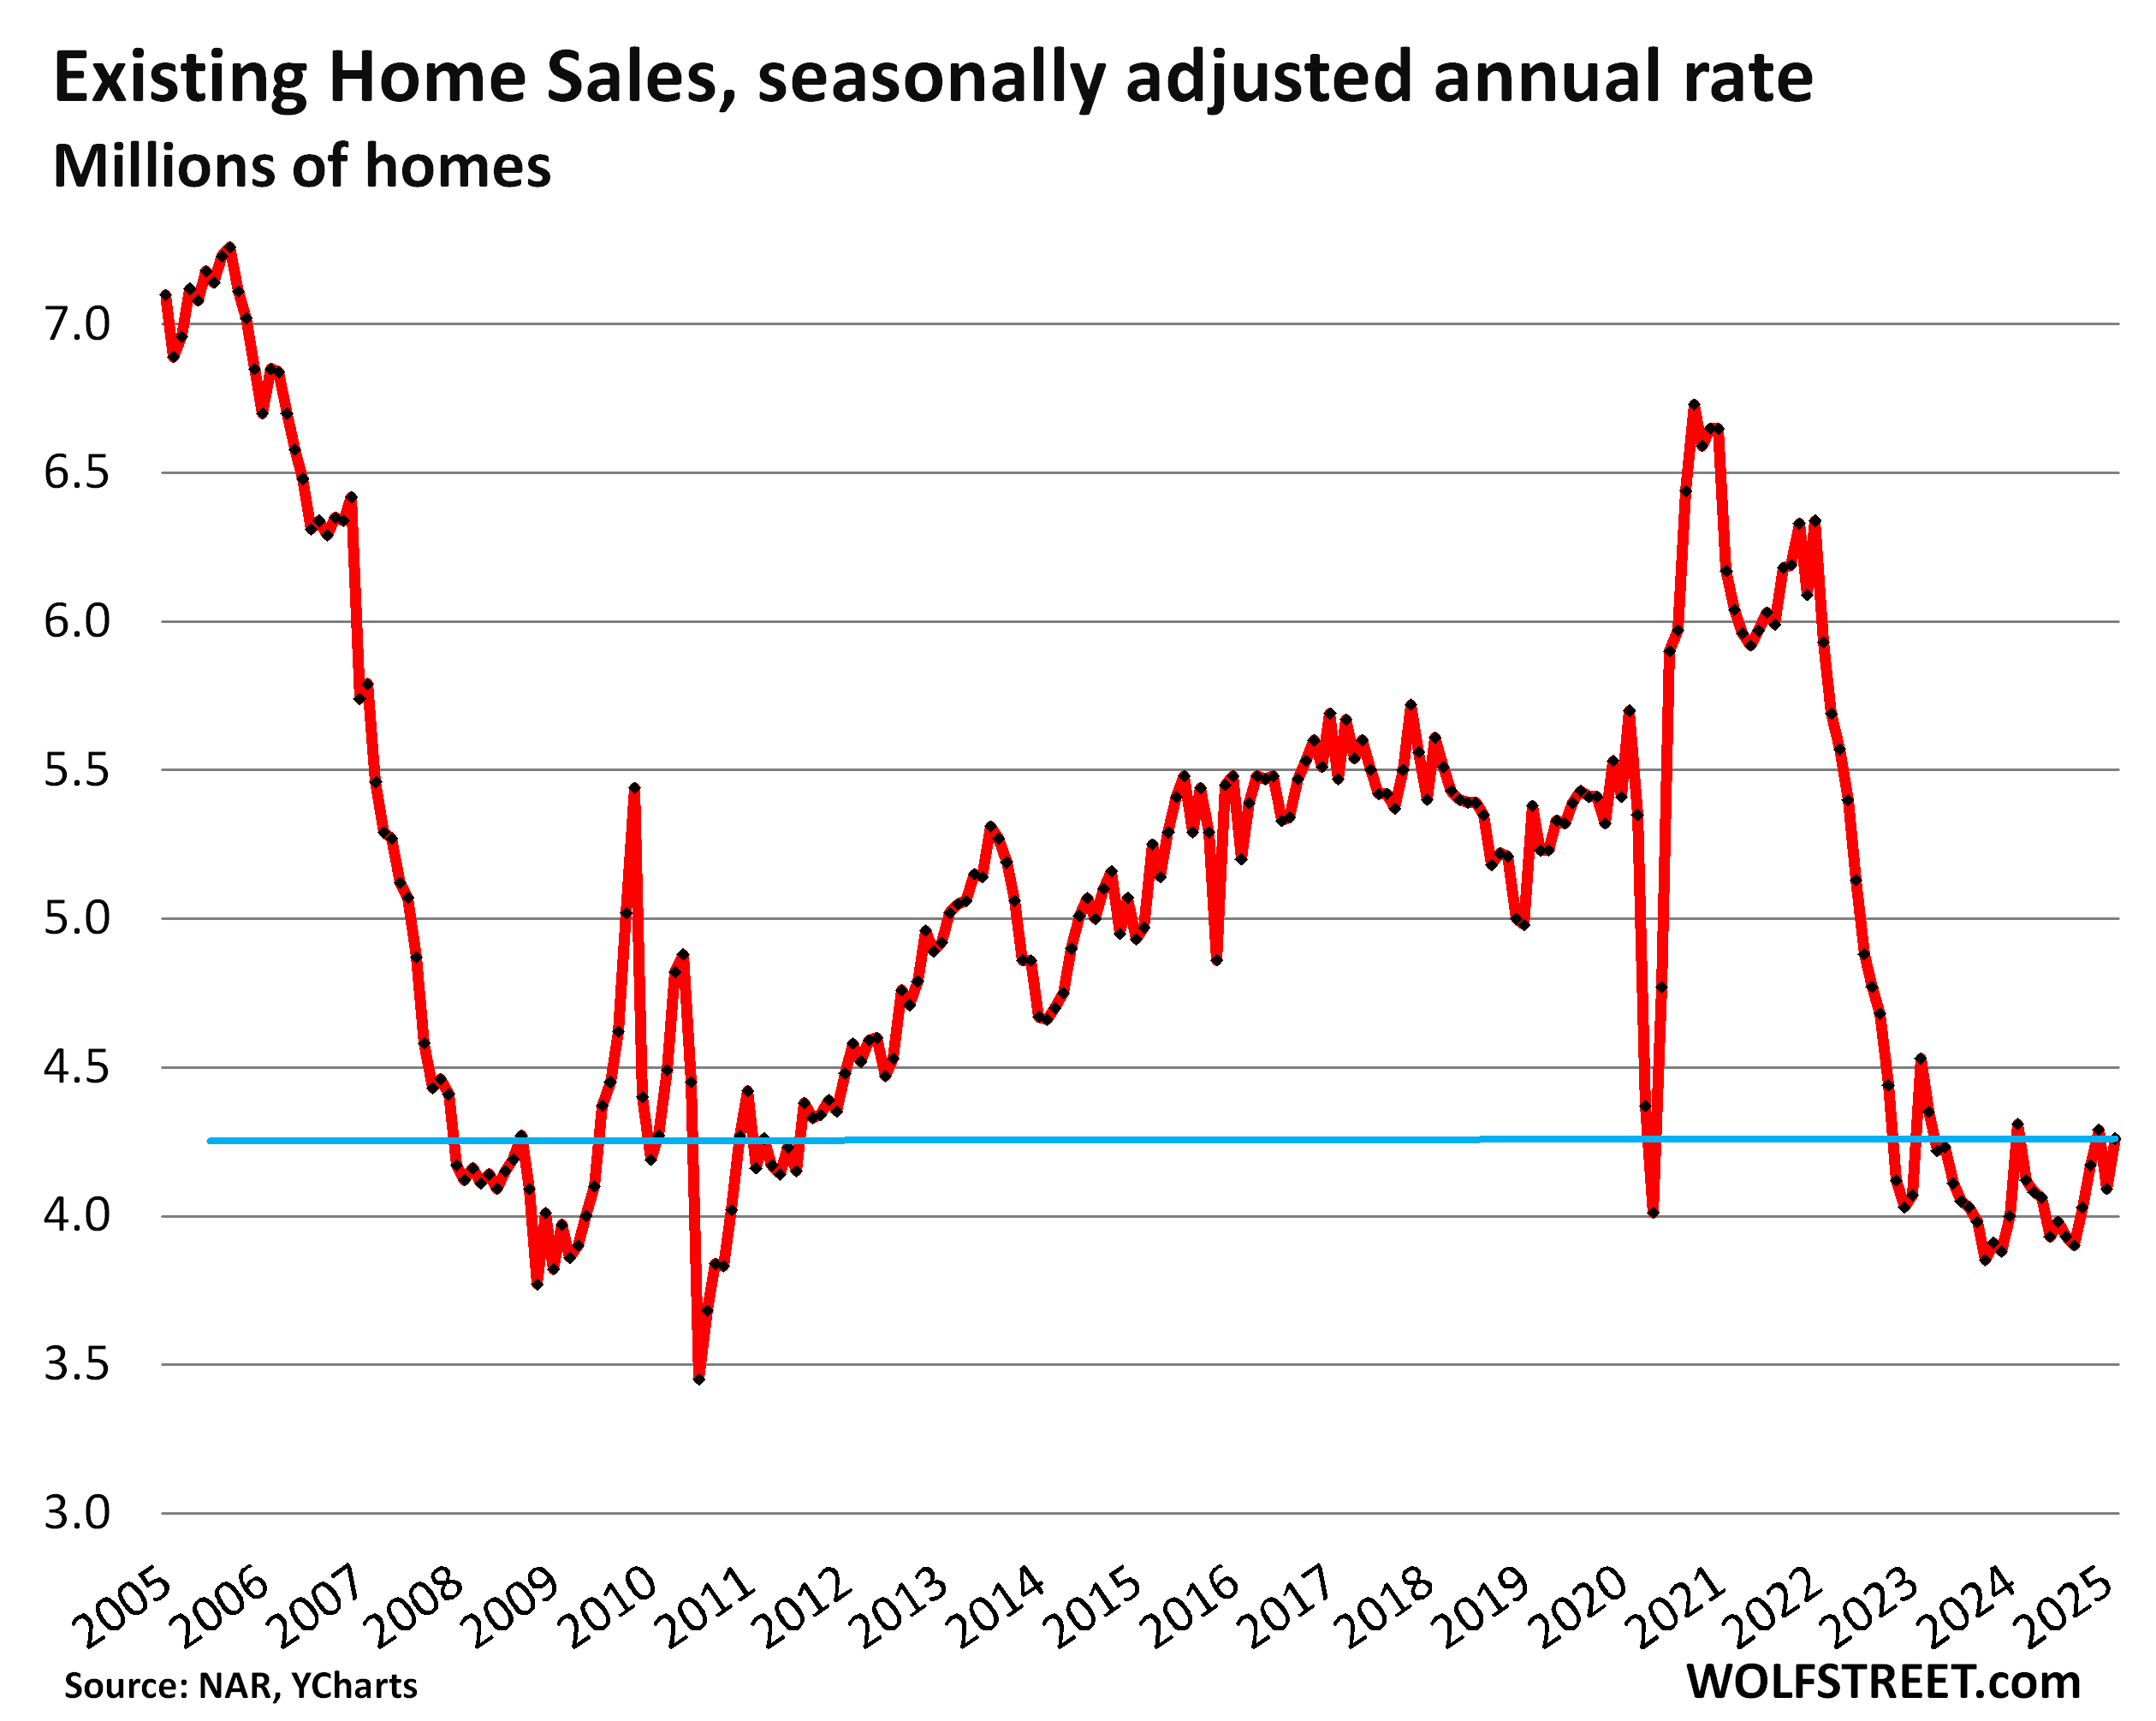
The seasonally adjusted annual rate of sales of existing homes, on a month-to-month basis, ticked up to a rate of 4.26 million, the worst February since February 2009.
From the Februarys in prior years (historical data from YCharts):
- 2024: -1.2%
- 2023: -6.0%
- 2022: -28.2%
- 2019: -20.8%
- 2018: -24.1%
Demand destruction by region.
The charts below show the seasonally adjusted annual rate of sales (SAAR) in the four Census Regions of the US. A map of the four regions is in the comments below the article.
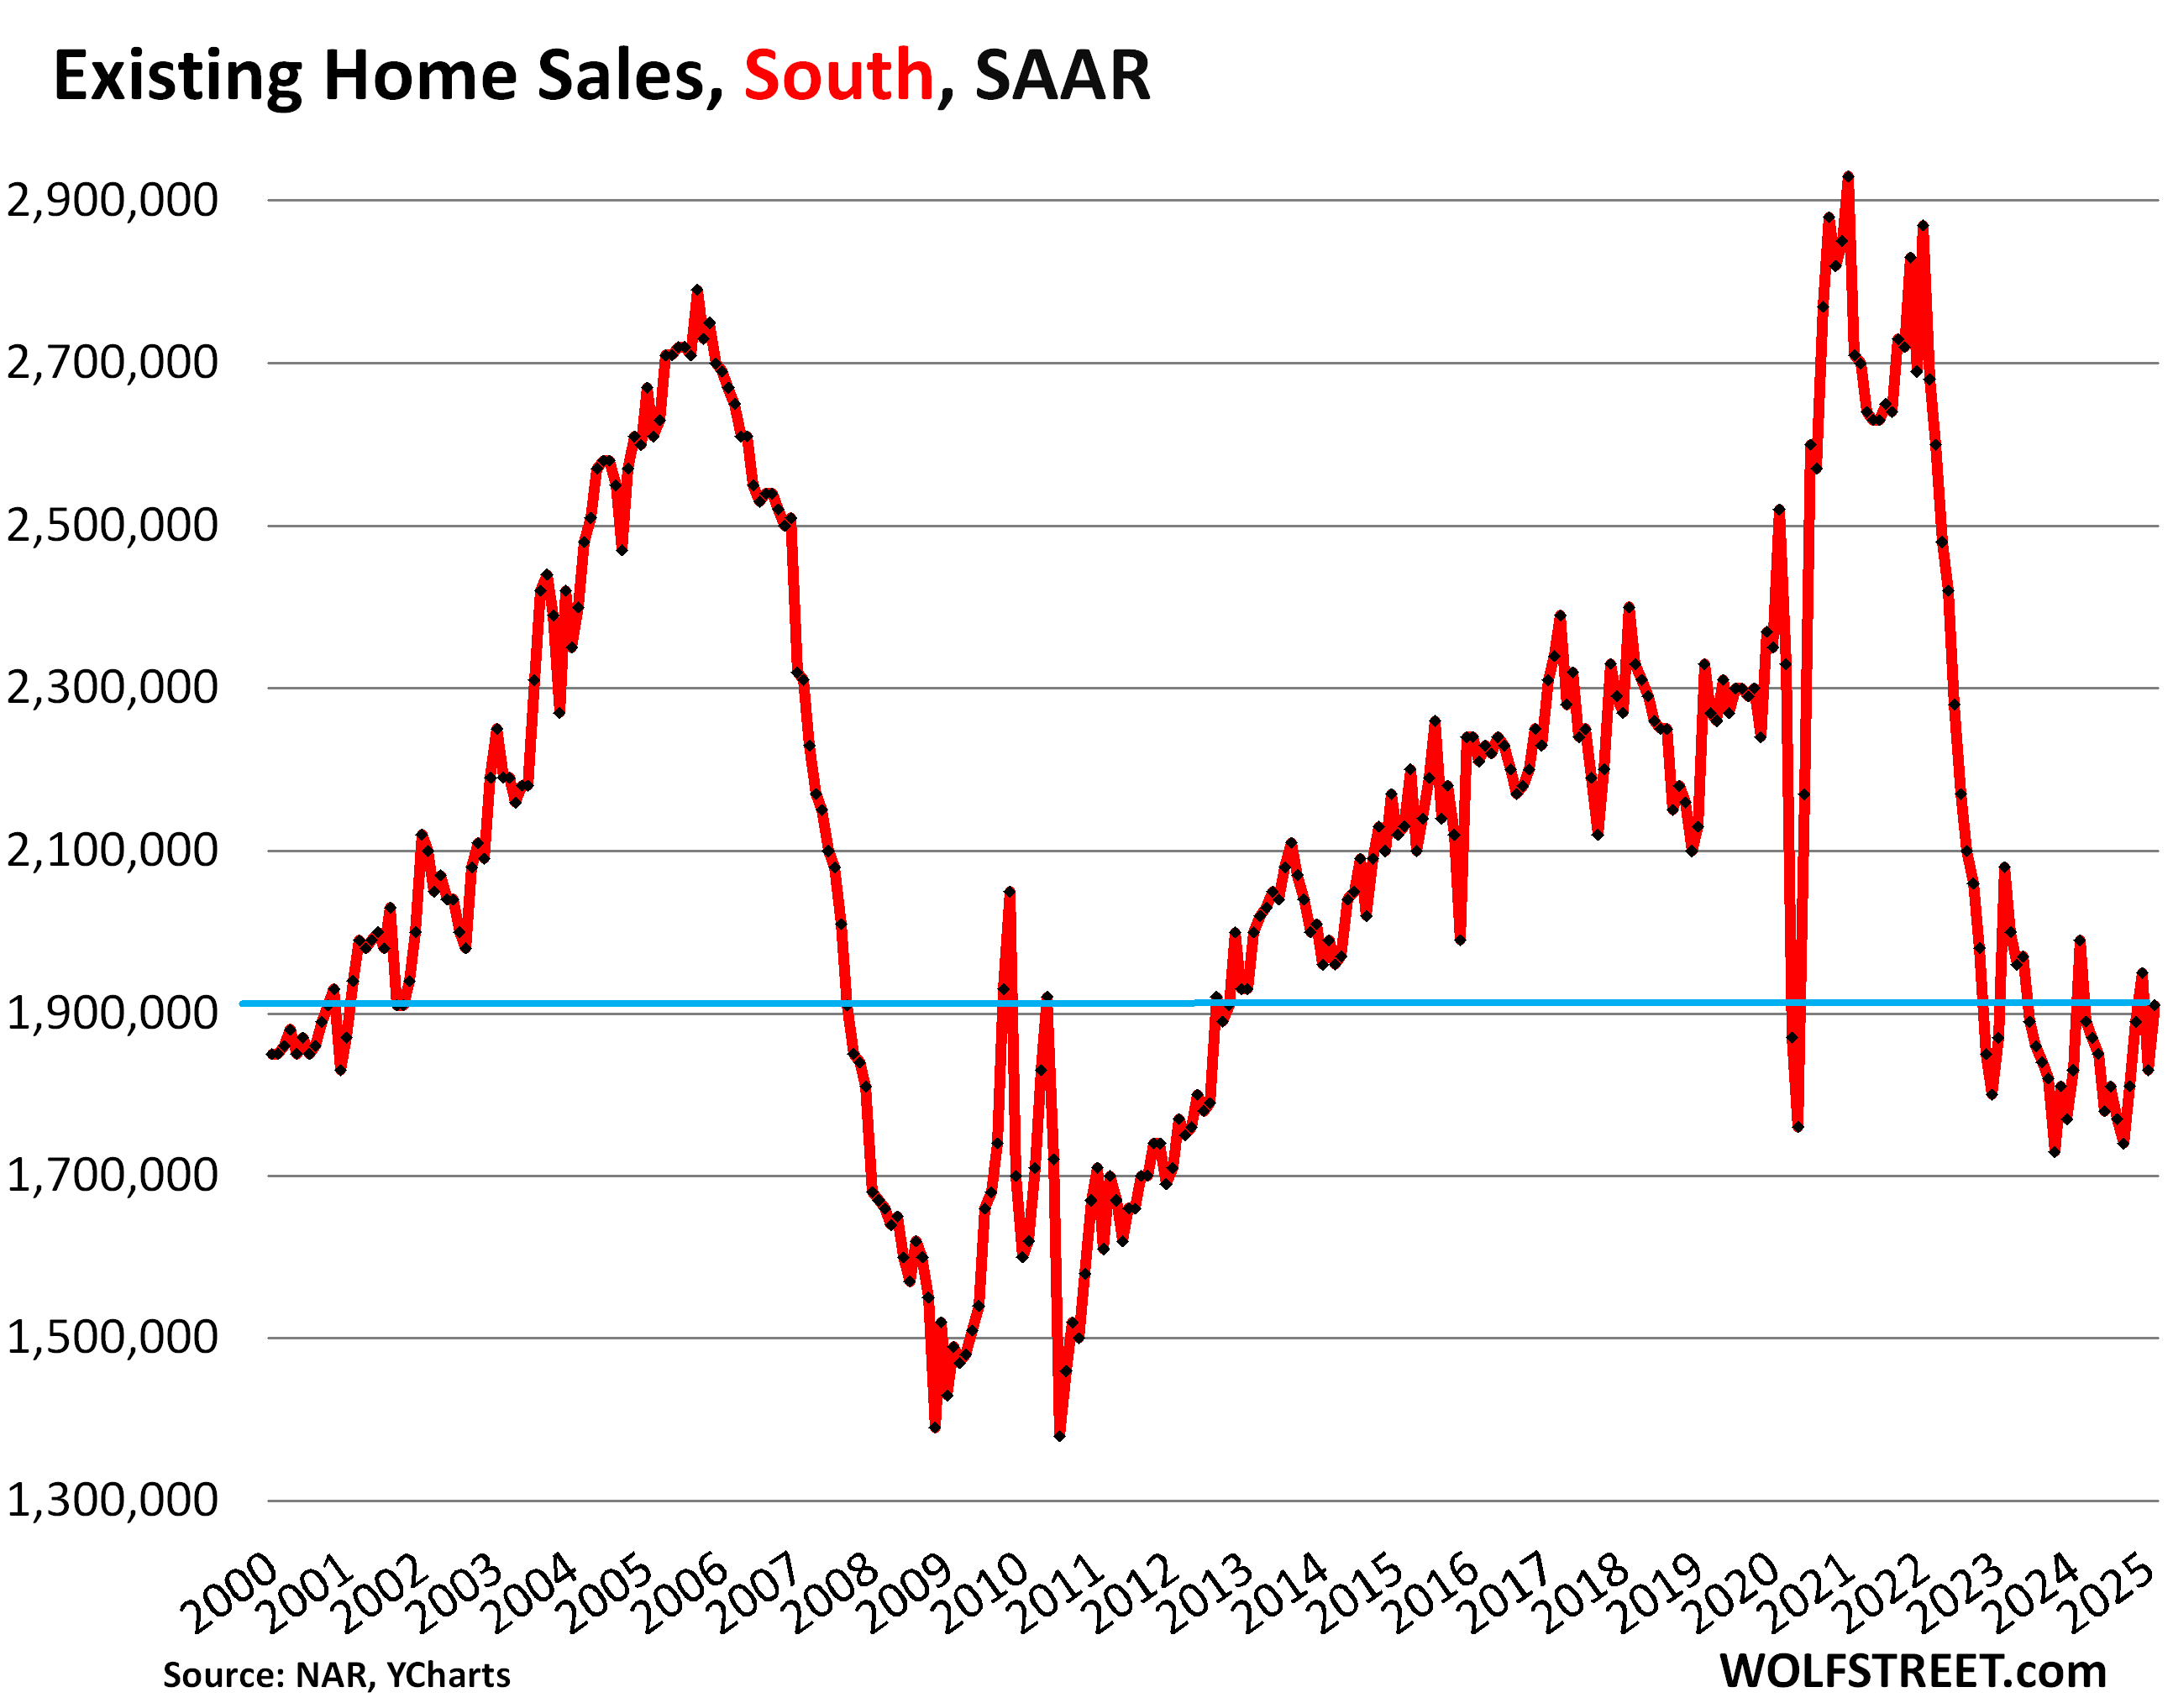
In the South, the seasonally adjusted annual rate of sales rose to 1,190,000 homes, the worst February since 2011. From Februarys in:
| 2024 | -4.0% |
| 2023 | -8.2% |
| 2022 | -28.7% |
| 2019 | -18.0% |
| 2018 | -15.9% |
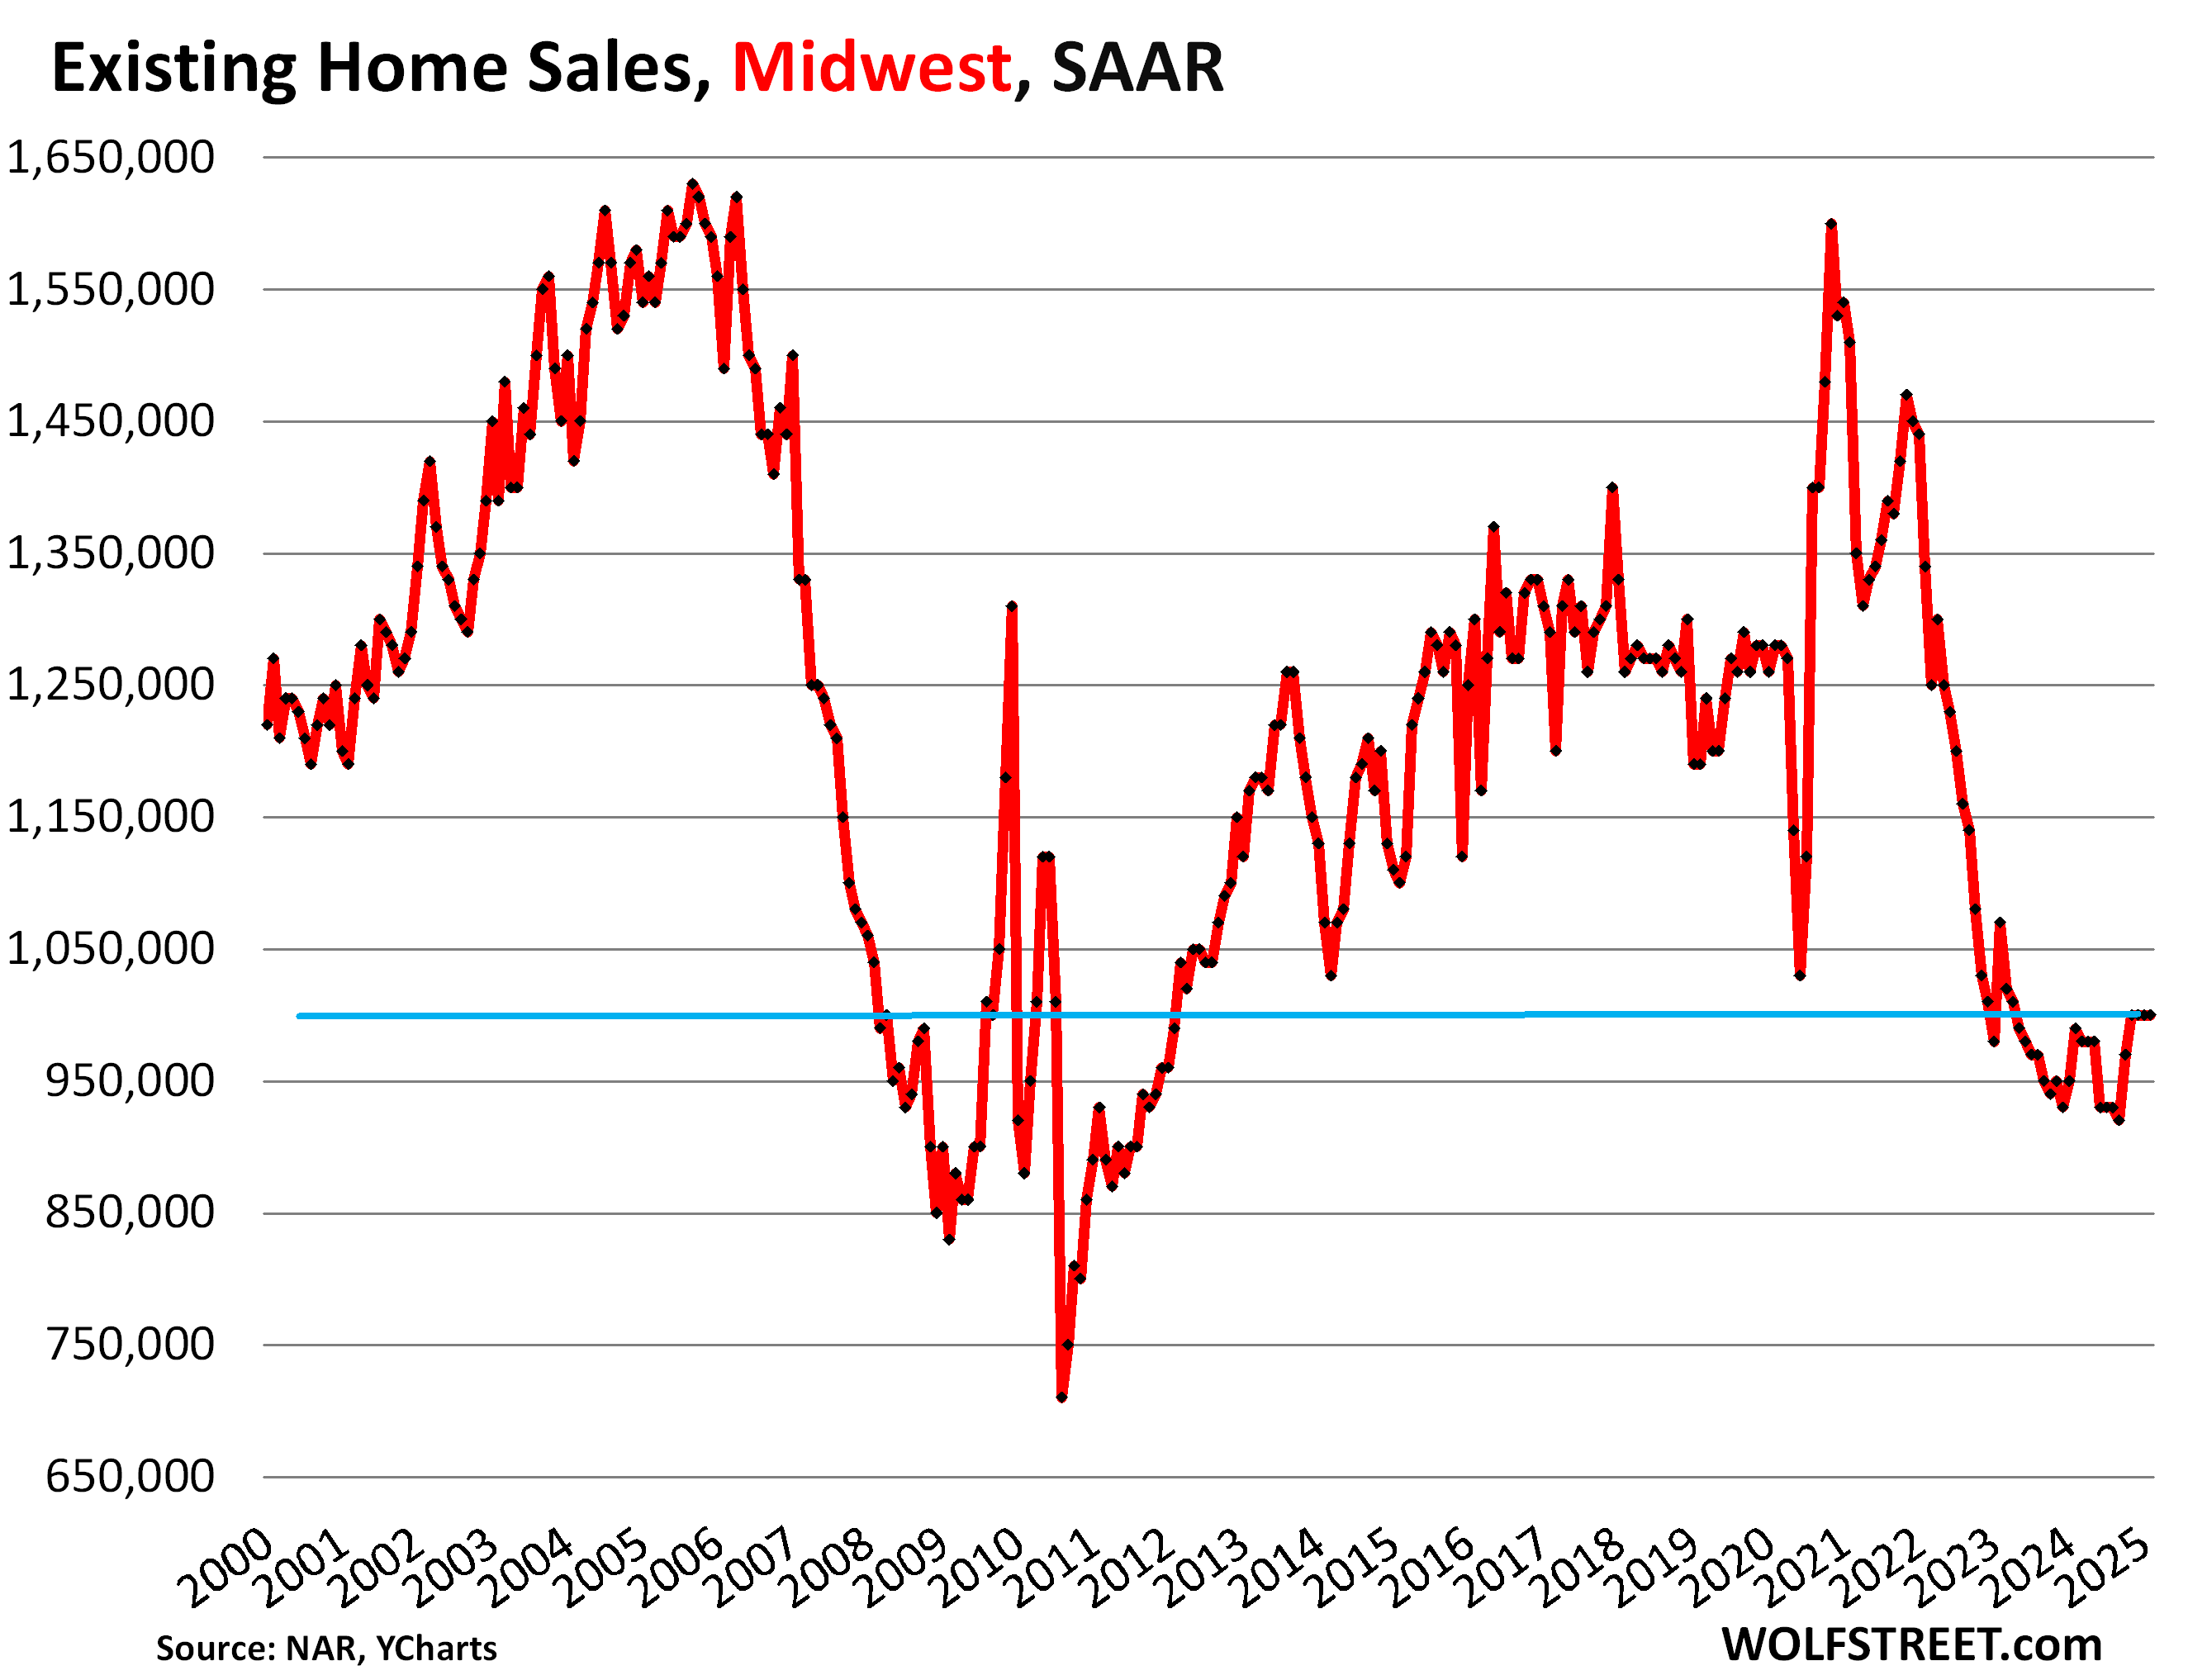
In the Midwest, the seasonally adjusted annual rate of sales remained at 1,000,000 homes. From Februarys in:
| 2024 | +1.0% |
| 2023 | -6.5% |
| 2022 | -25.4% |
| 2019 | -16.0% |
| 2018 | -24.8% |
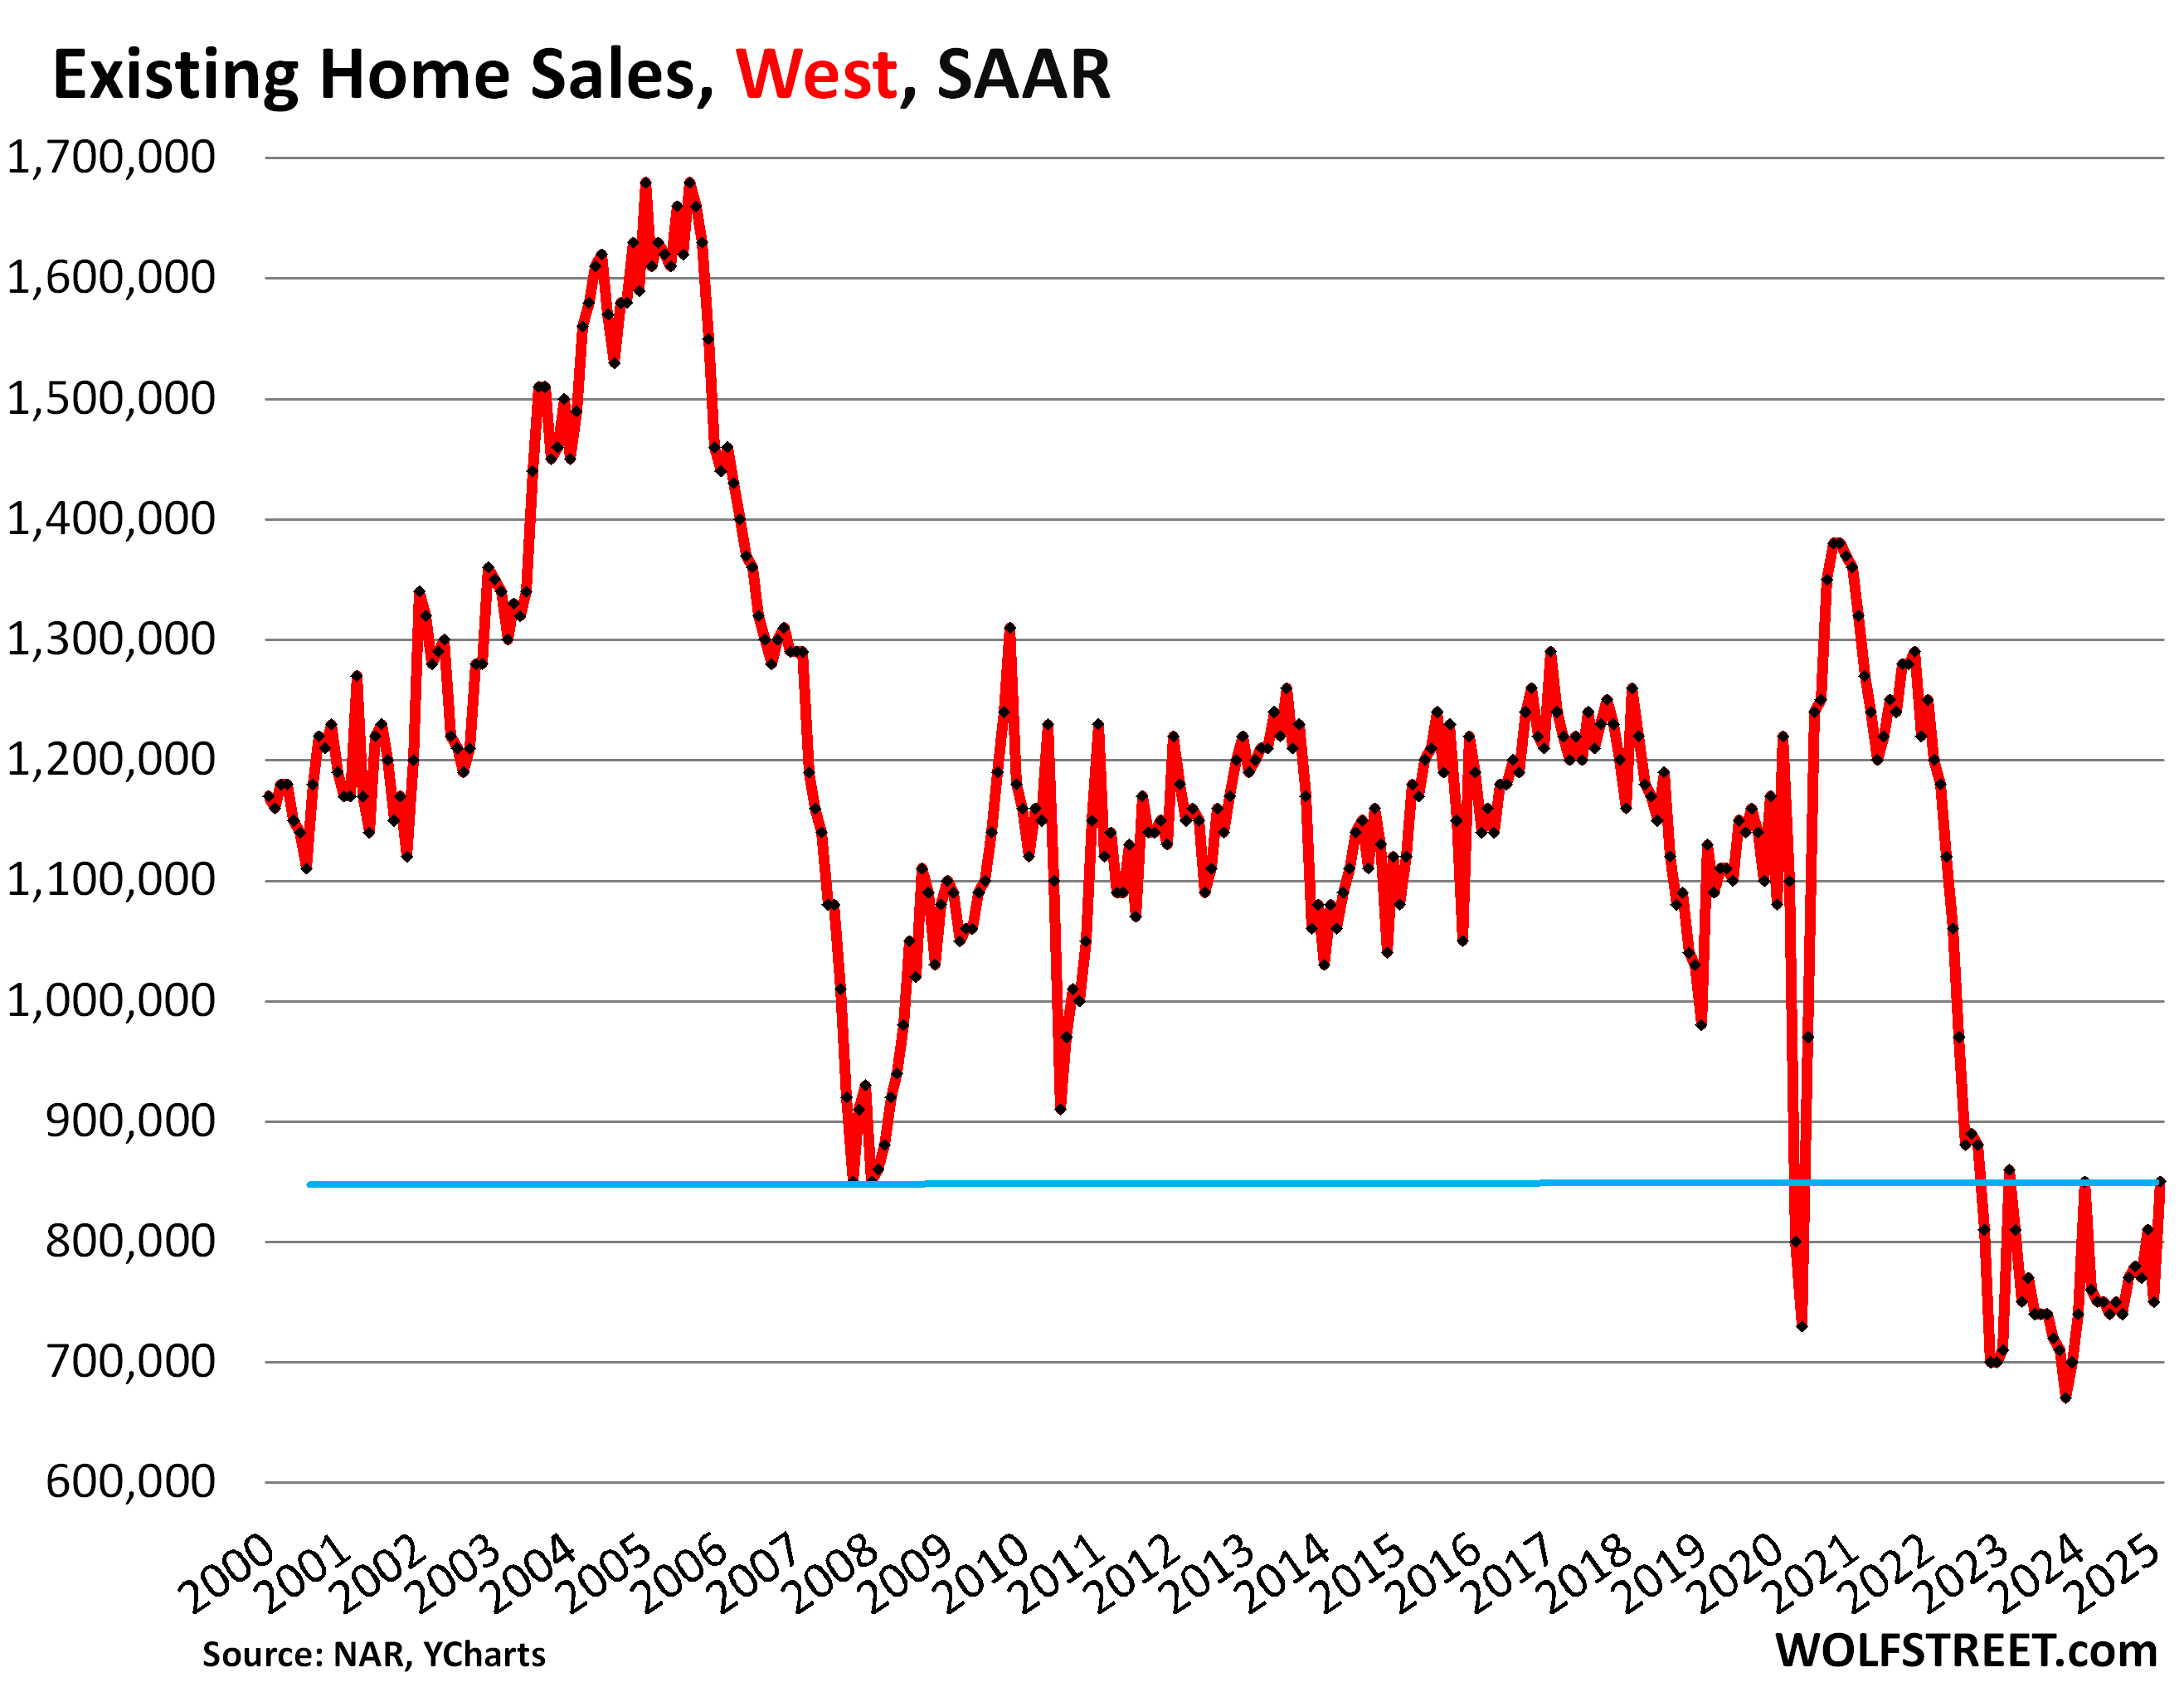
In the West, the seasonally adjusted annual rate of sales rose to 850,000. From Februarys in:
| 2024 | 0.0% |
| 2023 | -1.2% |
| 2022 | -29.2% |
| 2019 | -24.8% |
| 2018 | -26.7% |
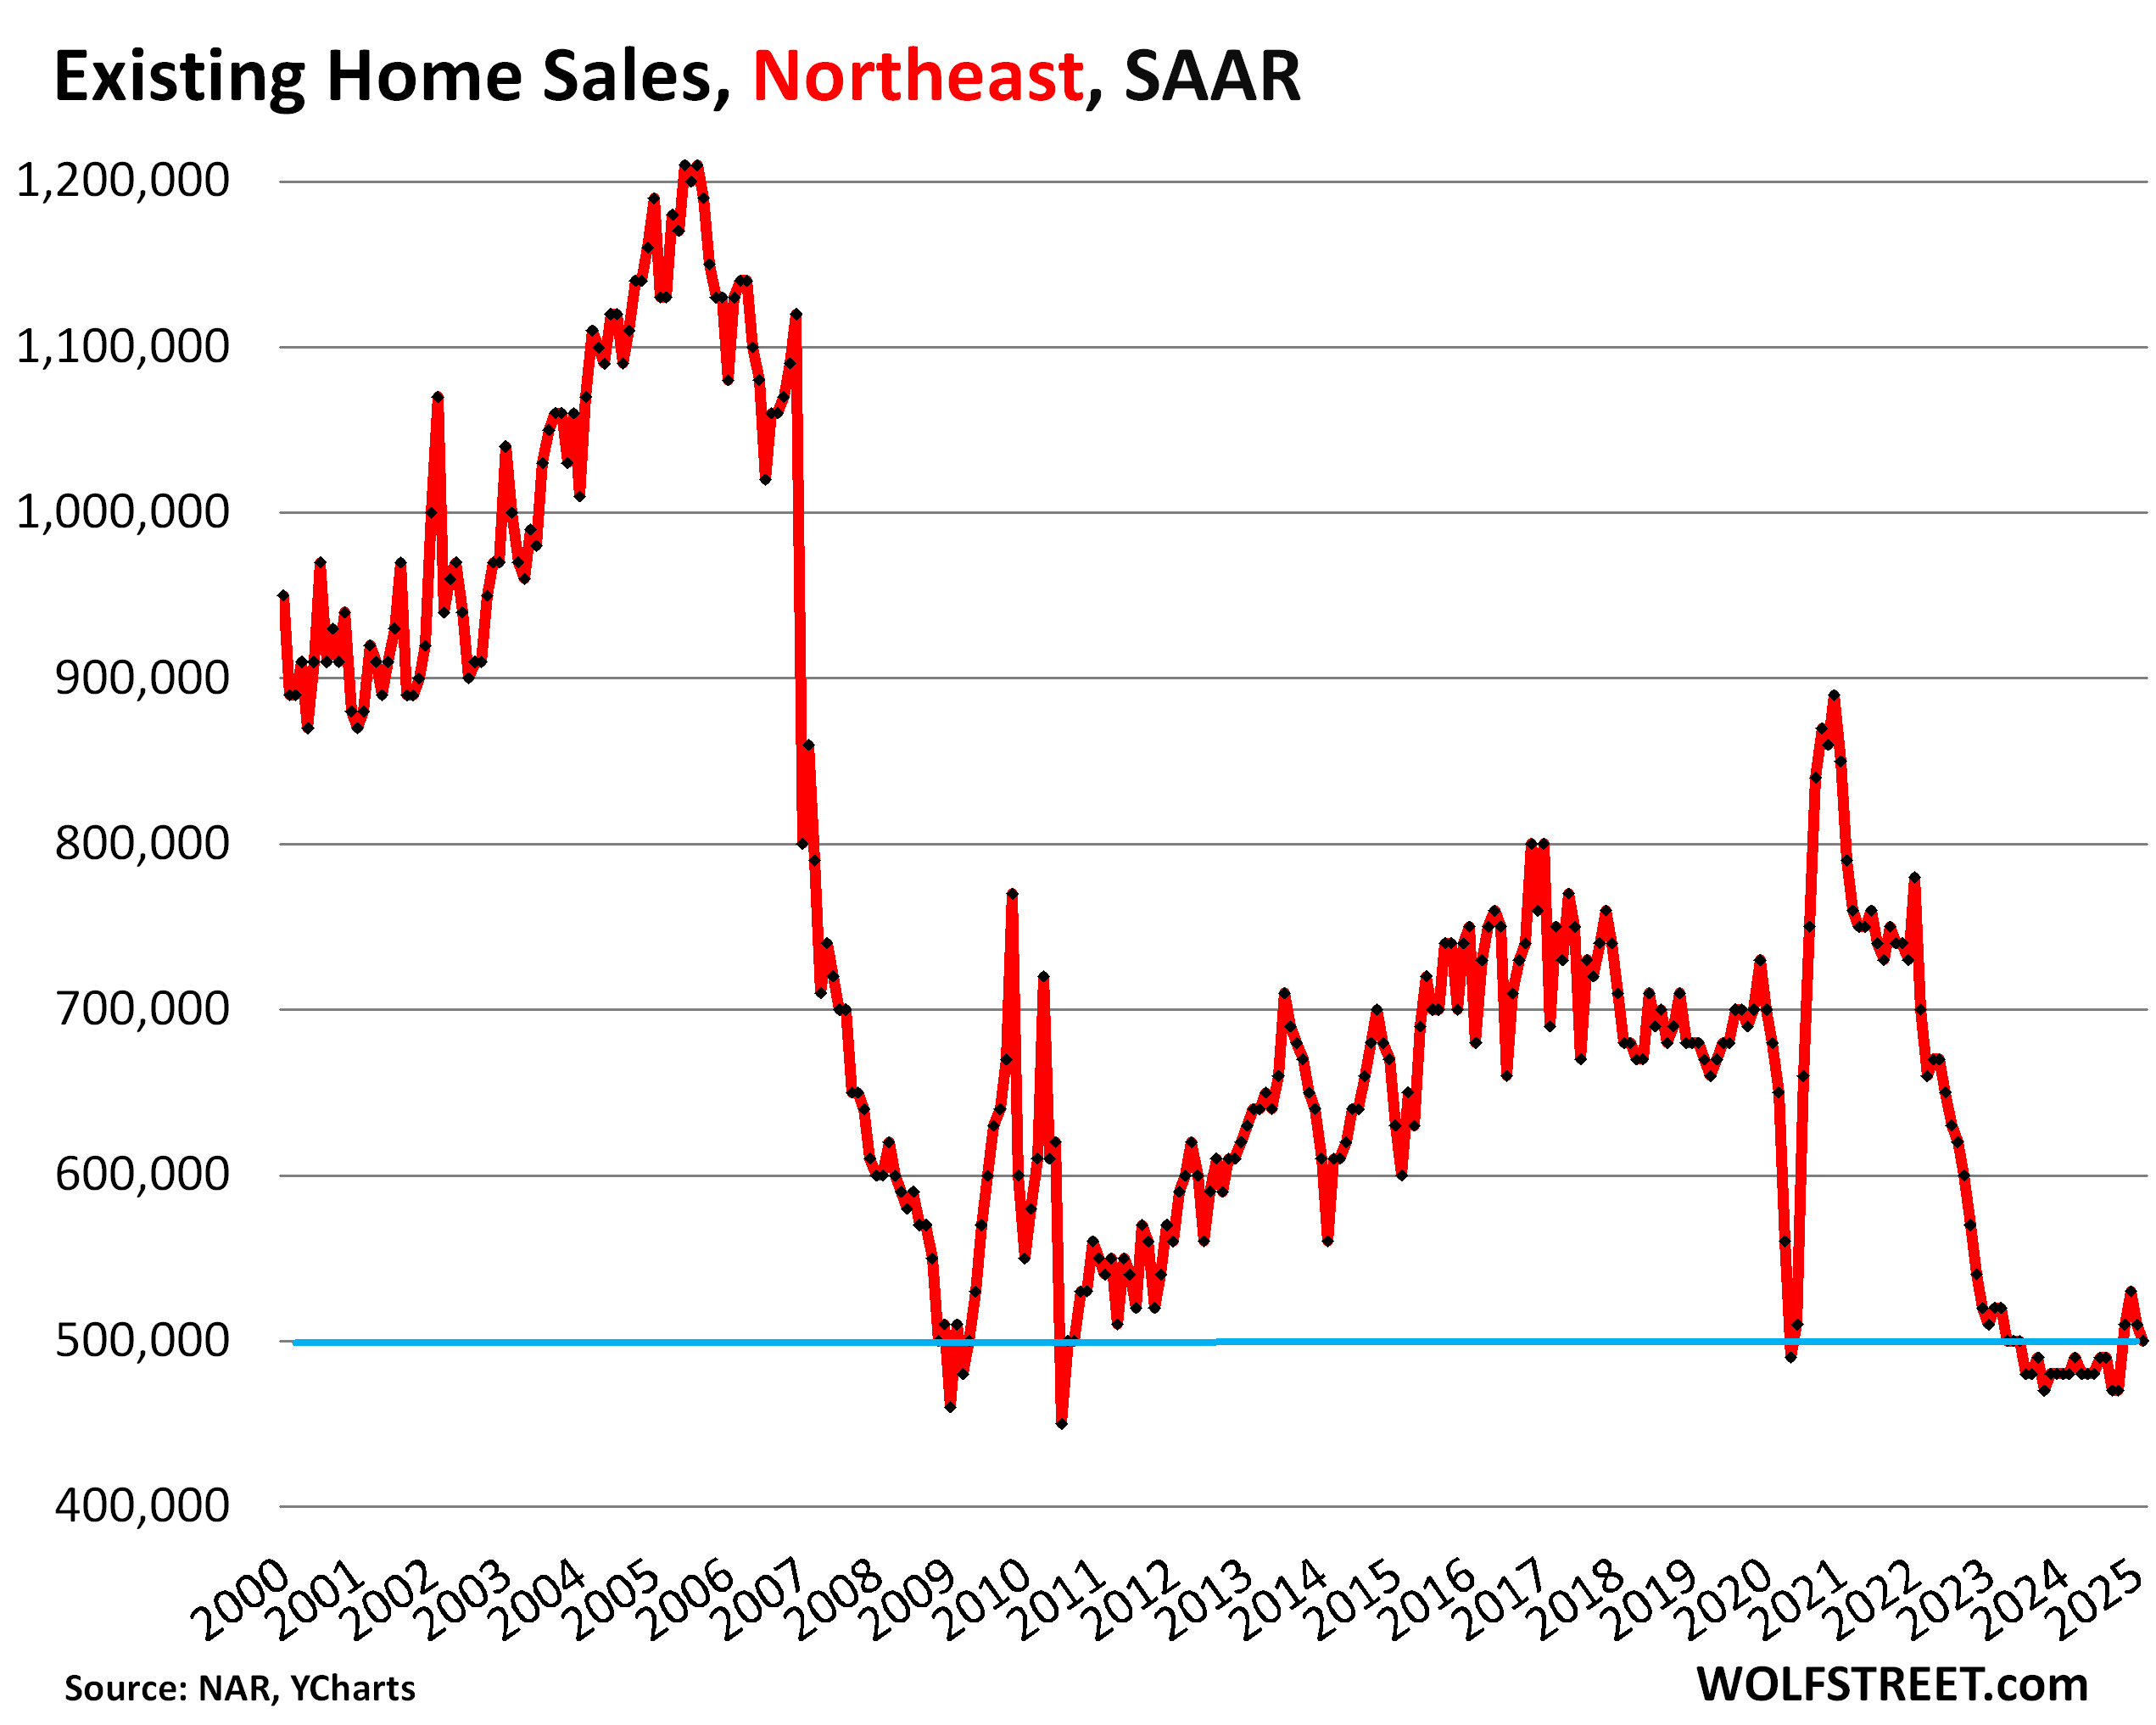
In the Northeast, the seasonally adjusted annual rate of sales fell to 500,000 homes. From Februarys in:
| 2024 | +4.2% |
| 2023 | -3.8% |
| 2022 | -28.6% |
| 2019 | -26.5% |
| 2018 | -29.6% |
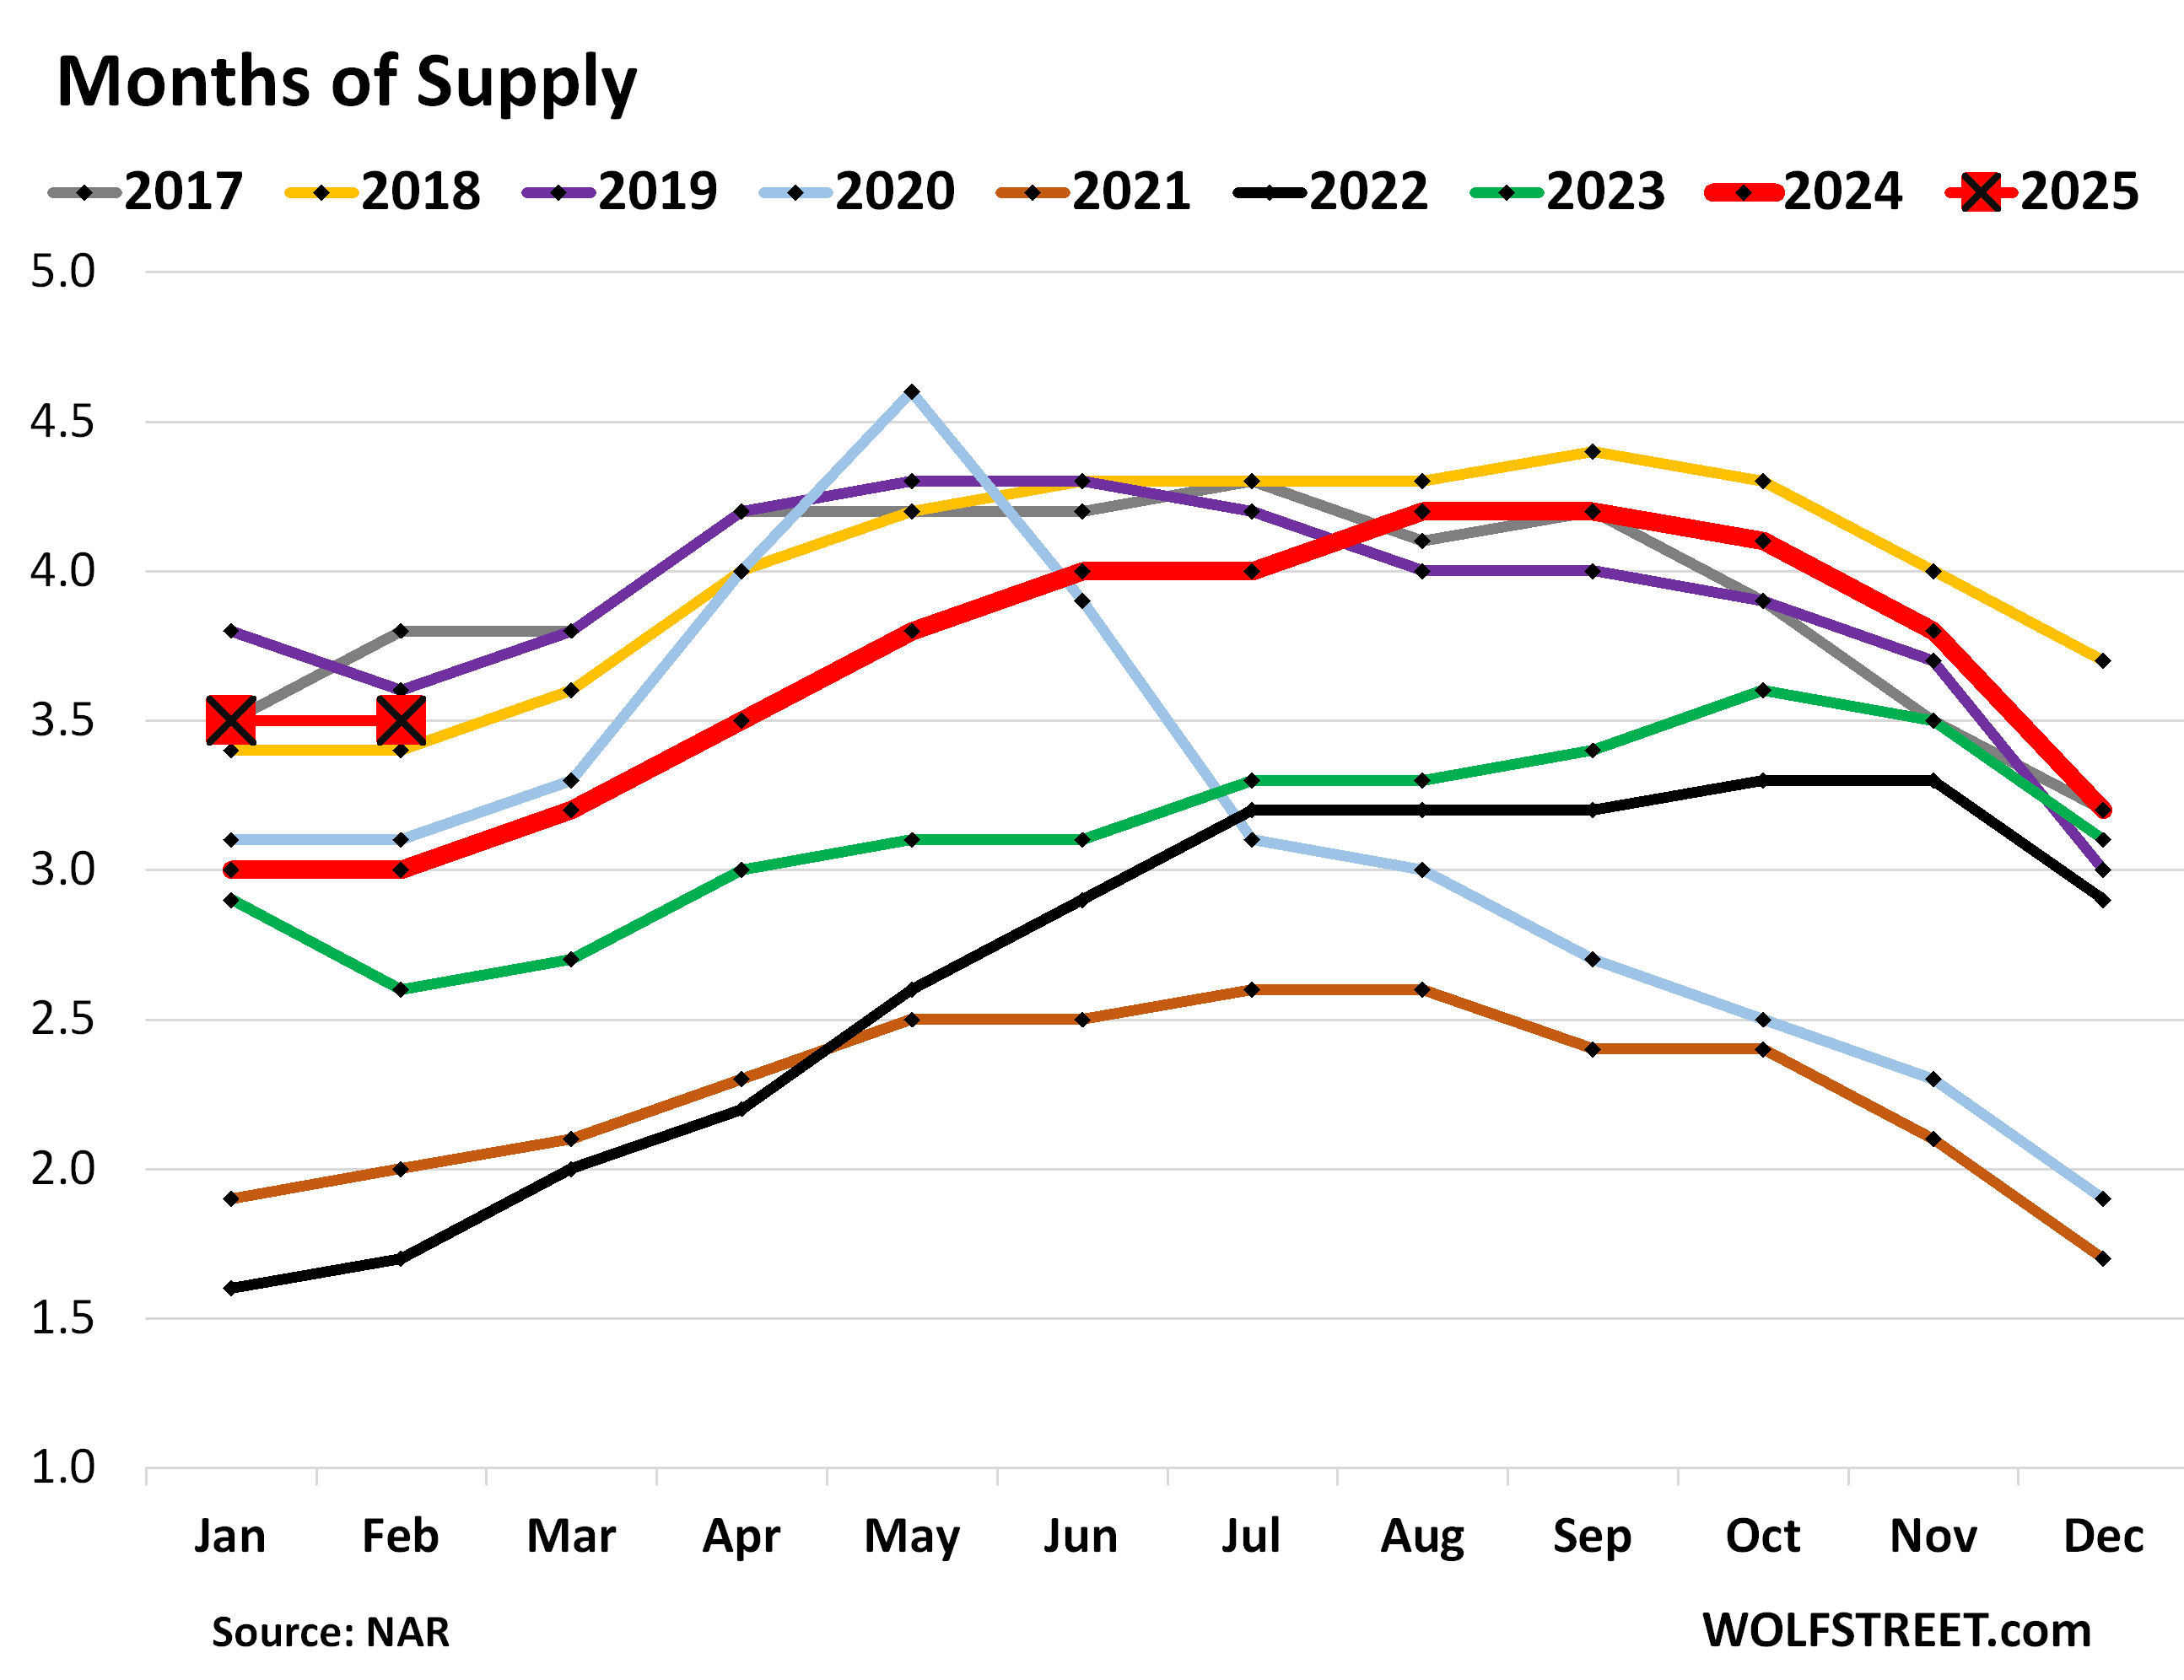
Highest supply for February since 2019, higher than 2018.
Inventory of homes listed for sale rose by 60,000 in February, to 1.24 million, and was up by 17% from a year ago.
At these inventories, supply of unsold homes on the market remained at 3.5 months in February, the highest February supply since 2019 (3.6 months), higher than February 2018 (3.4 months). The months of 2025 are shown as the red squares.
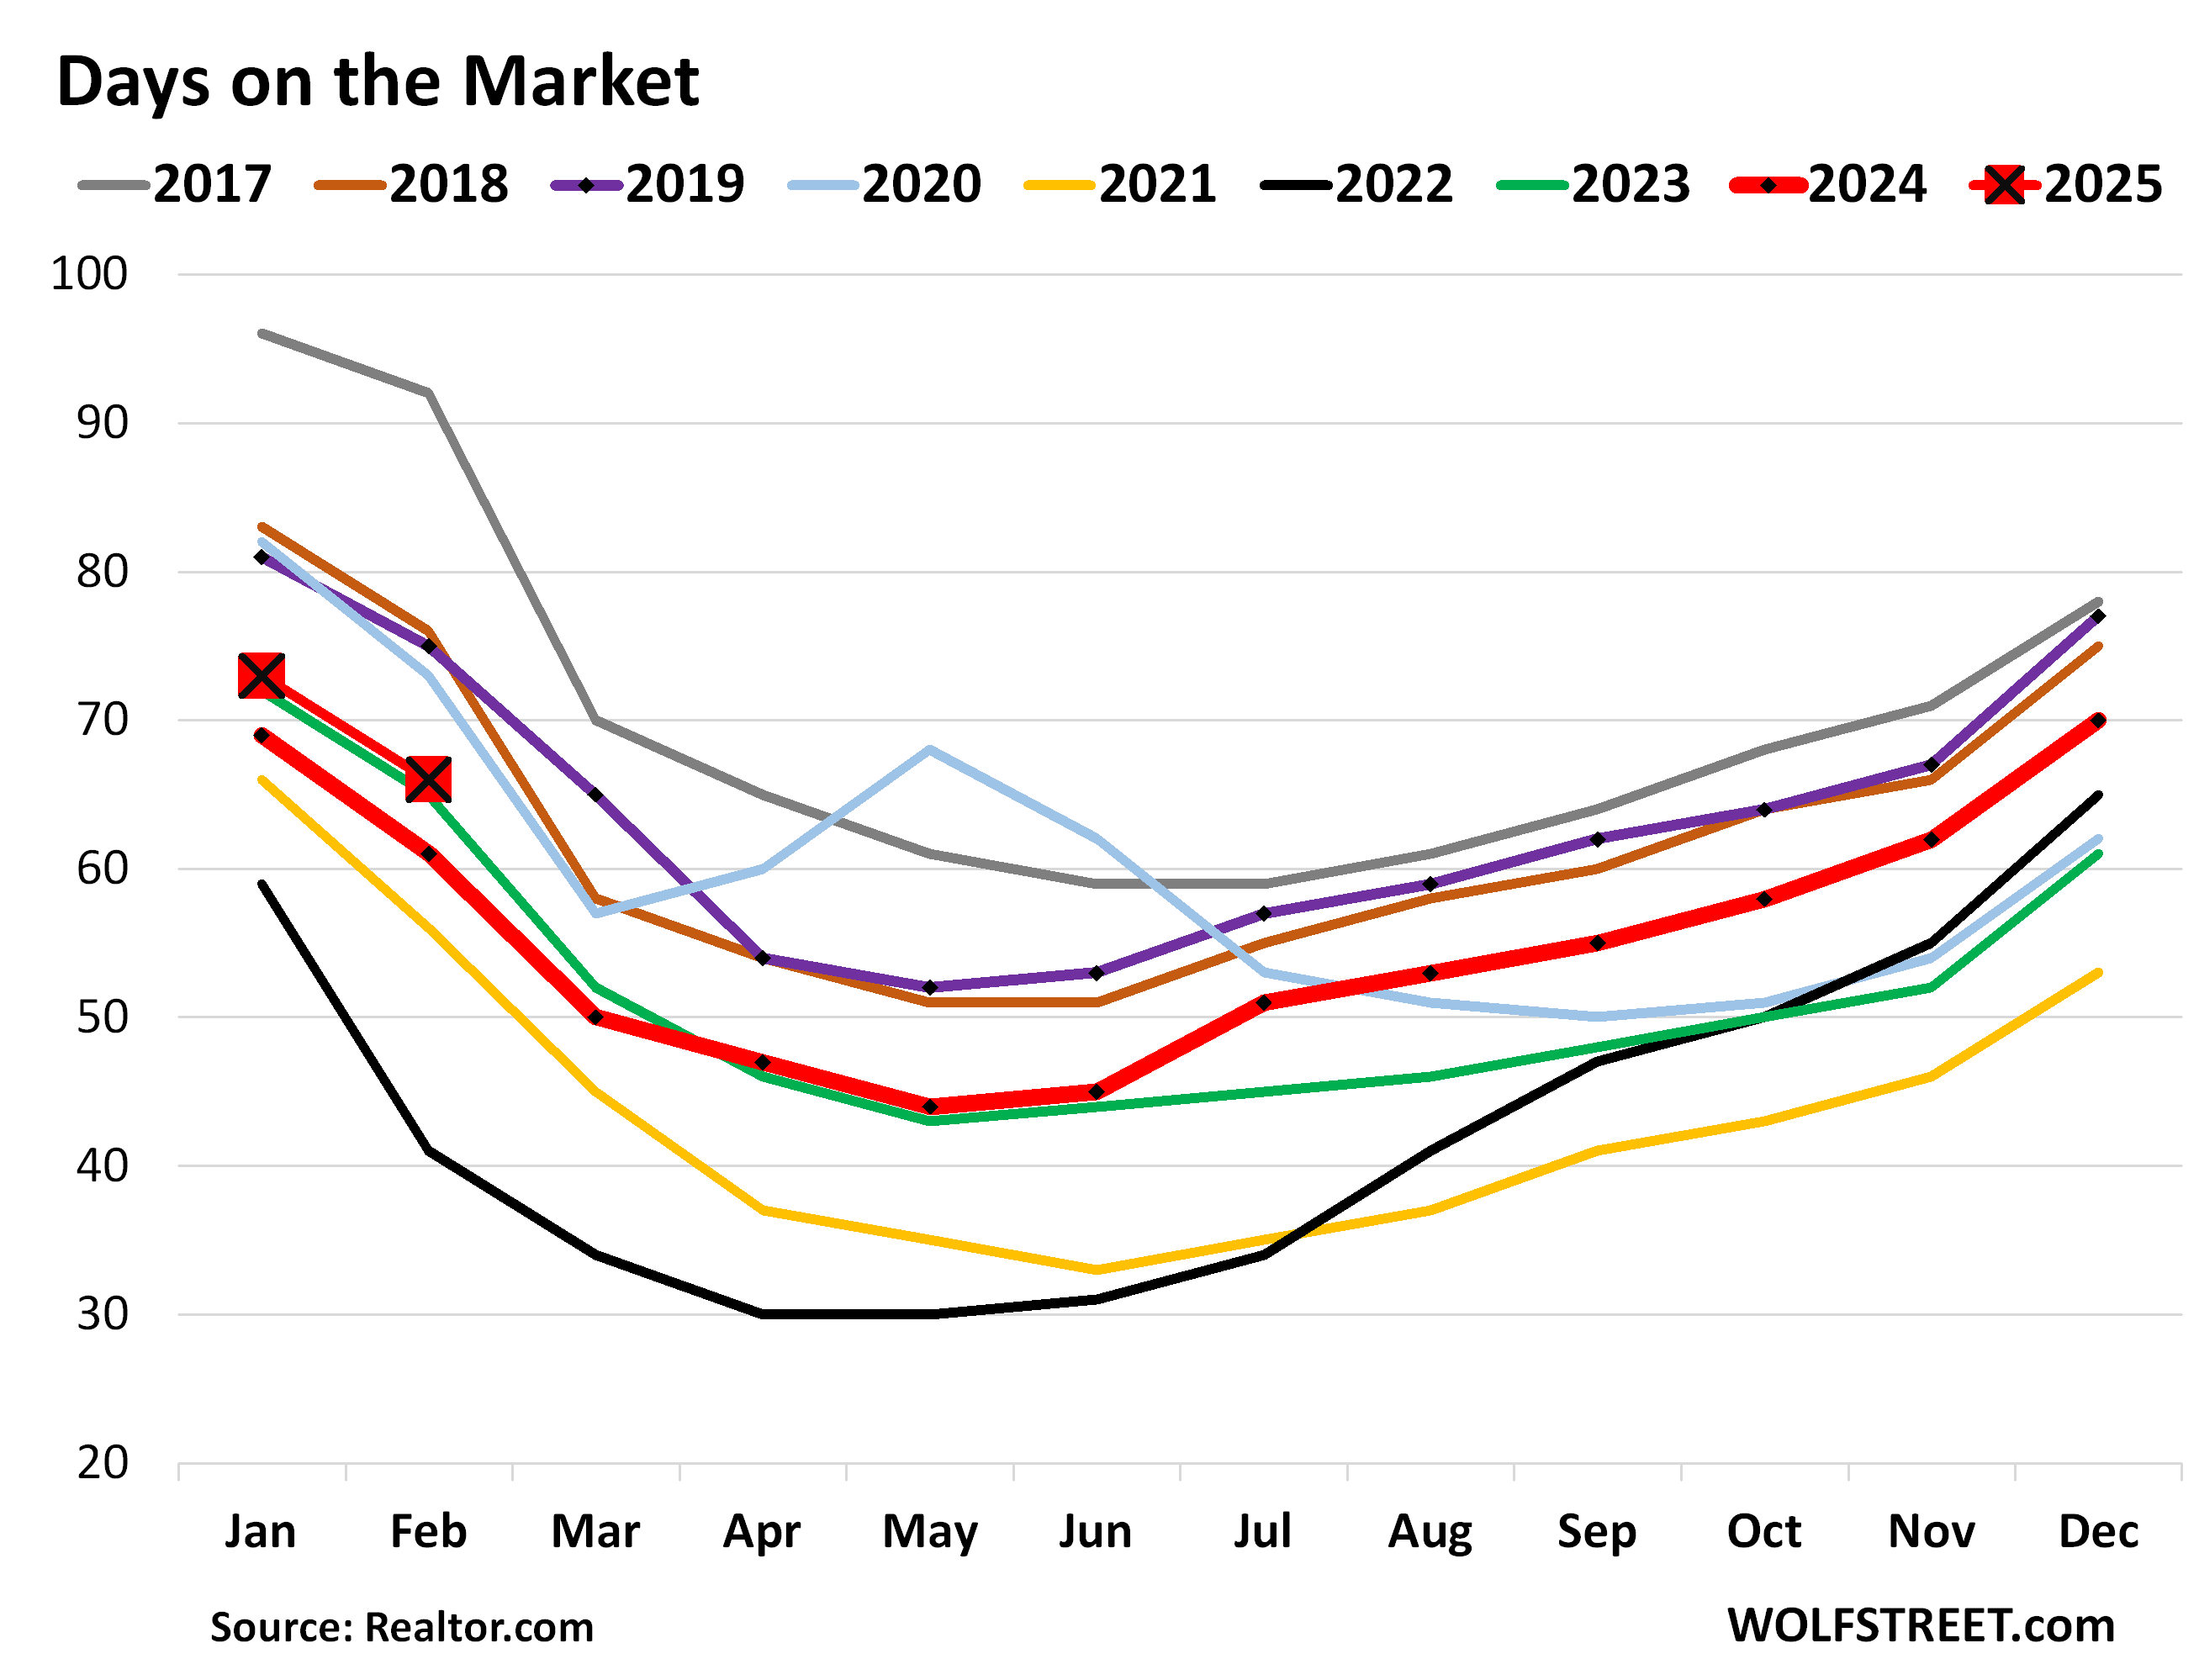
Days on the market.
The median number of days before the home is either sold or pulled off the market because it failed to sell, at 66 days, was the highest for any February since 2020, and up from 61 days a year ago, according to Realtor.com.
Days on the market show the mix of two factors: How motivated sellers are by letting their homes sit on the market when it doesn’t sell right away before they pull it, and how quickly homes sell that do sell.
Median price for single-family houses and condos.
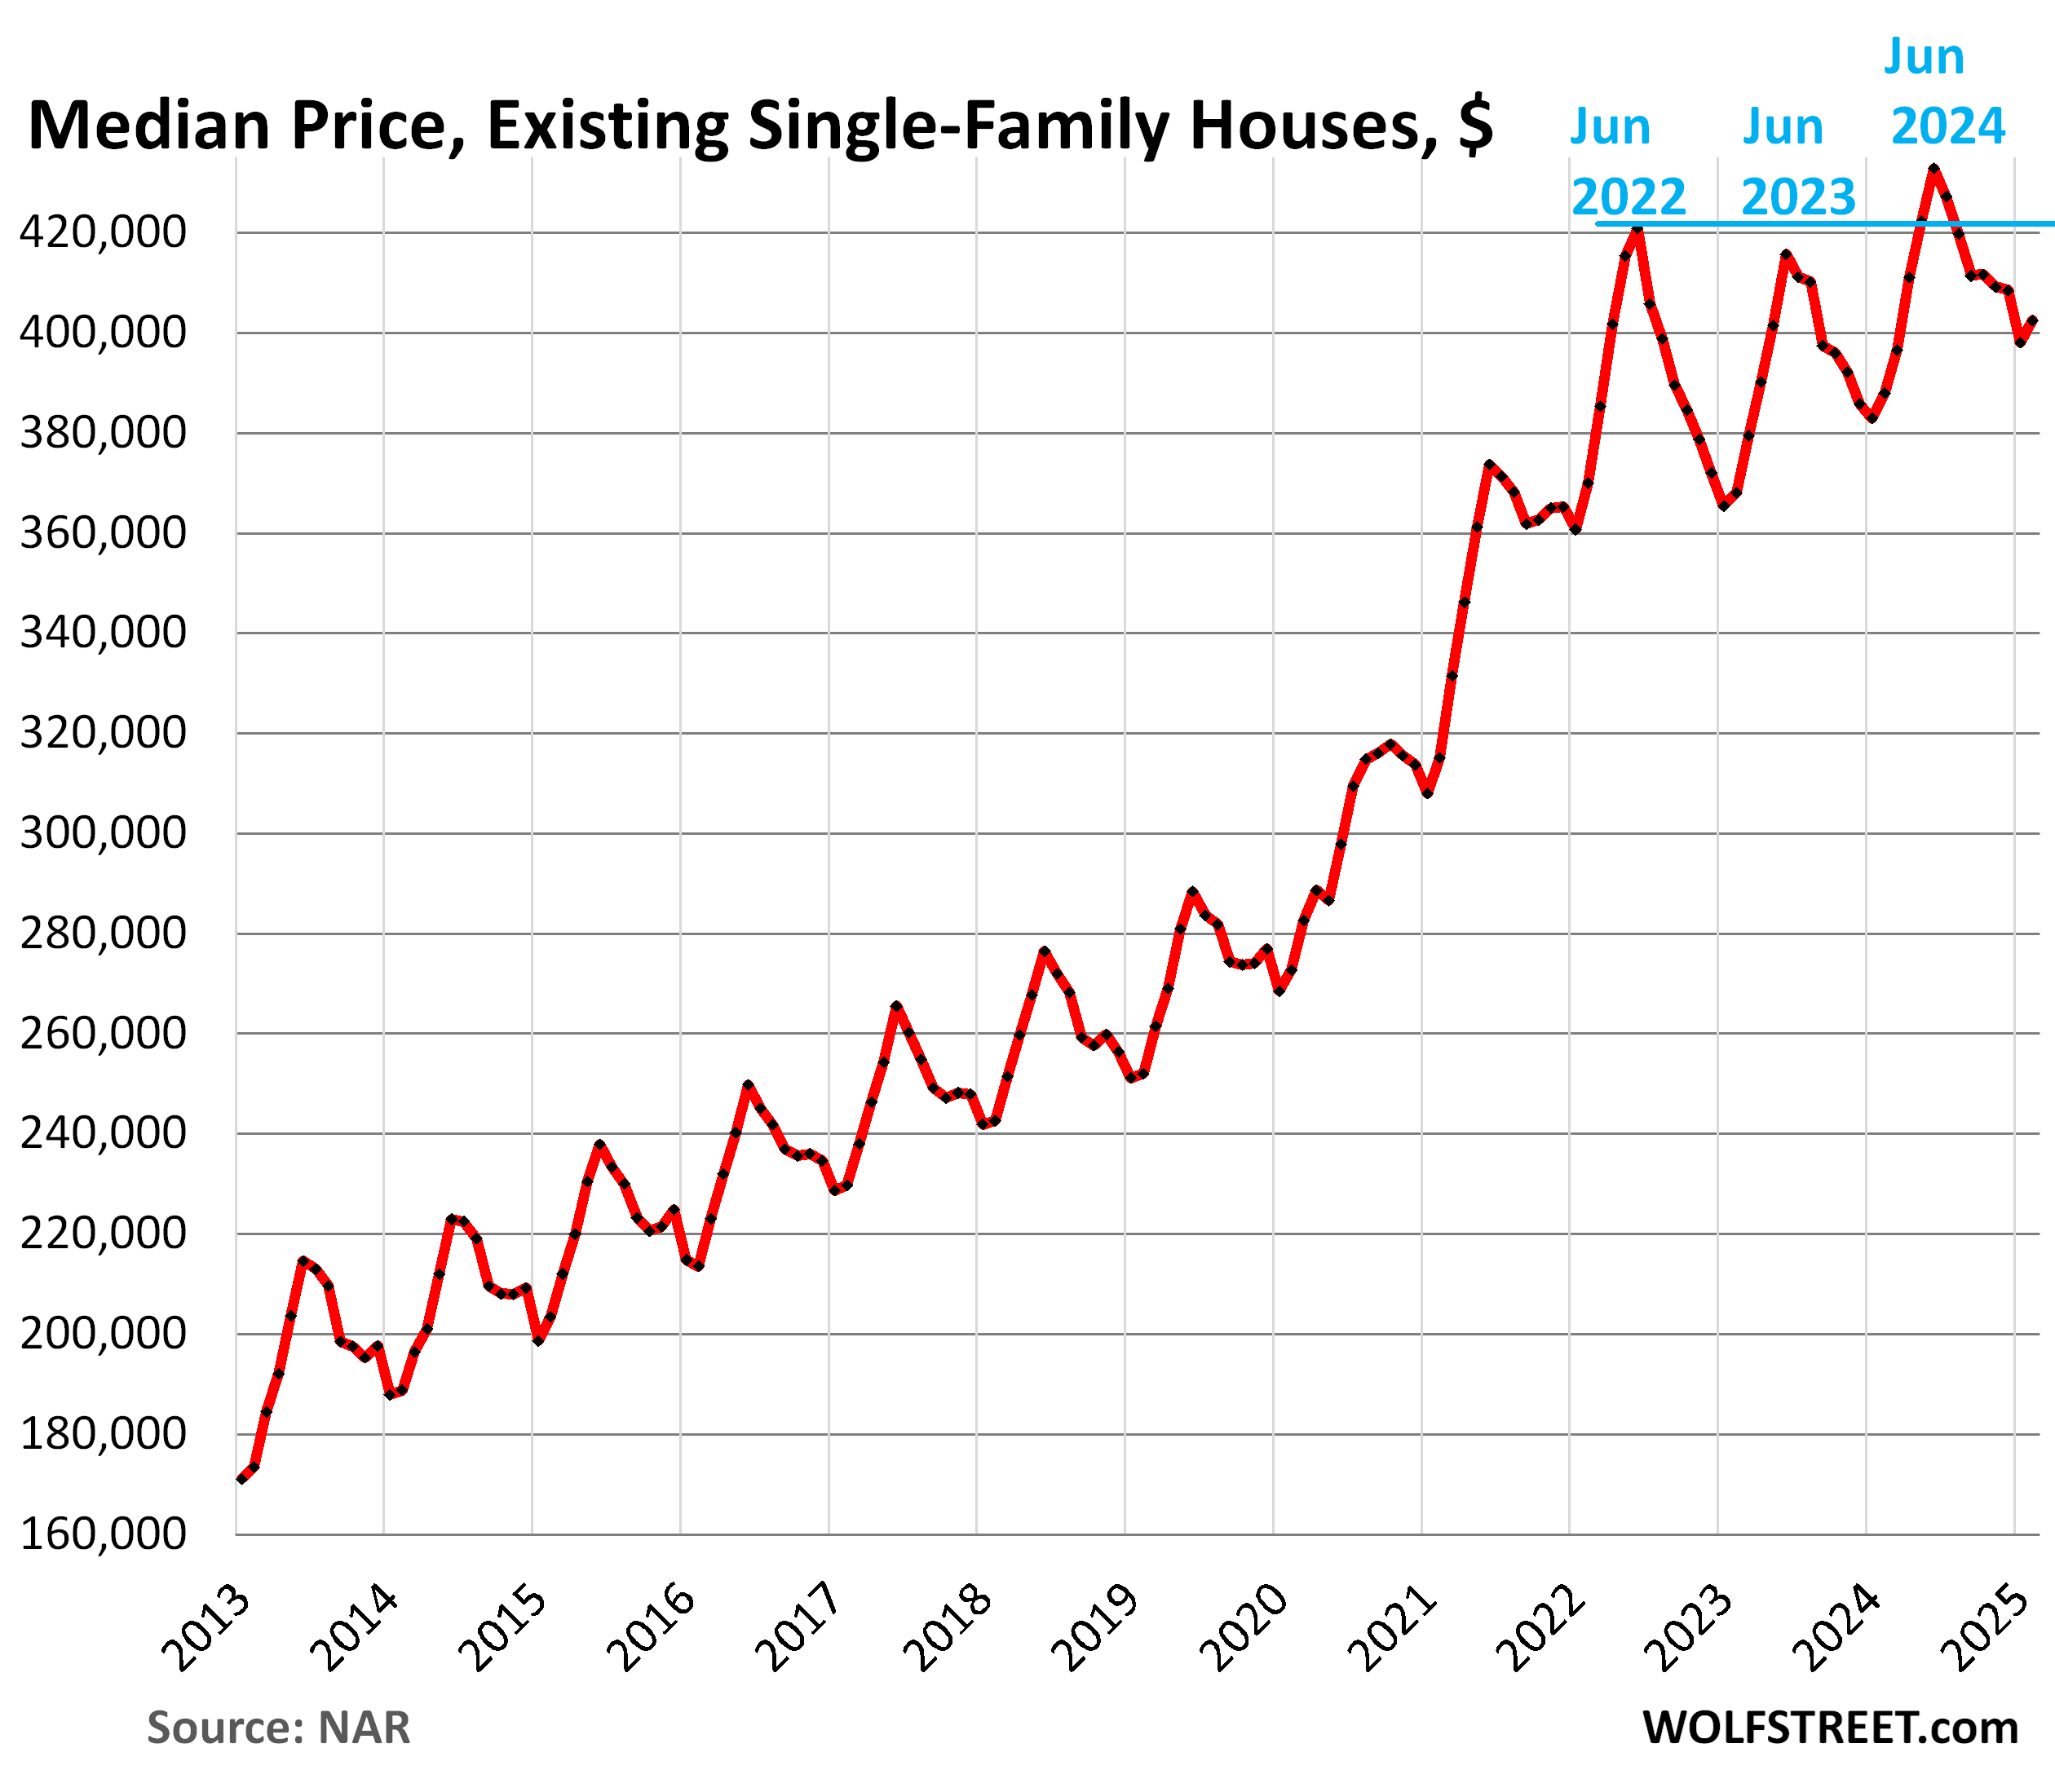
The median price is heavily skewed by changes in the mix of homes that sold. In the spring, nationally, more higher-end homes come on the market and sell, which changes the mix of what sold and skews the median price higher. It then does the reverse in the fall and winter and skews the median price lower. These seasonal ups and downs in prices are at least in part due to this shift in the mix.
Single-family houses: The national median price rose to $402,500 in February, from the downwardly revised January of $398,100 that had originally been reported as $402,000.
This trimmed down the year-over-year increase to +3.7%, and the January gain was downwardly revised to +4.0% (from +5.0% originally reported). December’s gain of +5.9% had originally been reported as +6.1%.
The 50% price explosion over the three years between June 2019 and June 2022, on top of the large price gains in the prior 10 years, was driven by the Fed’s interest-rate repression and money-printing schemes which have created the #1 problem in the housing market today, which is why demand has plunged: Prices are way too high.
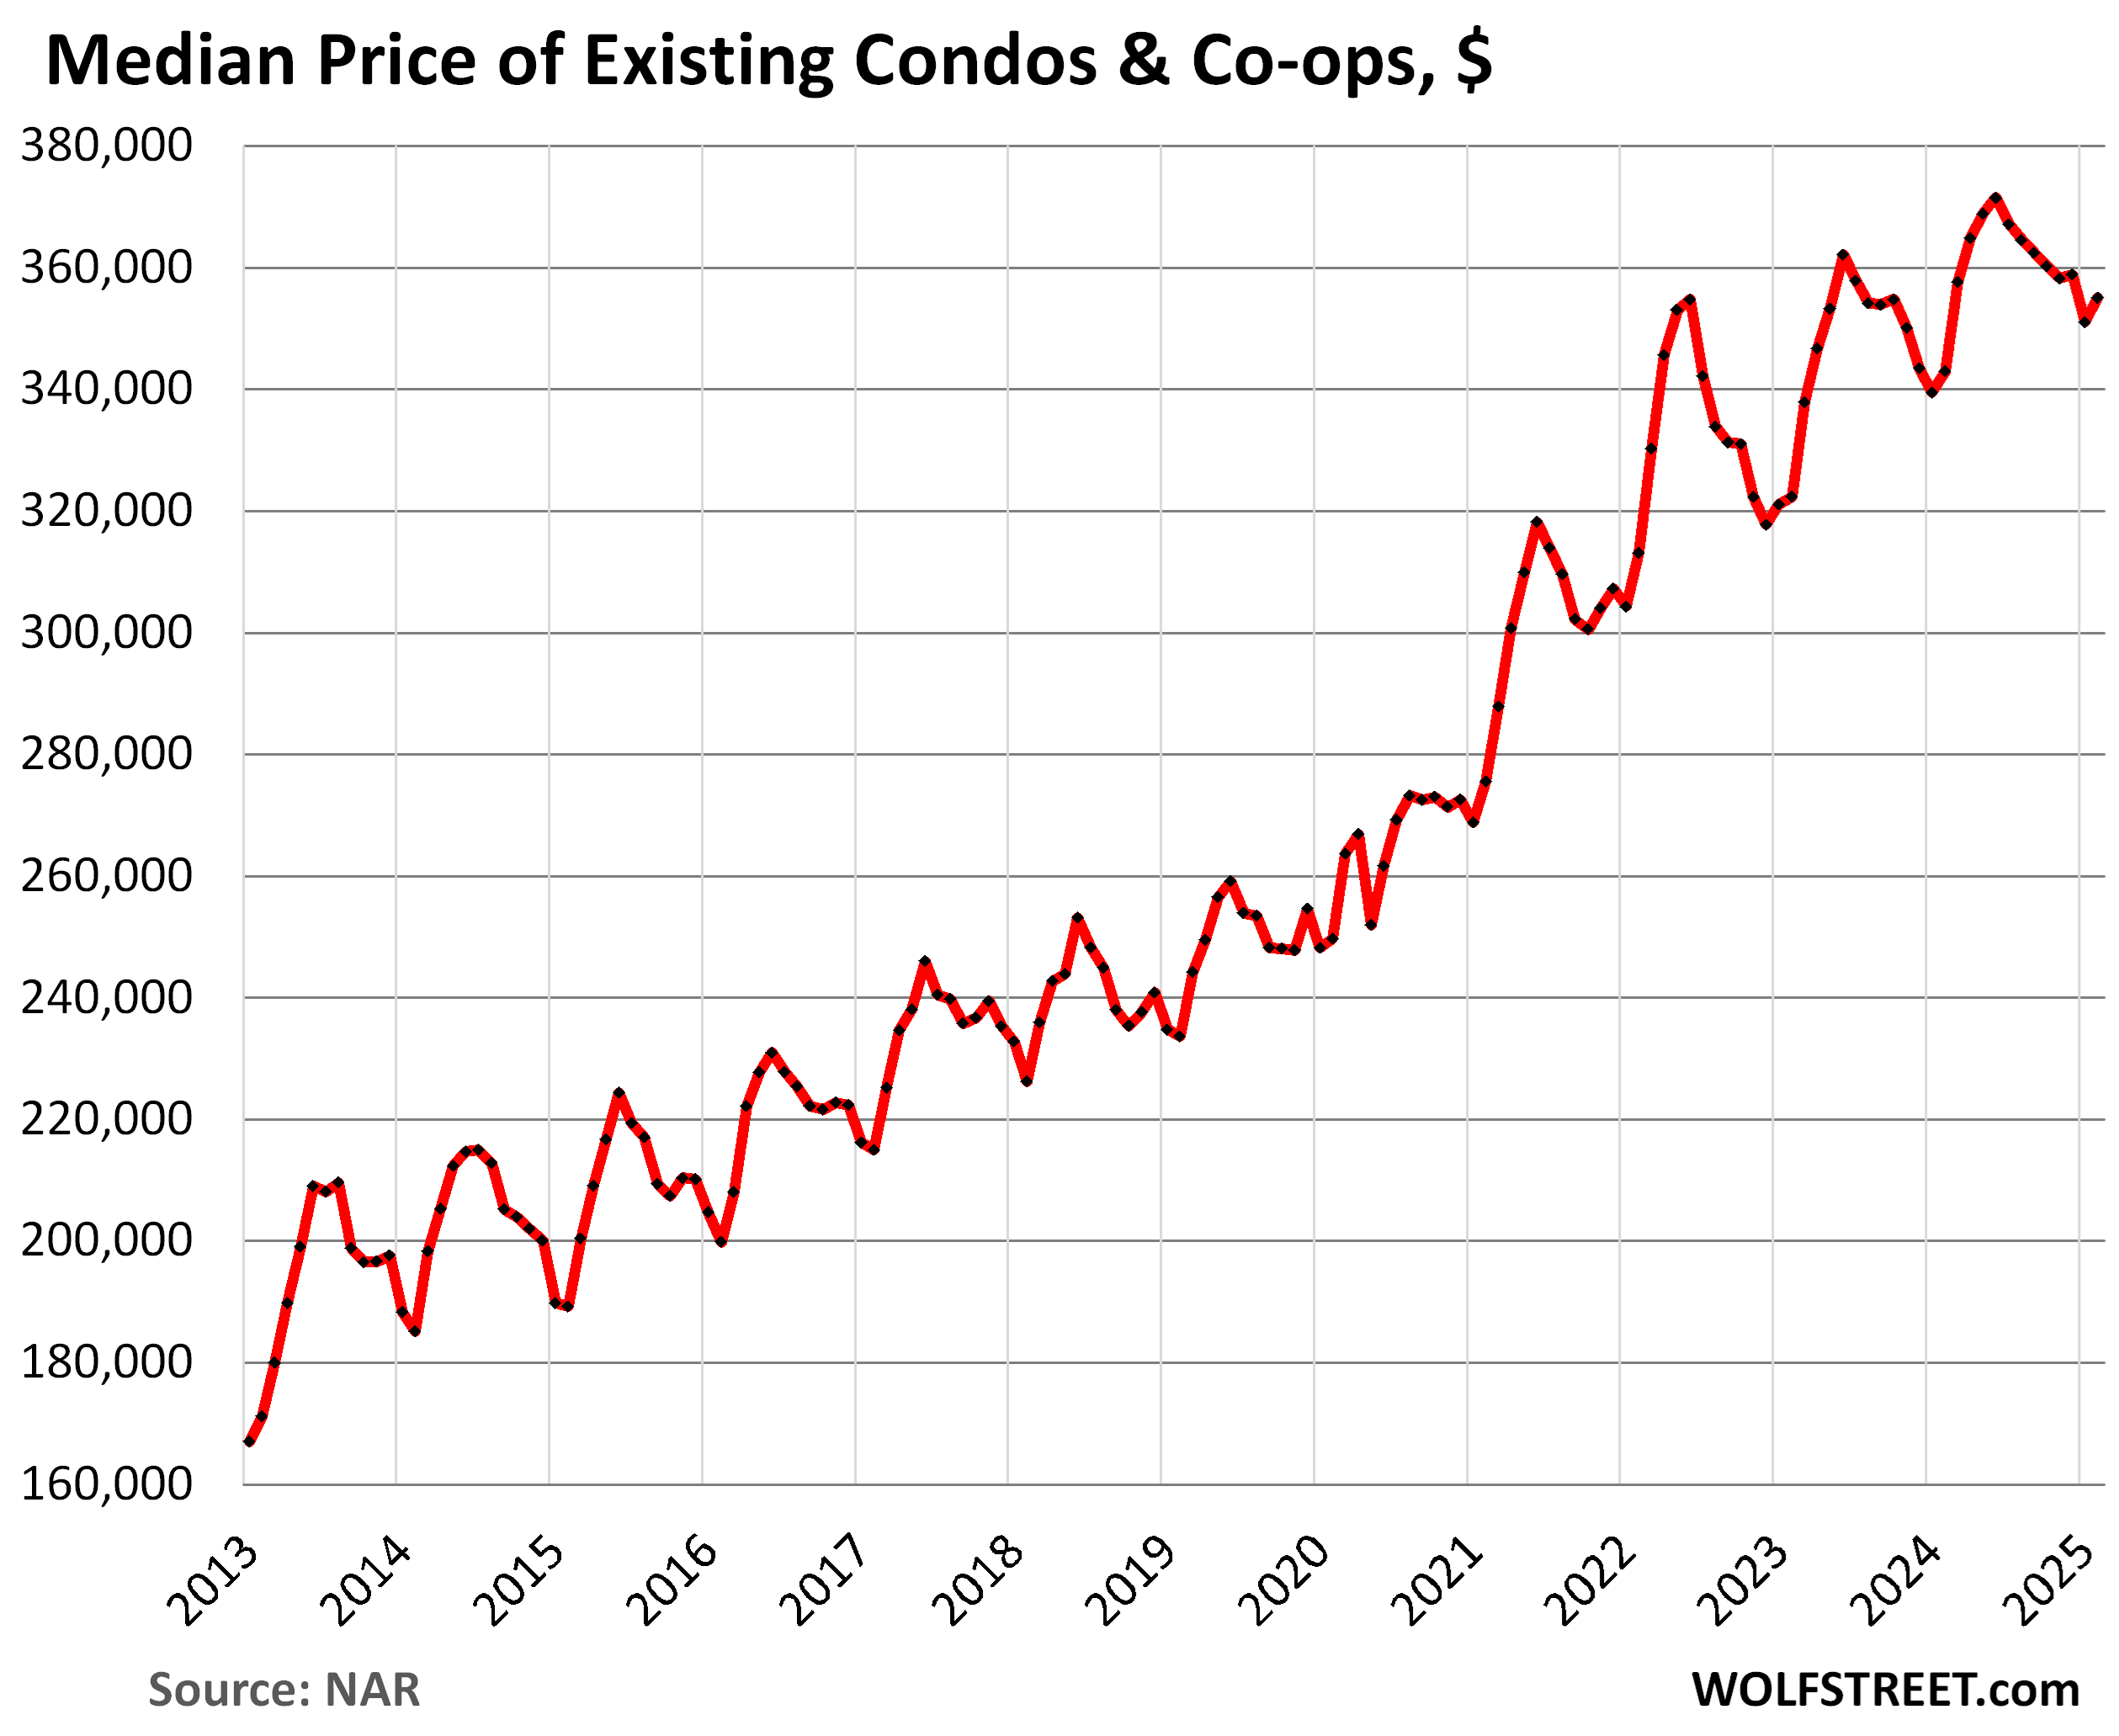
Condos and co-ops. Prices rose to $355,100 and were up by 3.5% year-over-year.
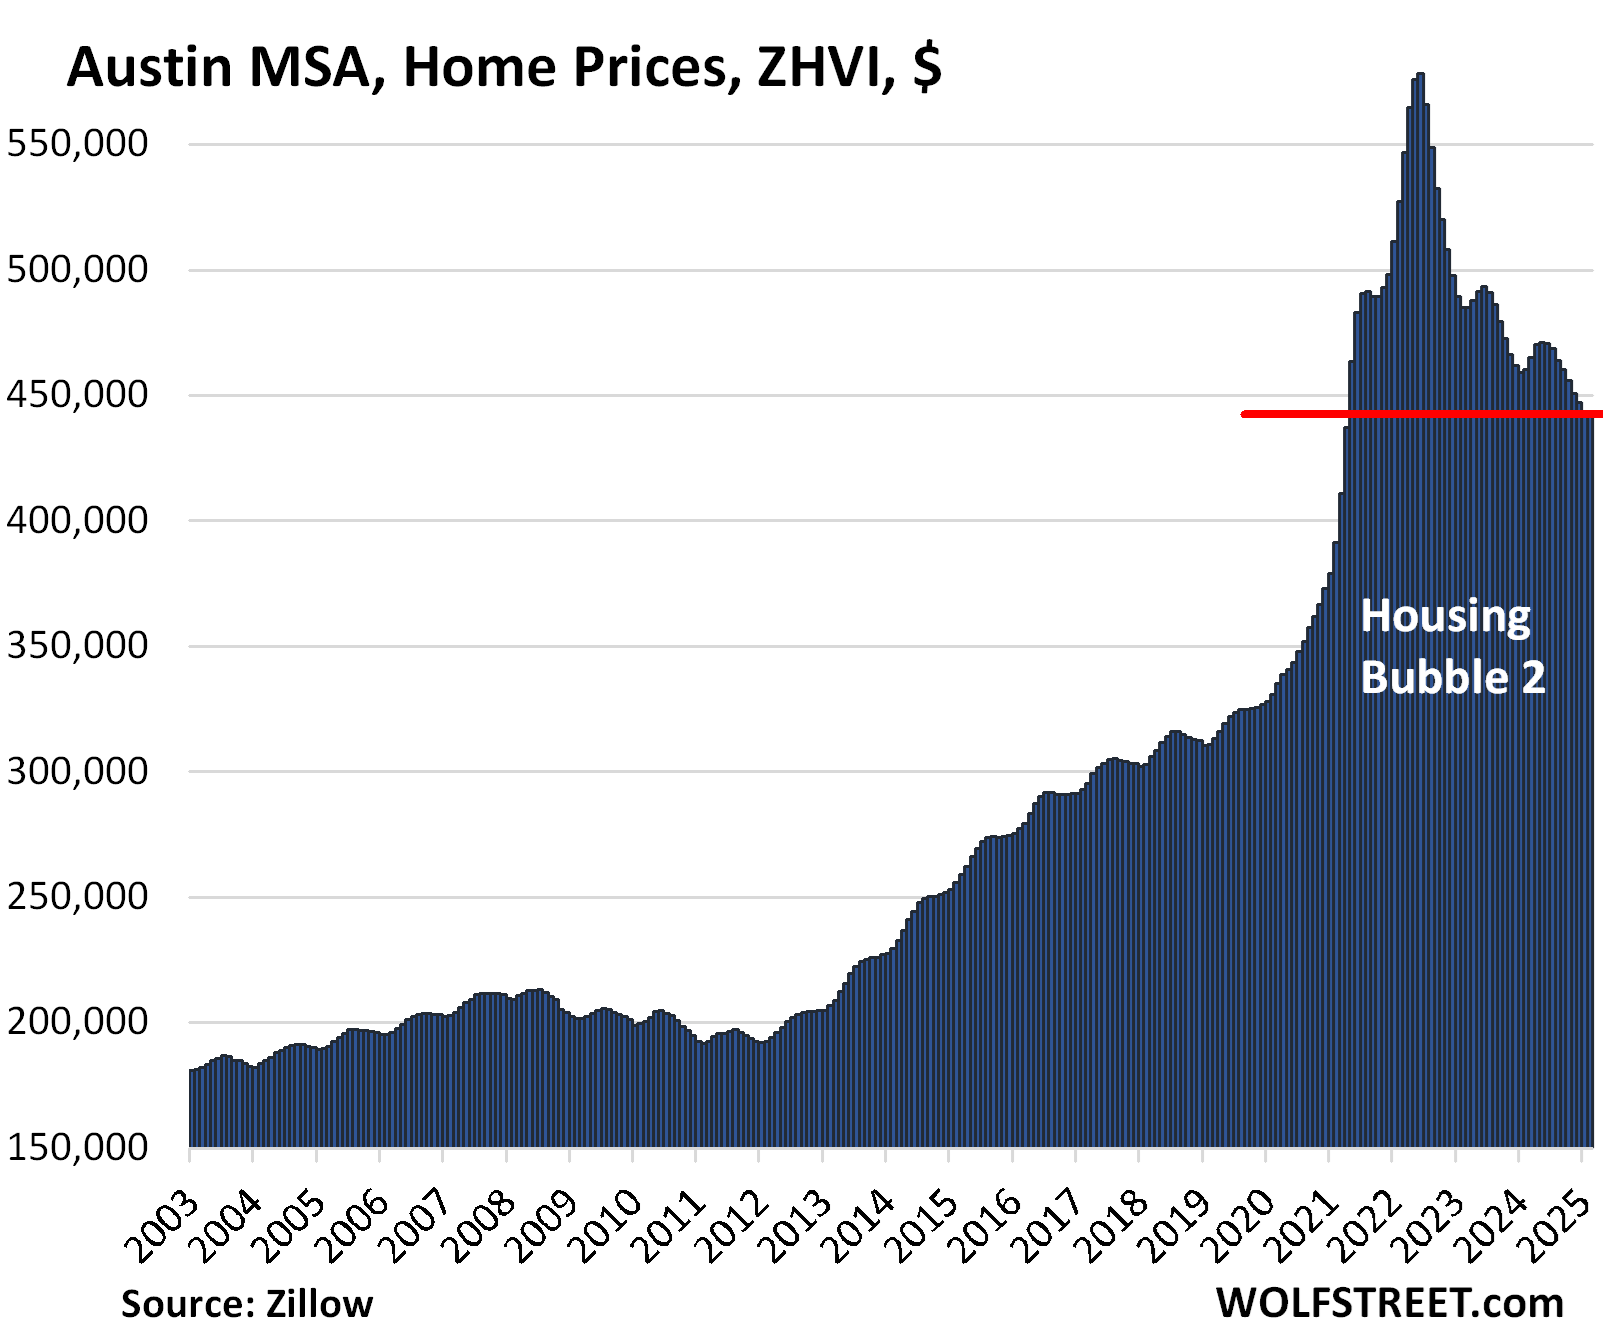
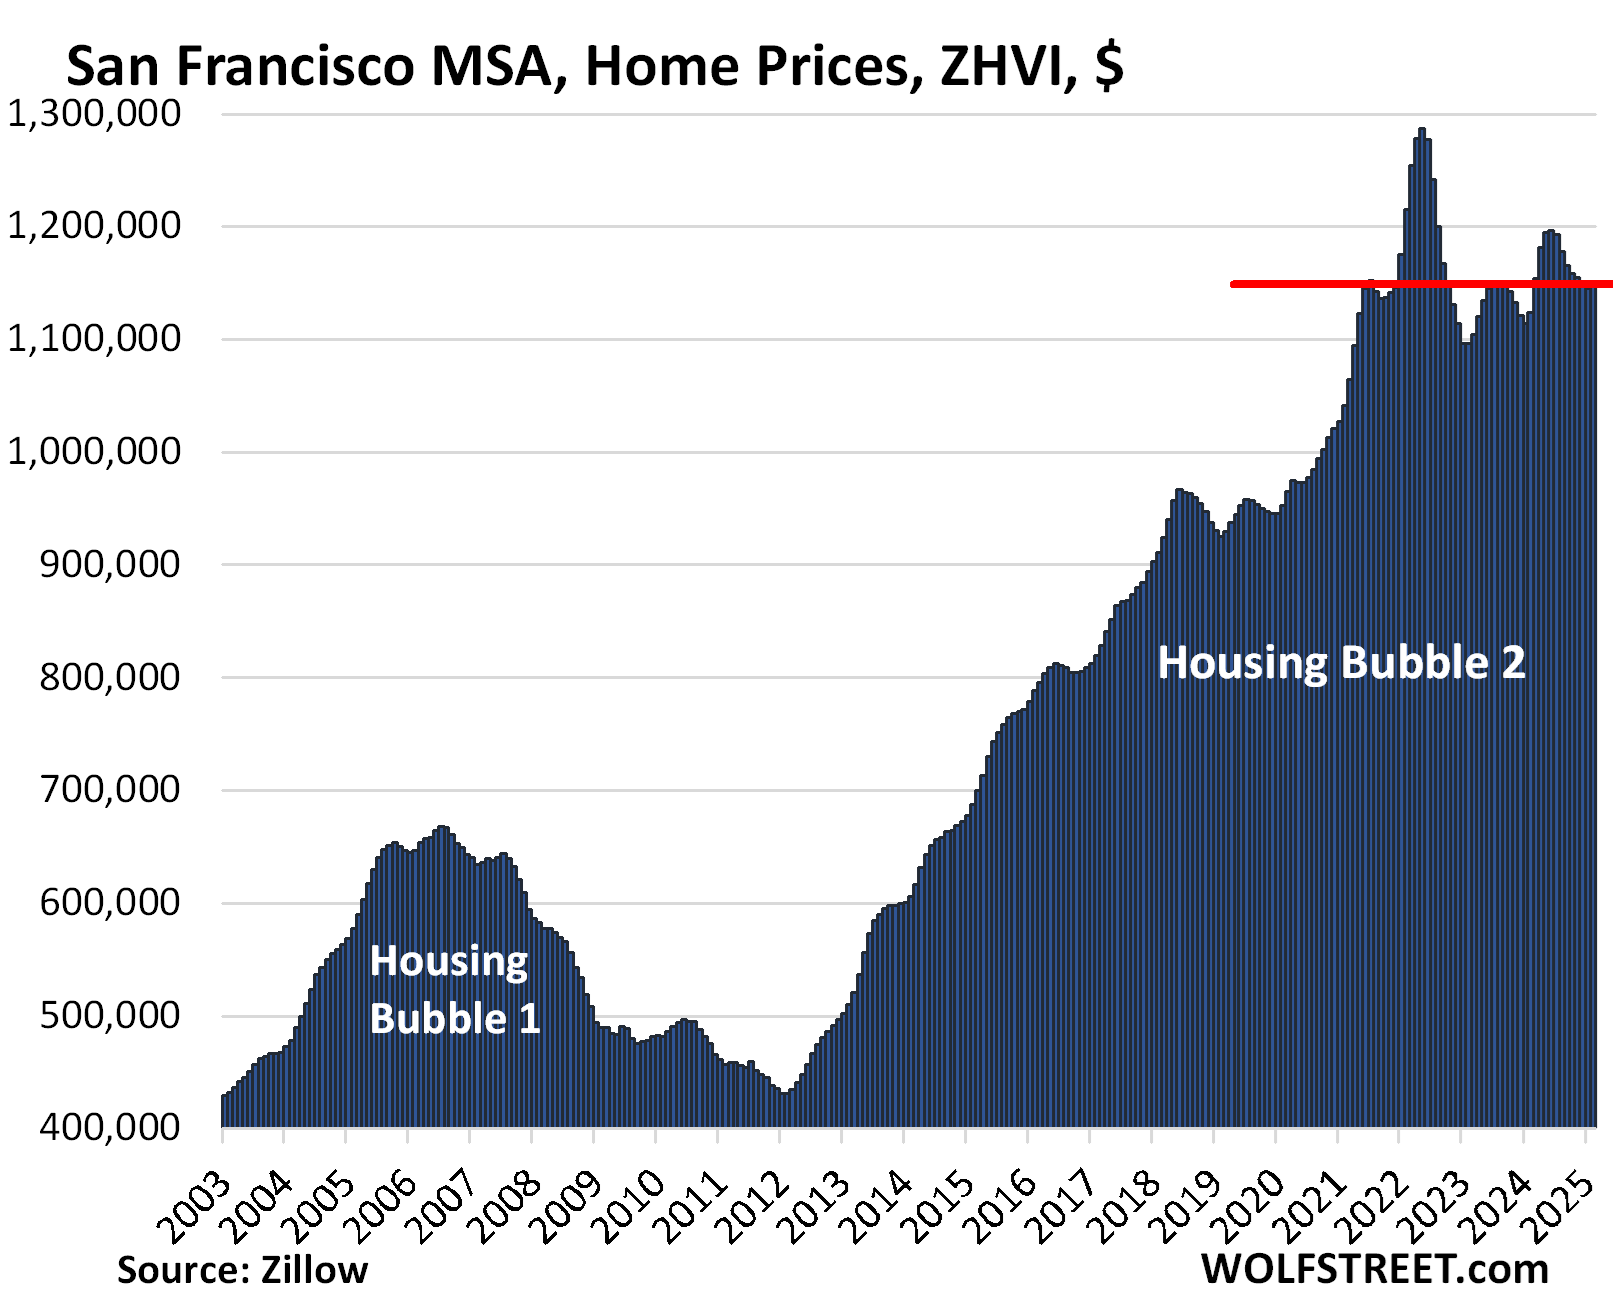
But every market dances to its own drummer. I track home prices in the largest most expensive 33 markets, in my long-running series The Most Splendid Housing Bubbles in America, Feb 2025: The Price Drops & Gains of 33 Largest Costliest Housing Markets. In quite a few of them, prices have dropped substantially from their peaks in mid-2022. Here are two examples:
Enjoy reading WOLF STREET and want to support it? You can donate. I appreciate it immensely. Click on the mug to find out how:

![]()
The post Buyers Strike Not Letting Up: Sales of Existing Homes Have Worst February since 2009, as Inventory Surges appeared first on Energy News Beat.
Energy News Beat