
By Wolf Richter for WOLF STREET.
Inflation dished out another bad surprise with a big increase in January from December, which wasn’t a surprise because inflation, once it gets going, is known to do that. This time, the hot spots were durable goods, fueled by the continued massive month-to-month increases in used vehicle prices, and non-housing services, such as auto insurance, admissions, subscriptions, etc. Food and energy prices also jumped in January. Rent inflation accelerated. But at least the CPI for apparel and shoes dropped in January.
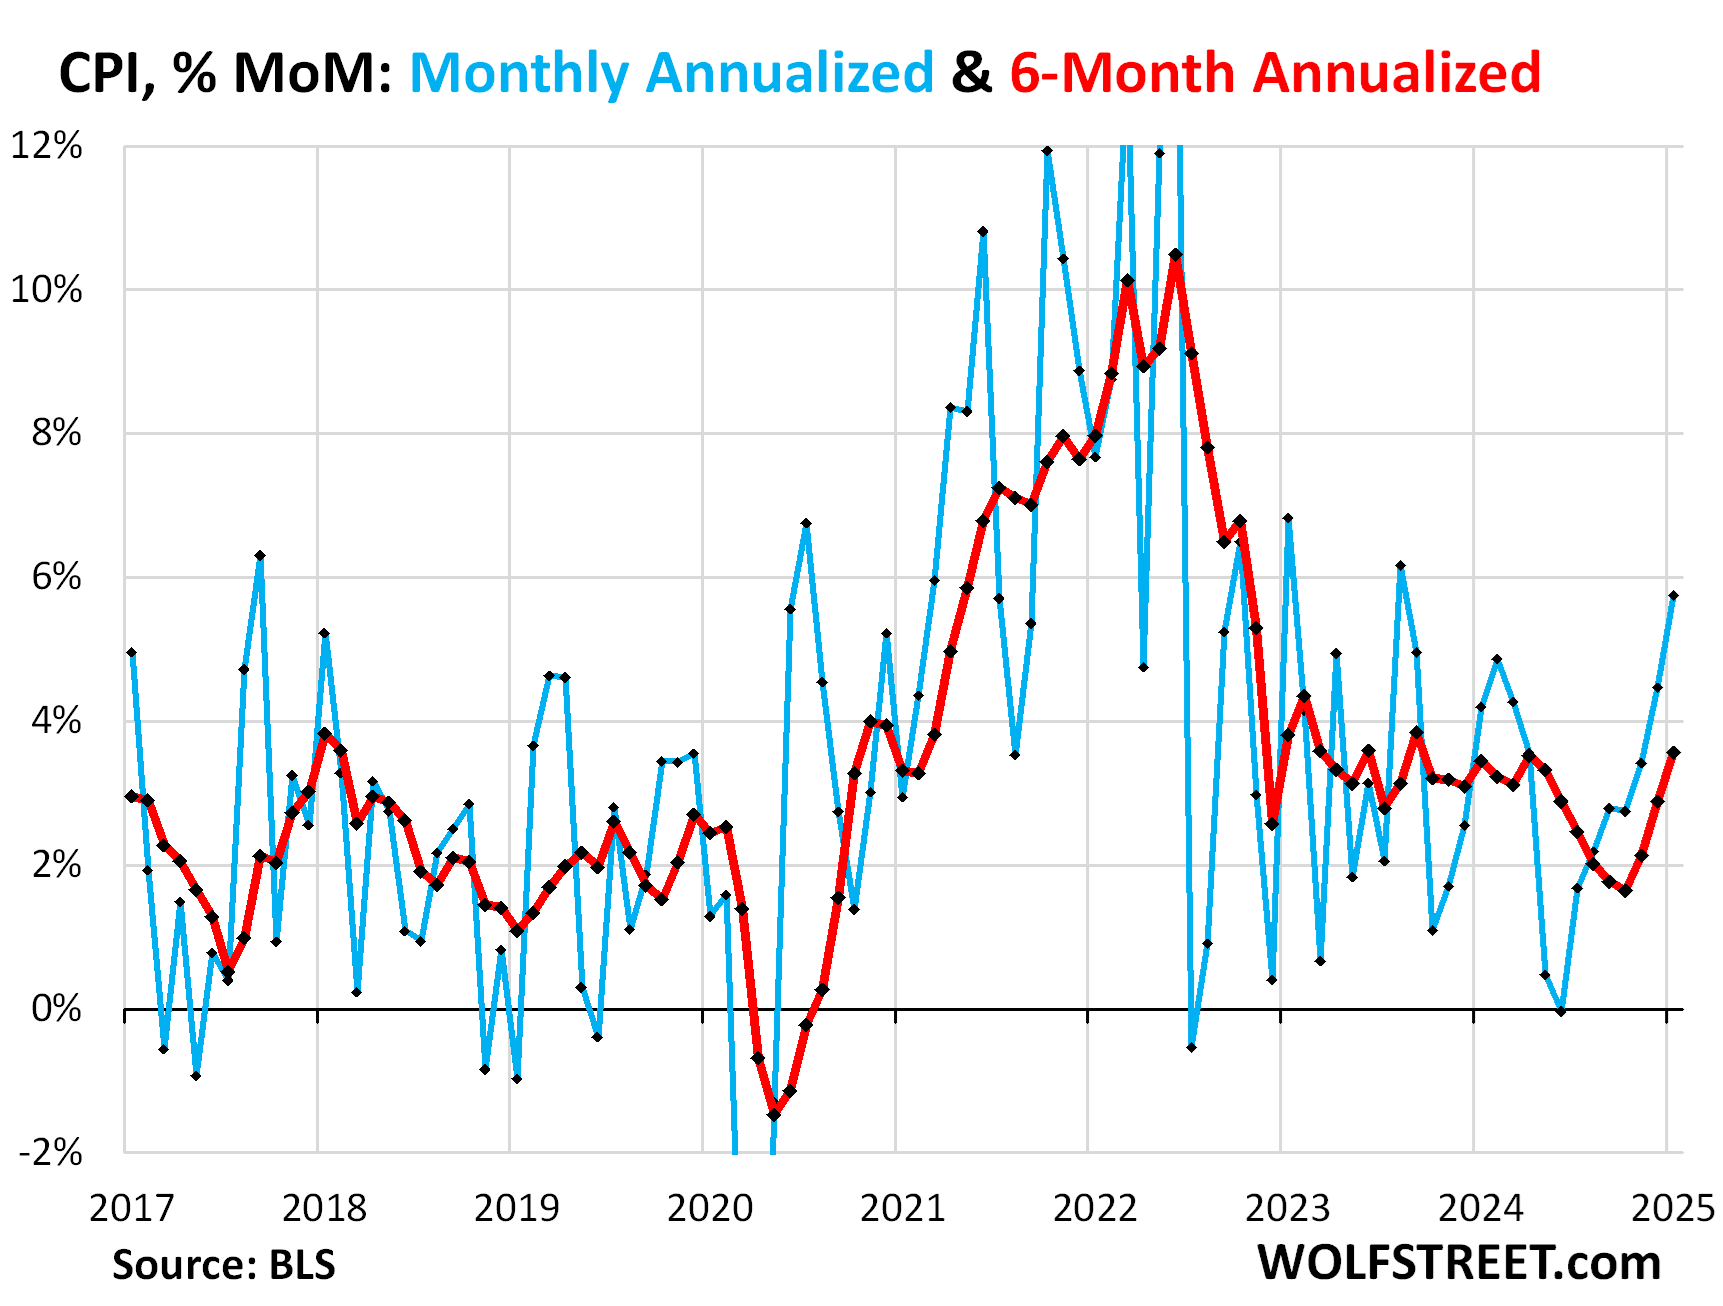
The overall Consumer Price Index rose by 0.47% (+5.7% annualized) in January from December, the worst month-to-month increase since August 2023. It has been accelerating relentlessly since the low point in June (blue). This acceleration pushed the year-over-year increase to 3.0%, the worst increase since May.
- 3-month CPI: +4.5% annualized, sharpest increase since November 2022, and sixth month-to-month acceleration in a row (not shown in the chart).
- 6-month CPI: + 3.6%, worst increase since September 2023. Inflation is going in the wrong direction (red):
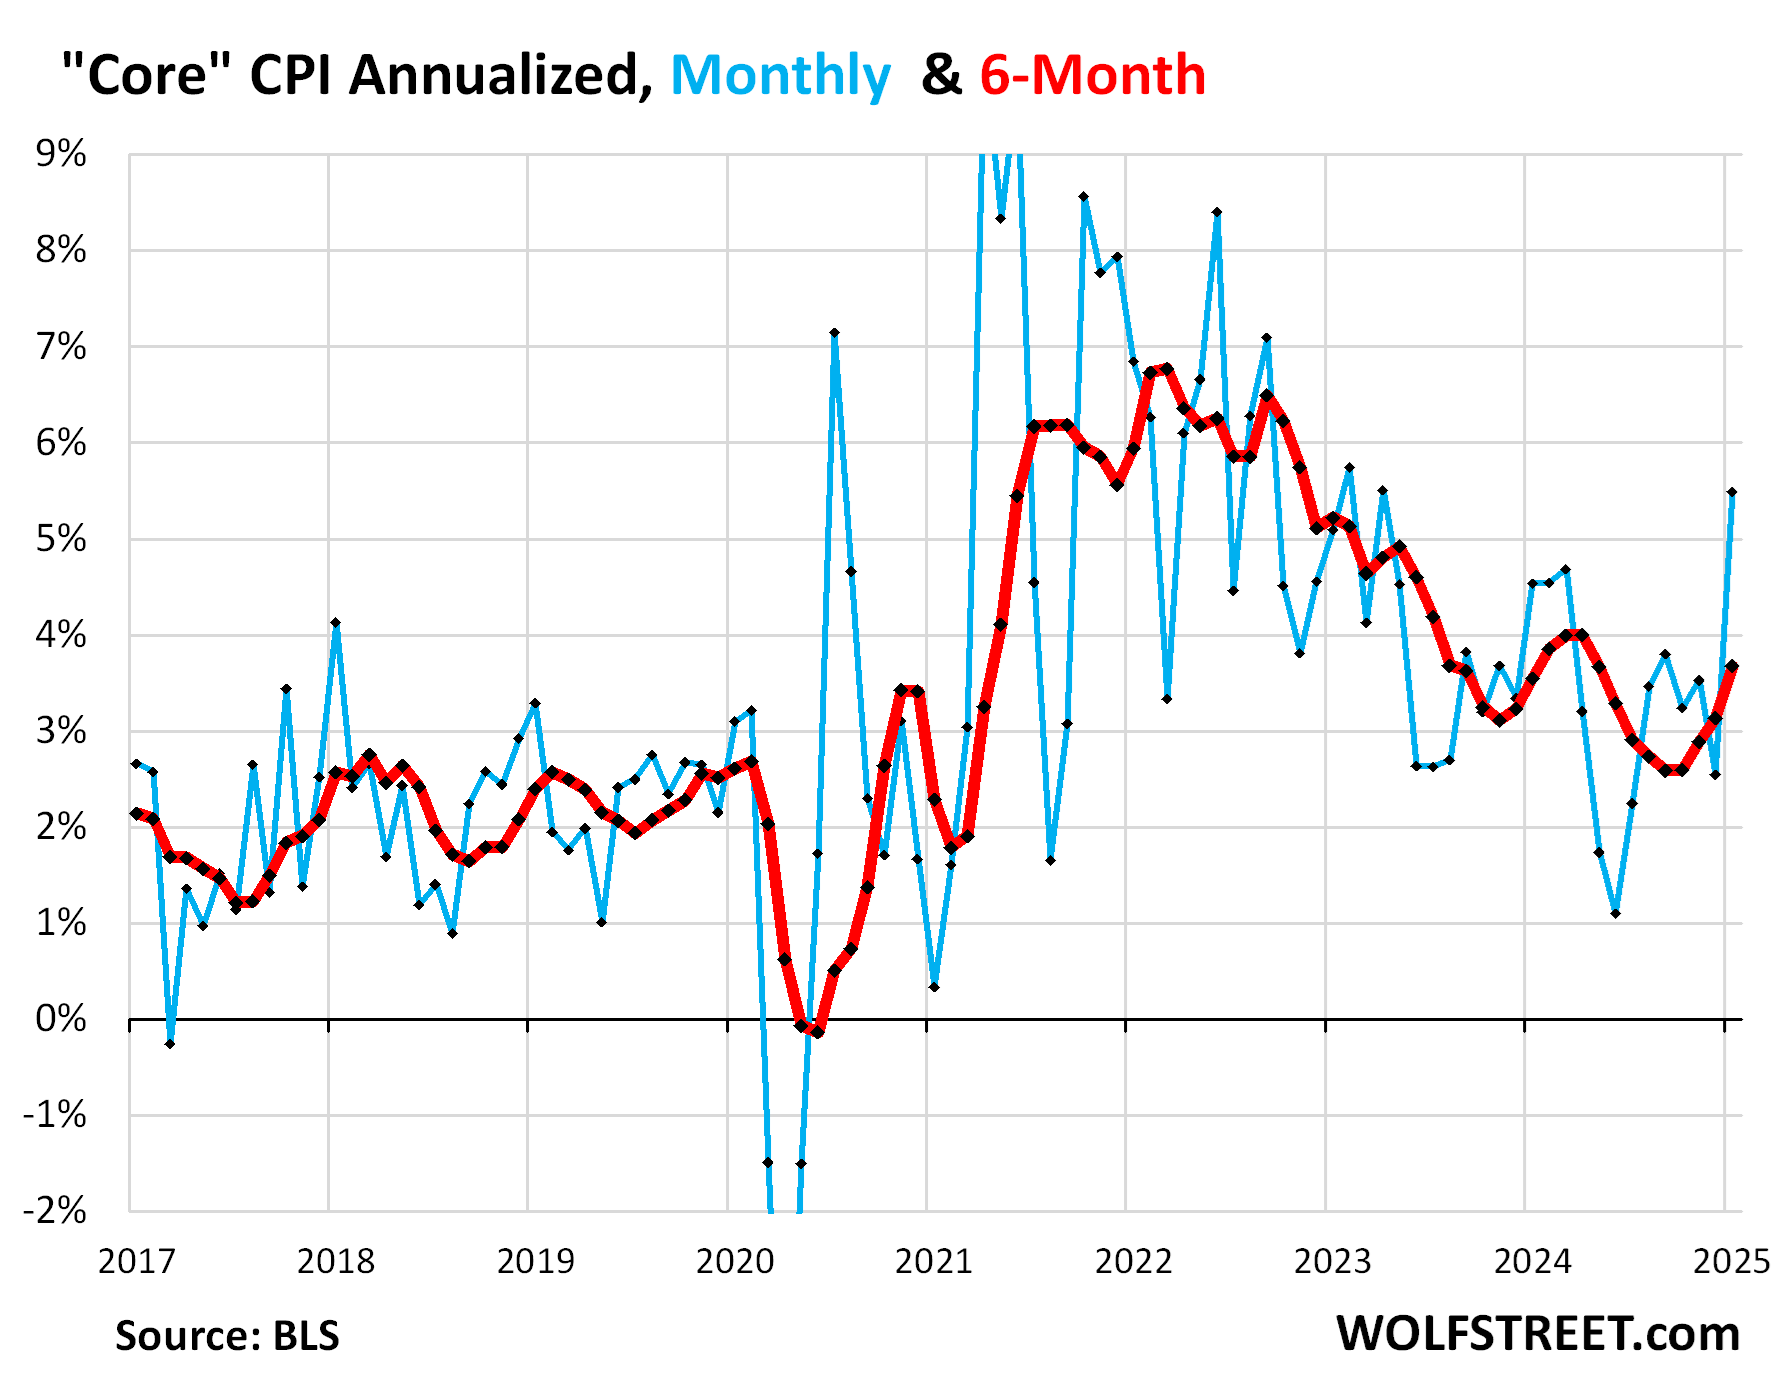
Month-to-month “Core” CPI, which excludes food and energy components to track underlying inflation, jumped by 0.45% (+5.5% annualized) in January from December, the worst increase since April 2023, (blue in the chart below).
The 6-month average “core” CPI accelerated to +3.7% annualized, the third month in a row of acceleration and the worst since May (red).
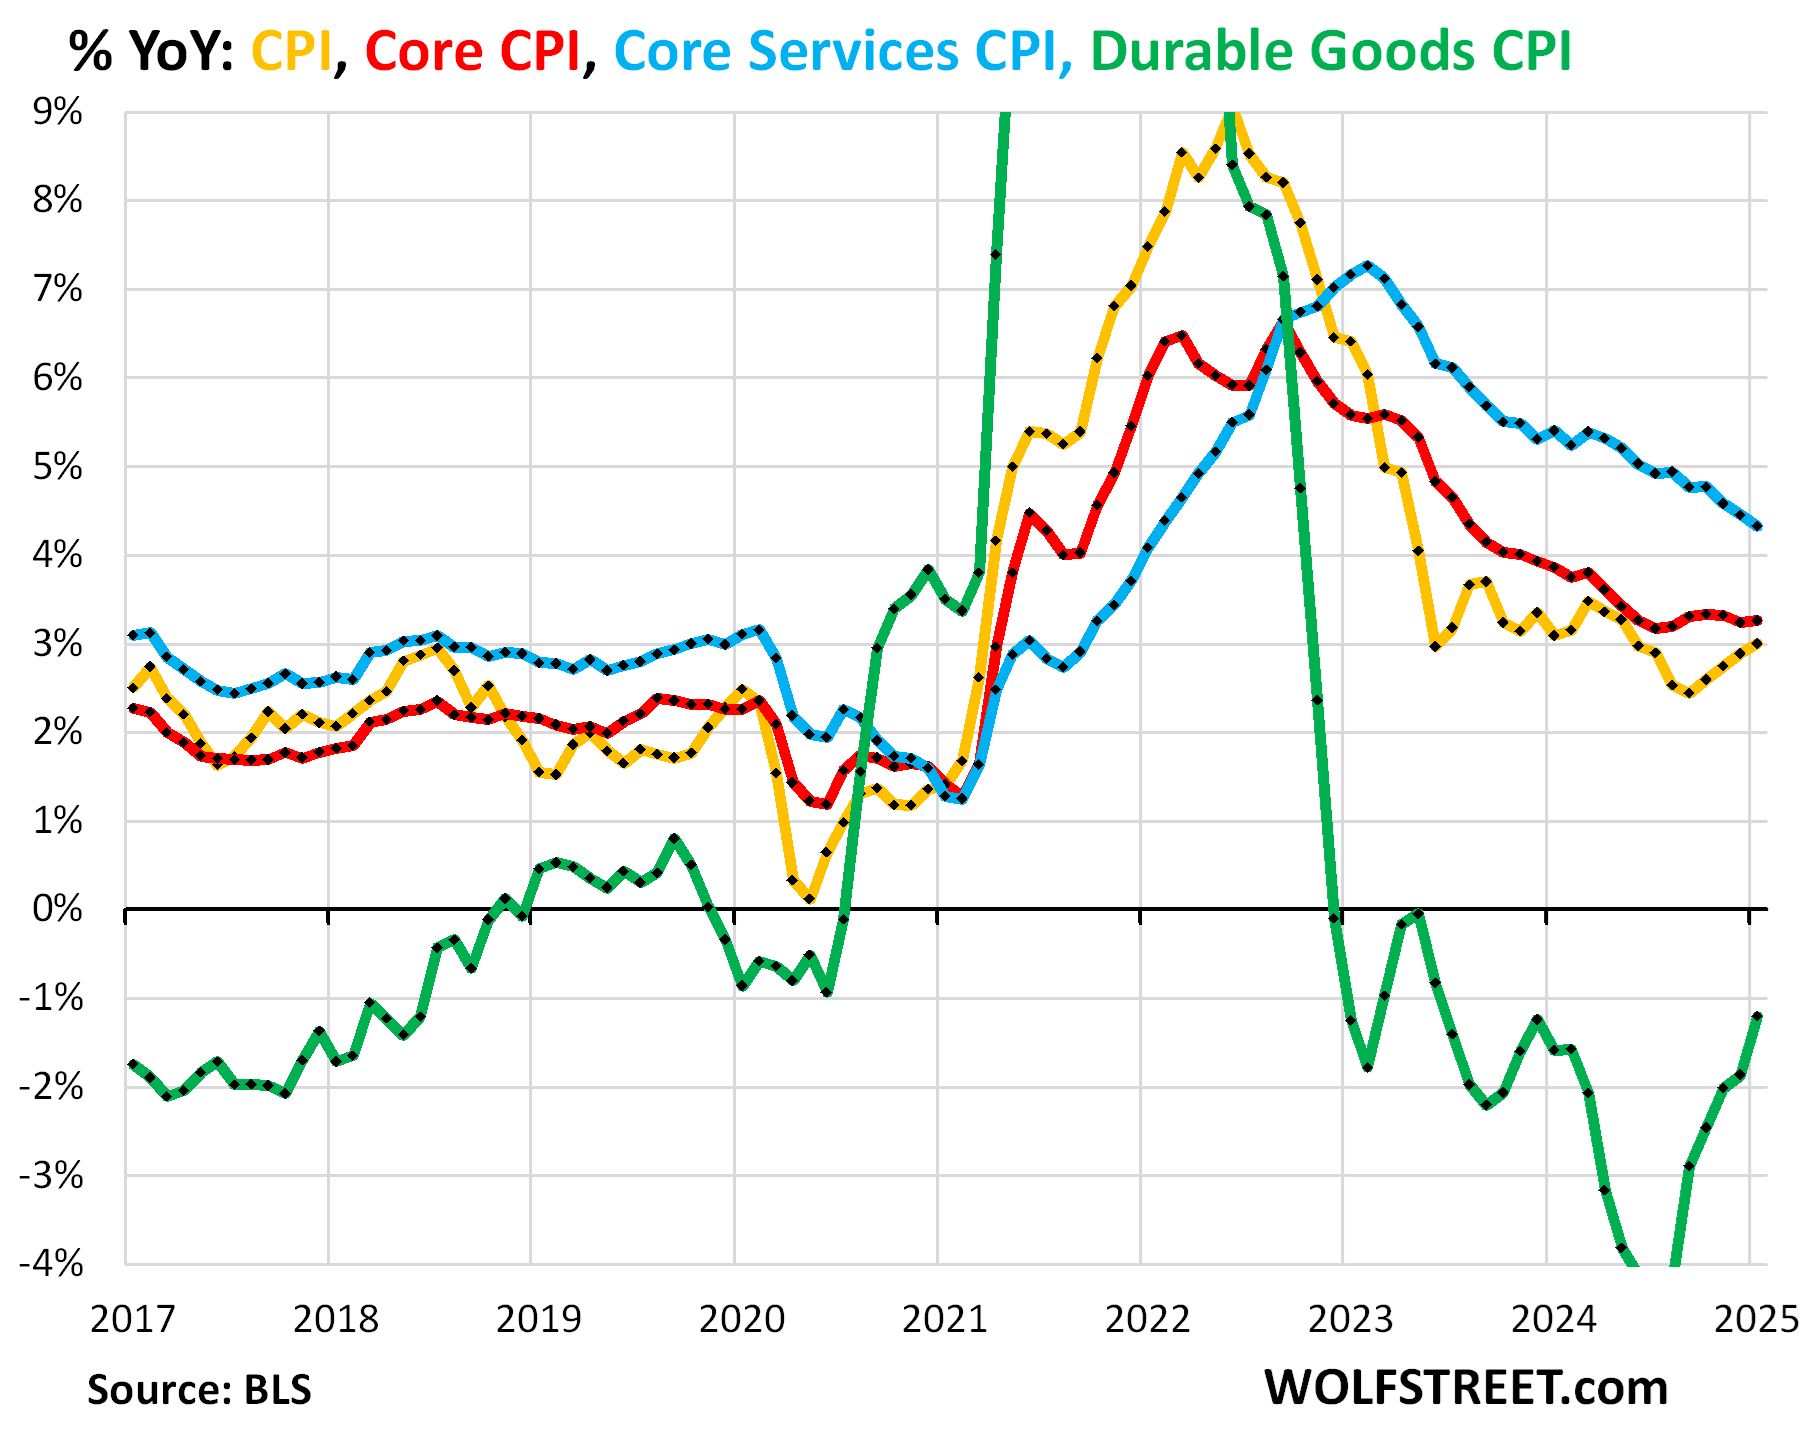
The major components, year-over-year:
- Overall CPI: +3.0% (yellow), worst since May 2024
- Core CPI +3.26% (red), has not improved at all since June 2024
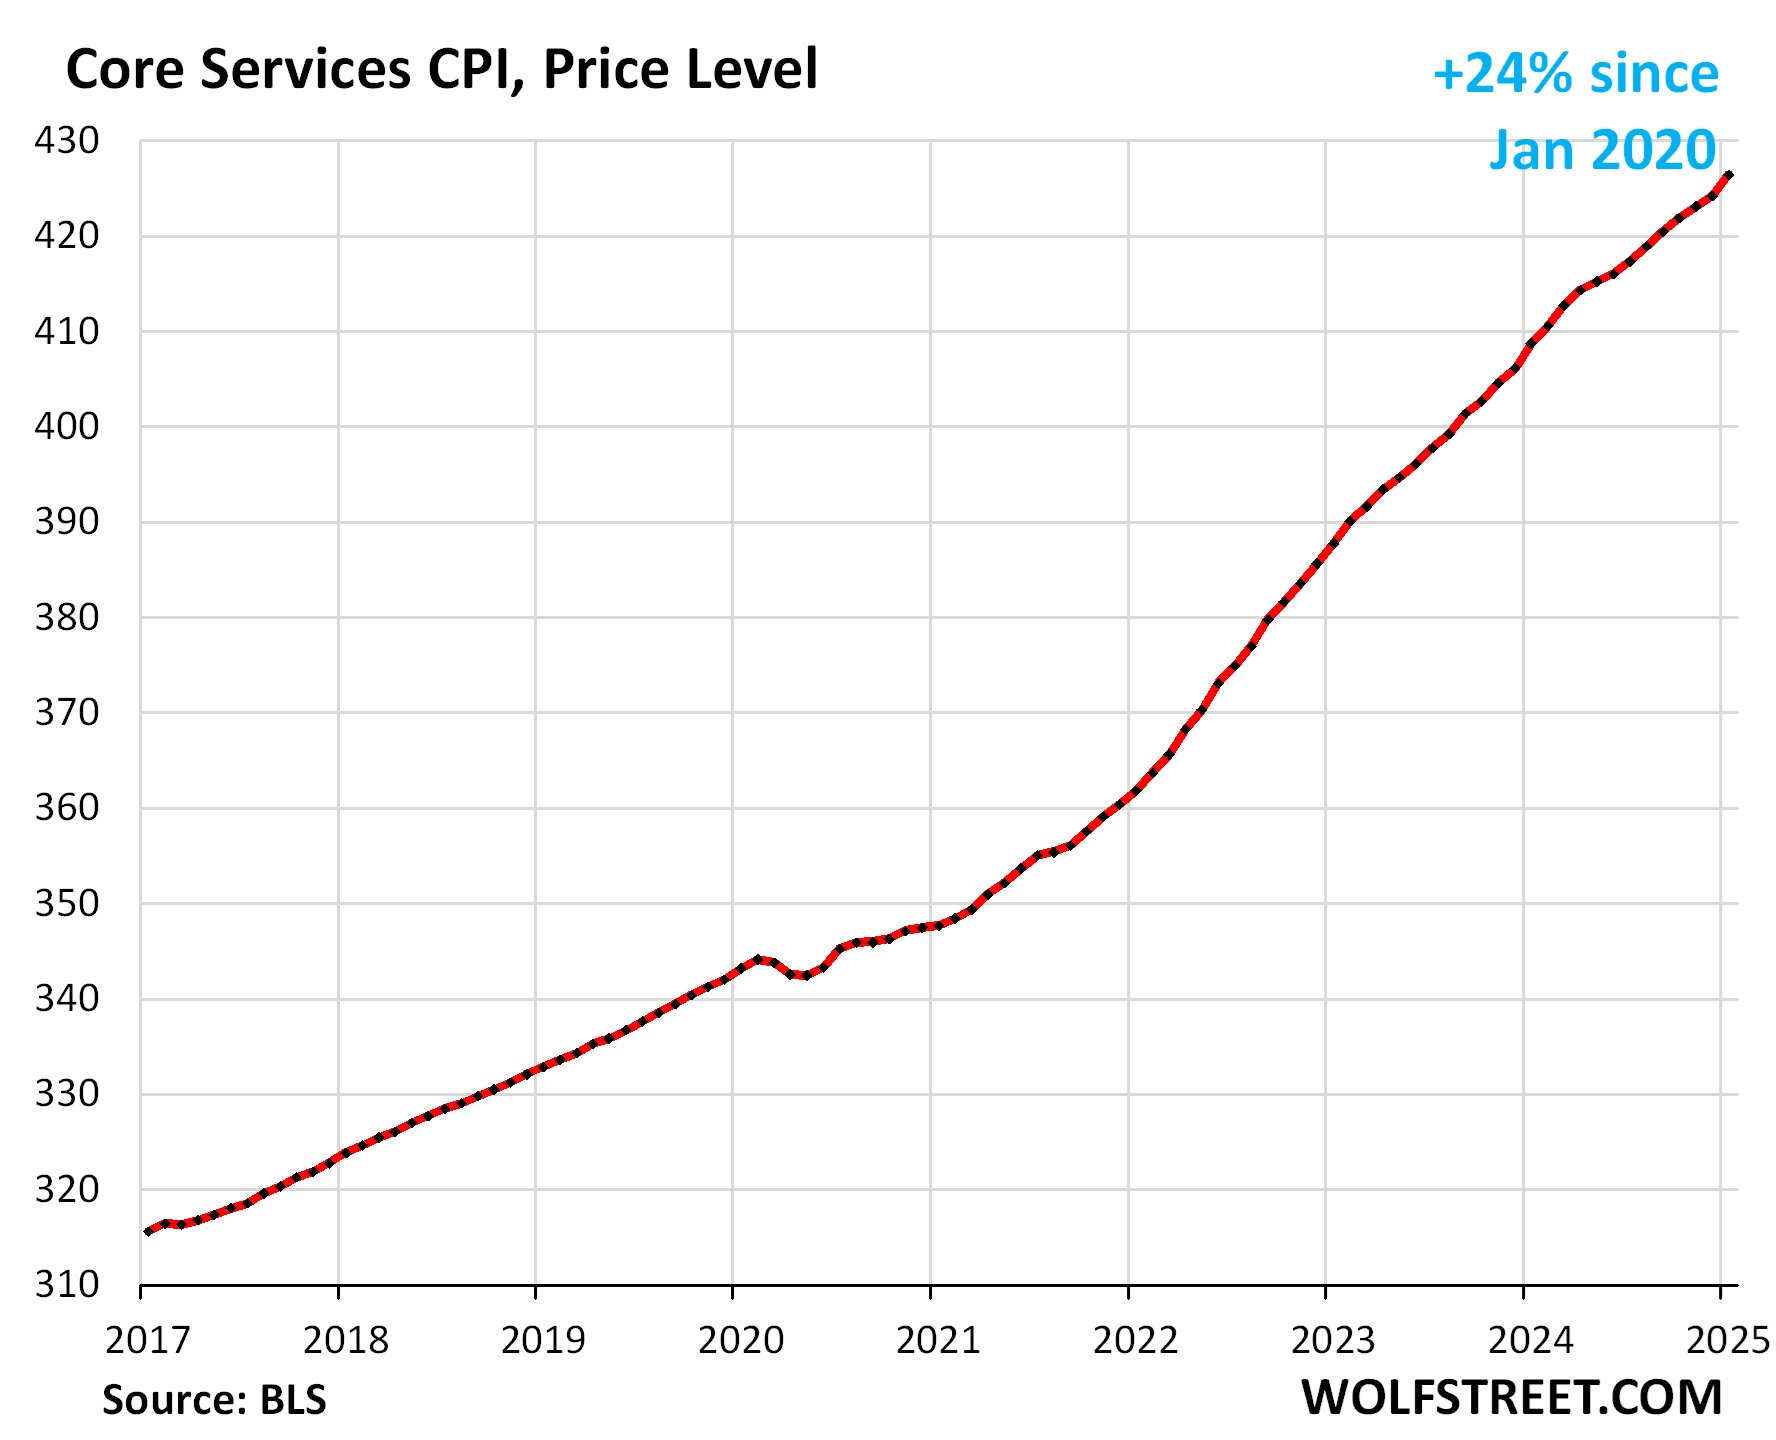
- Core Services CPI: +4.33% (blue). As we’ll see in a moment, month-to-month, it spiked by 6.35% annualized, the worst increase since February.
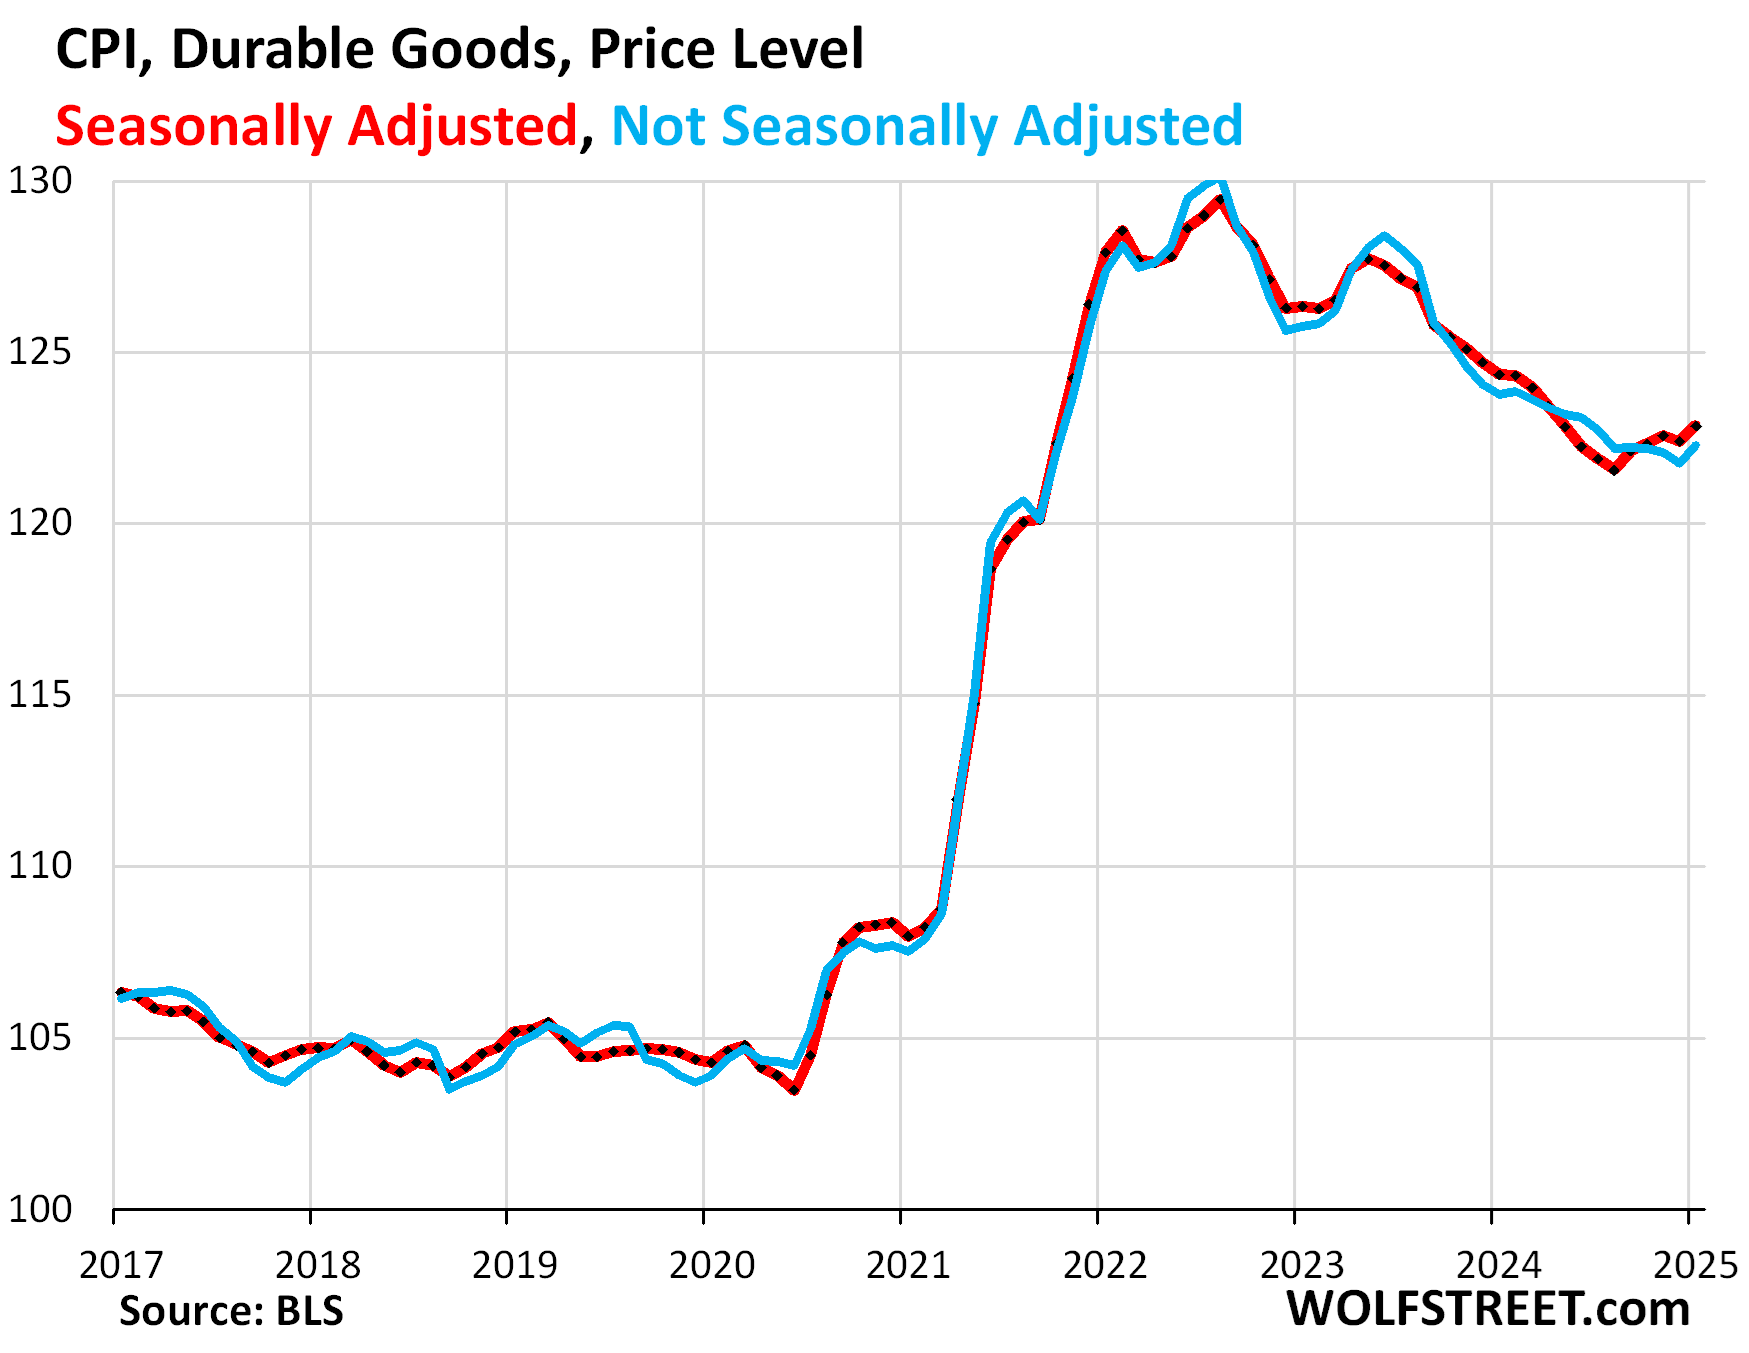
- Durable goods CPI: -1.21% (green). Month-to-month: +4.6% annualized on a spike in used vehicles, which sharply reduced the year-over-year deflation in durable goods.
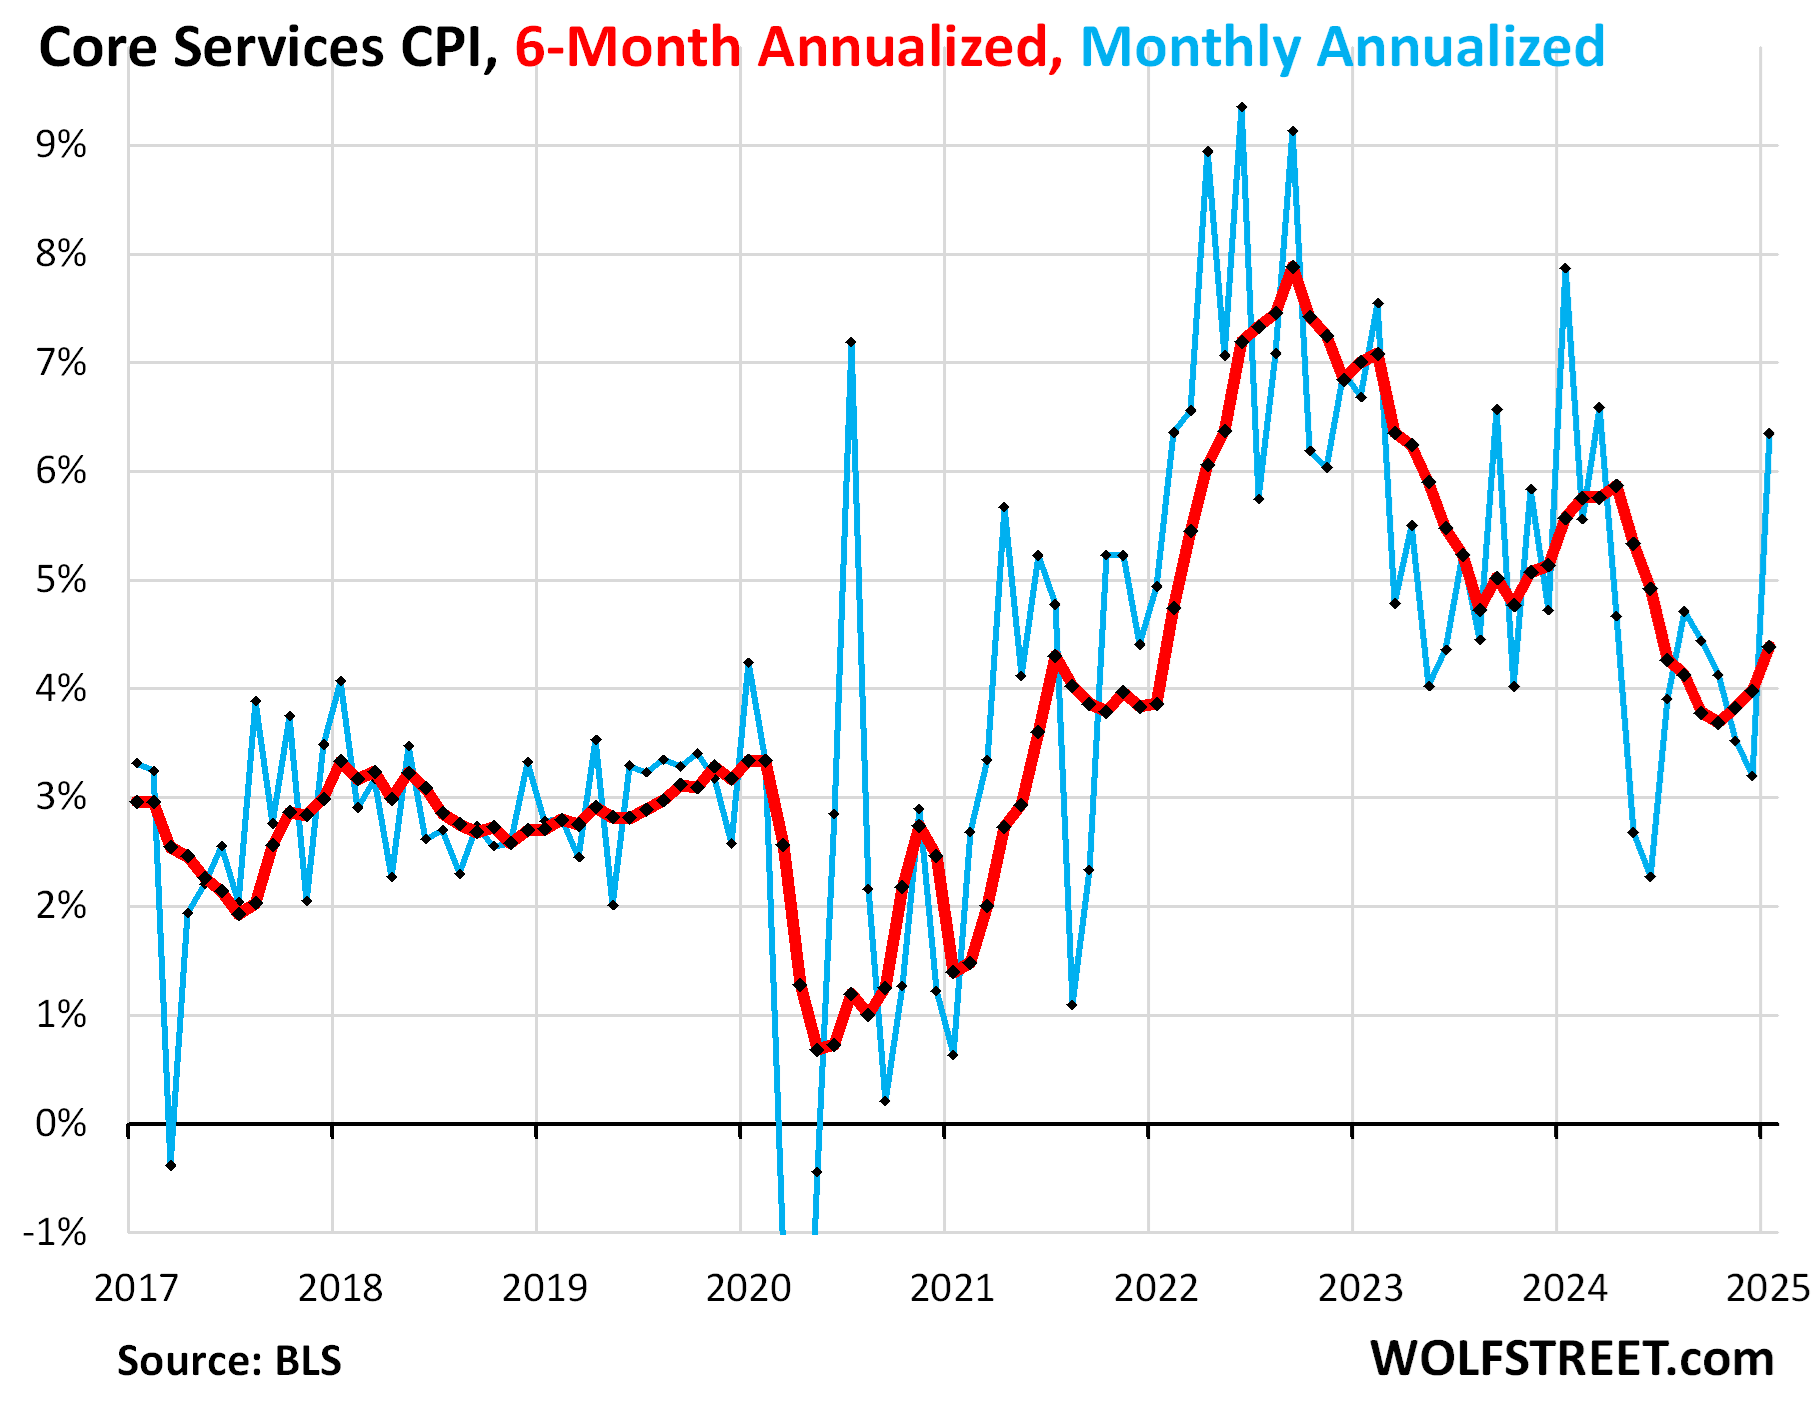
“Core services” CPI.
Month-to-month, the core services CPI, which are all services less energy services, spiked by 6.35% annualized (+0.51% not annualized) in January from December, the worst increase since February 2024 (blue line in the chart below).
The three-month core services CPI accelerated to +4.35% annualized, the worst increase since October.
The 6-month core services CPI, which irons out a lot of the month-to-month squiggles, accelerated to 4.4% annualized, the worst since June (red).
Some services raise their prices annually in January, and those price increases then help produce the spikes of the services CPI in January and February. But we did not see those kinds of price spikes in the Januarys and Februarys before the pandemic; they’re signs of persistent high inflation in services that had not occurred before the pandemic:
Housing components of core services.
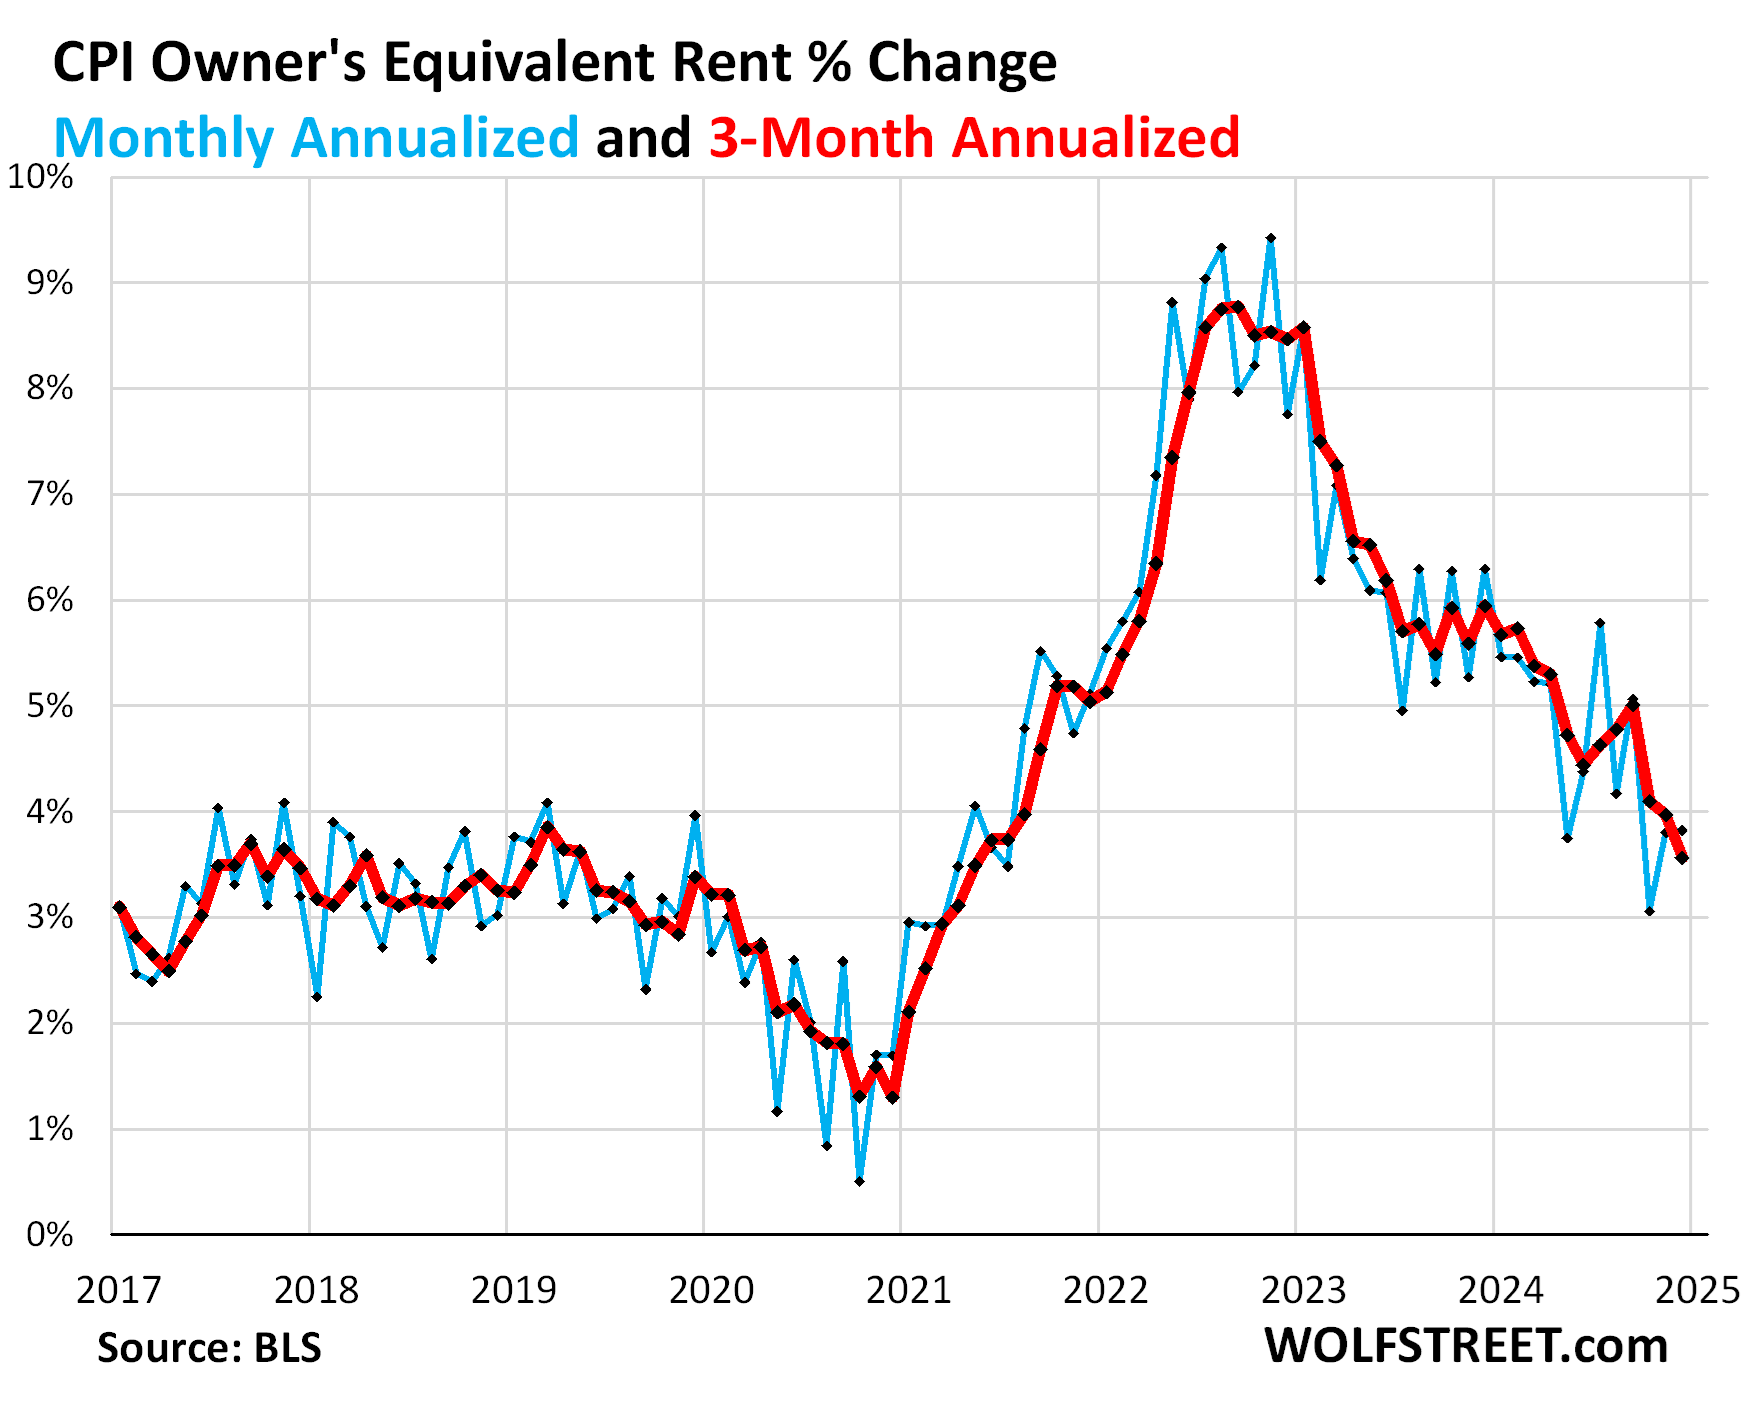
The Owners’ Equivalent of Rent CPI accelerated slightly to +3.8% annualized in January from December (+0.31% not annualized). The three-month average decelerated a hair to +3.6% annualized.
OER indirectly reflects the expenses of homeownership: homeowners’ insurance, HOA fees, property taxes, and maintenance. It’s the only measure for those expenses in the CPI. It is based on what a large group of homeowners estimates their home would rent for, with the assumption that a homeowner would want to recoup their cost increases by raising the rent.
As a stand-in for homeowners’ insurance, HOA fees, property taxes, and maintenance costs, OER accounts for 26.3% of overall CPI and estimates inflation of shelter as a service for homeowners.
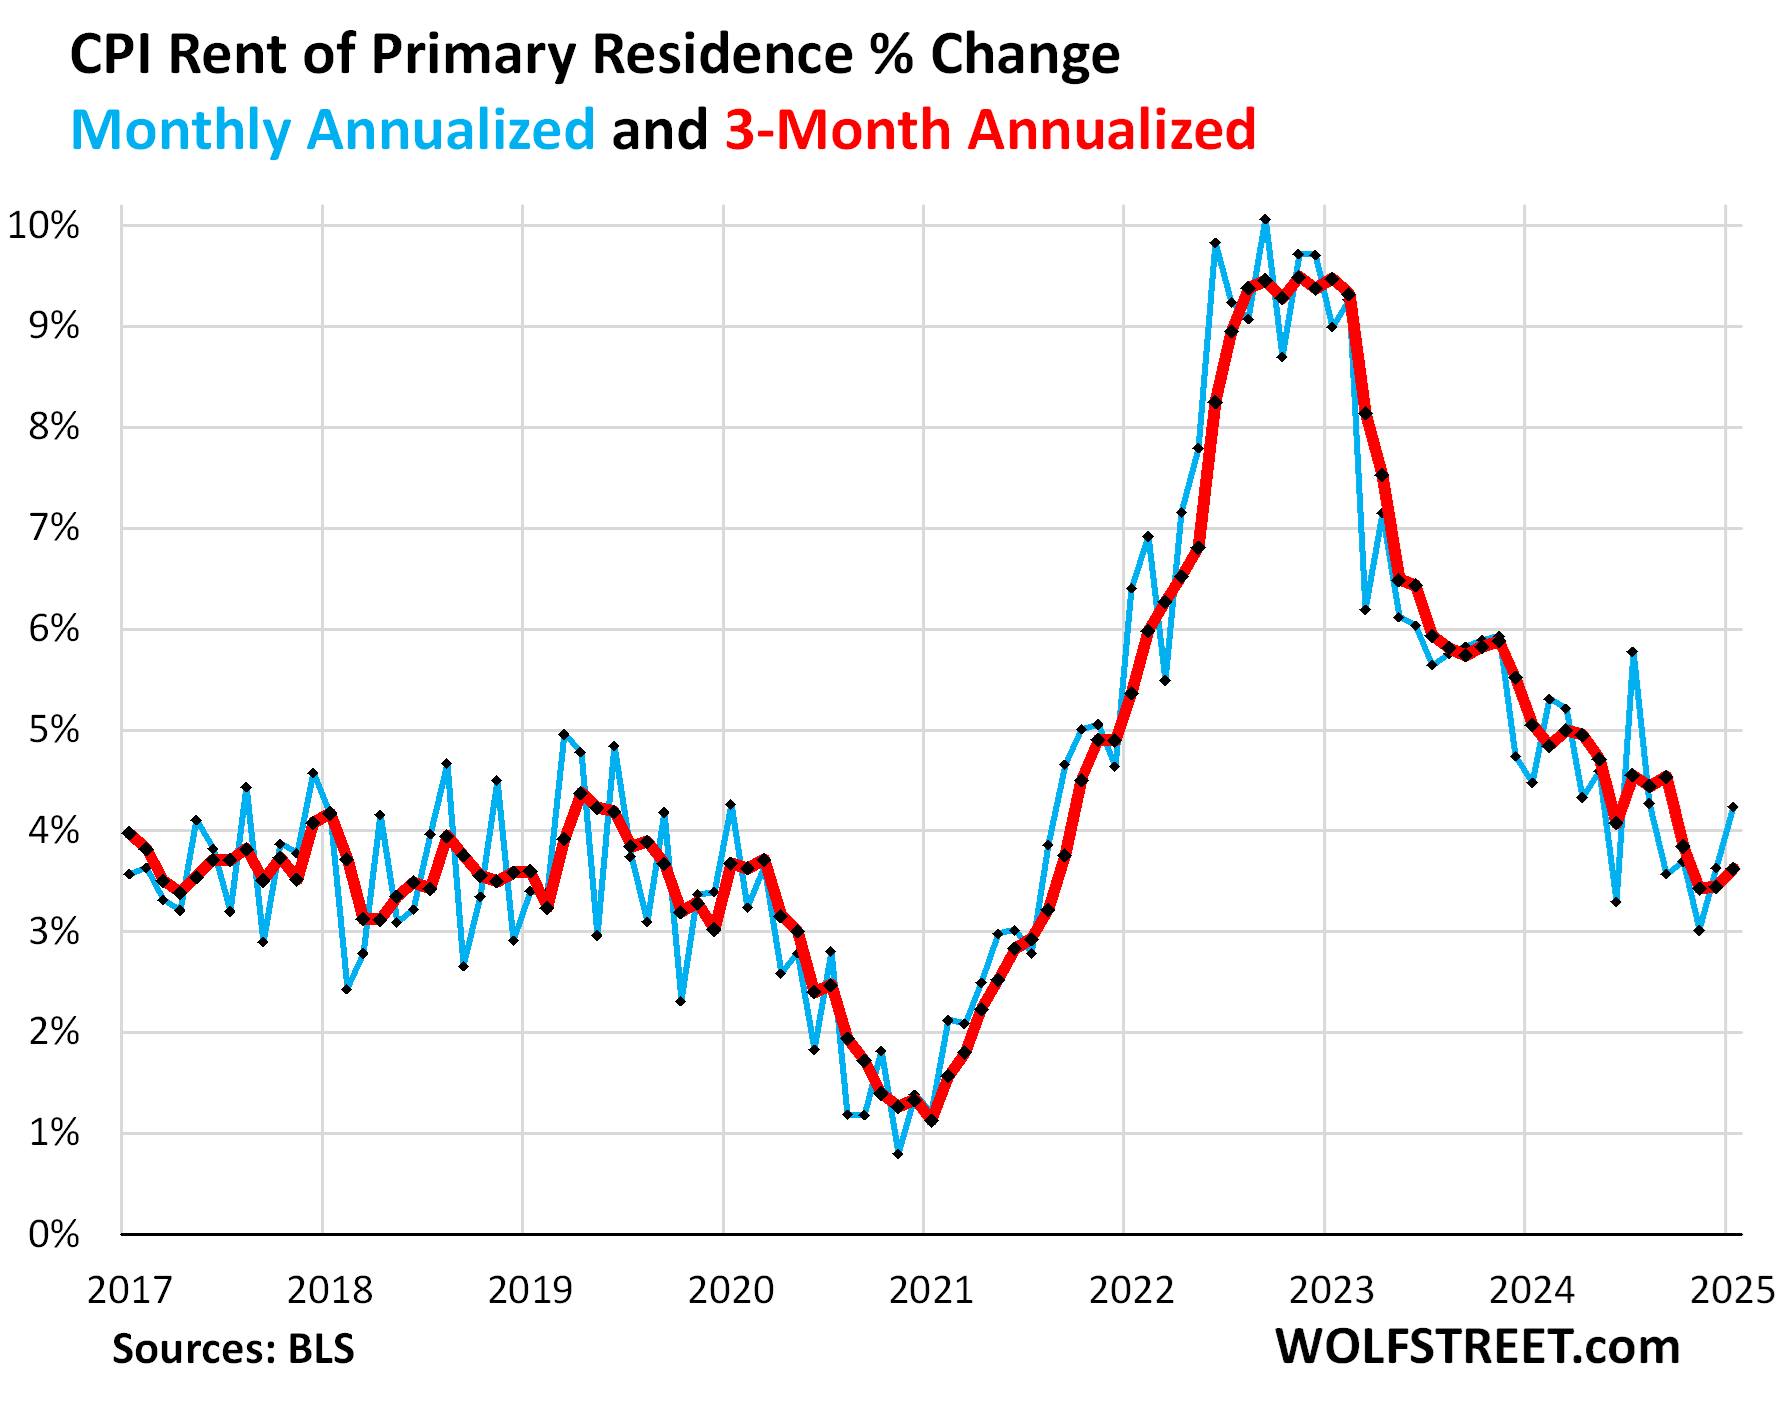
Rent of Primary Residence CPI accelerated to +4.2% annualized in January from December. The 3-month rate accelerated to +3.6%.
Rent CPI accounts for 7.5% of overall CPI. It is based on rents that tenants actually paid, not on asking rents of advertised vacant units for rent. The survey follows the same large group of rental houses and apartments over time and tracks the rents that the current tenants, who come and go, pay in rent for these units.
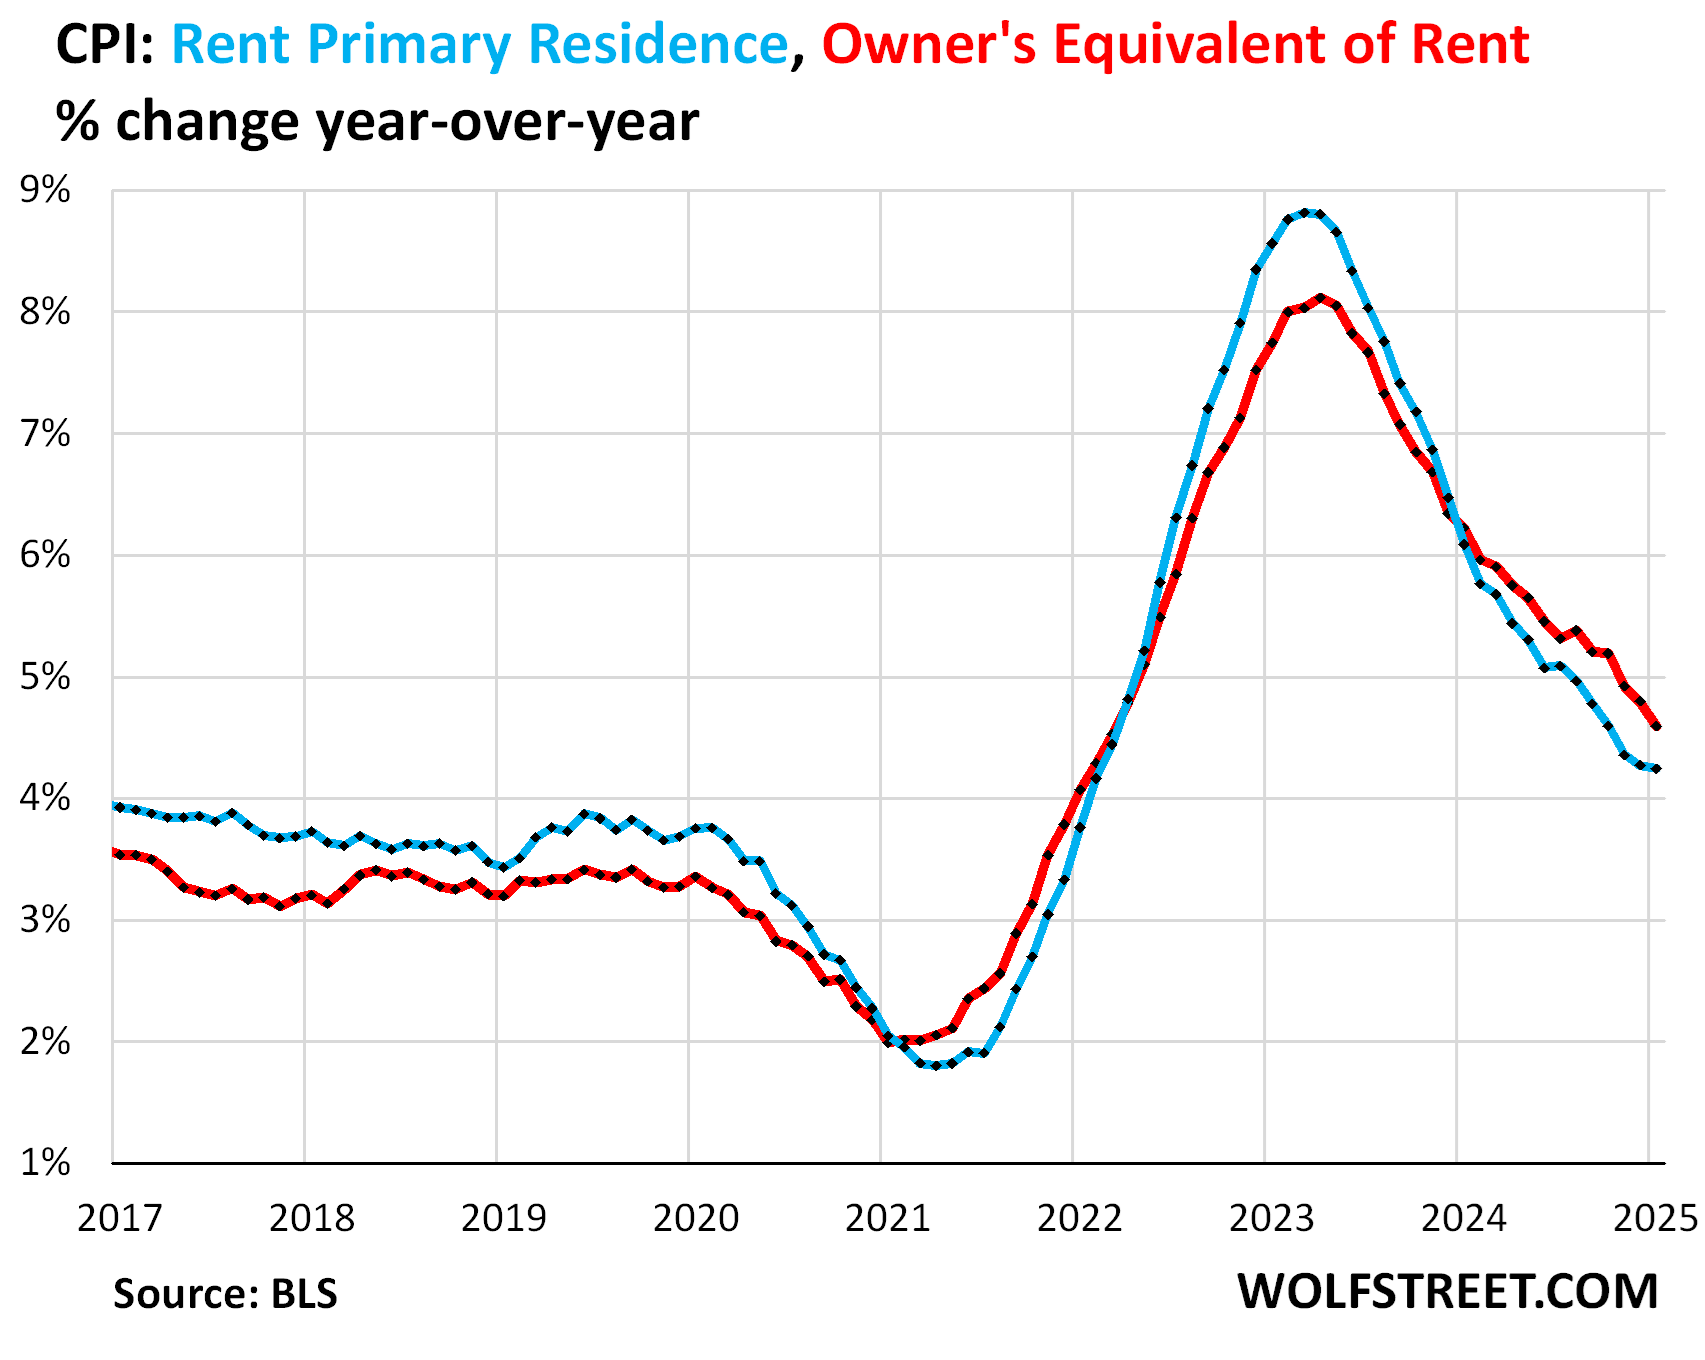
Year-over-year, rent CPI (blue in the chart below) barely budged in January at +4.24% from +4.27% in December. OER CPI decelerated to +4.6% in January from +4.8% in December (red).
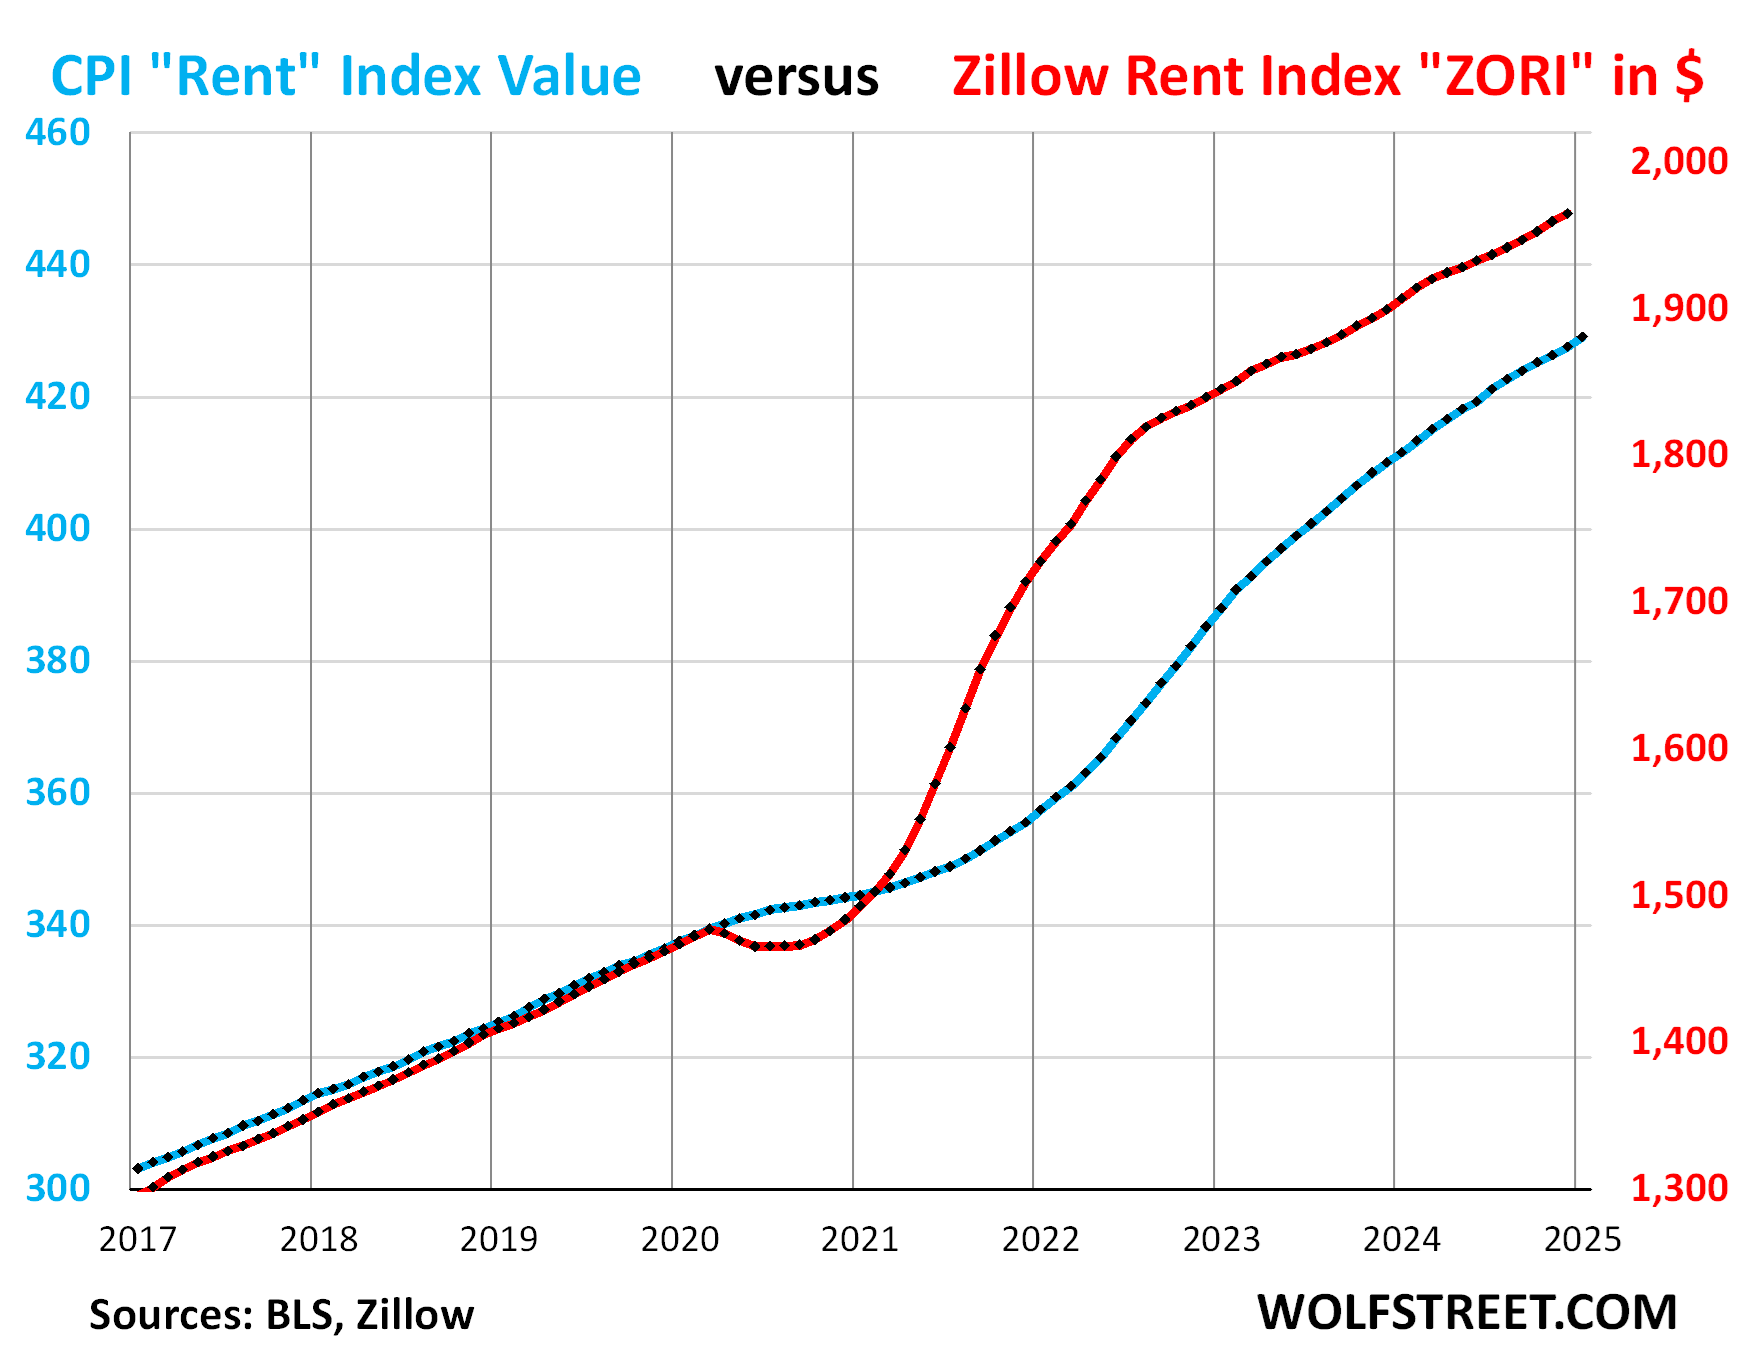
“Asking rents…” The Zillow Observed Rent Index (ZORI) and other private-sector rent indices track “asking rents,” which are advertised rents of vacant units on the market for rent. Because rentals don’t turn over that much, the spike in asking rents through mid-2022 never fully translated into the CPI indices because not many people actually ended up paying those jacked-up asking rents.
For December, the ZORI (seasonally adjusted) rose by 0.28% month-to-month and by 3.4% year-over-year.
The chart shows the CPI Rent of Primary Residence (blue, left scale) as index value, not percentage change; and the ZORI in dollars (red, right scale). The left and right axes are set so that they both increase each by 55% from January 2017:
- Since January 2017: ZORI +52%, CPI Rent +42%.
- Since January 2020: ZORI +34%, CPI Rent +27%.
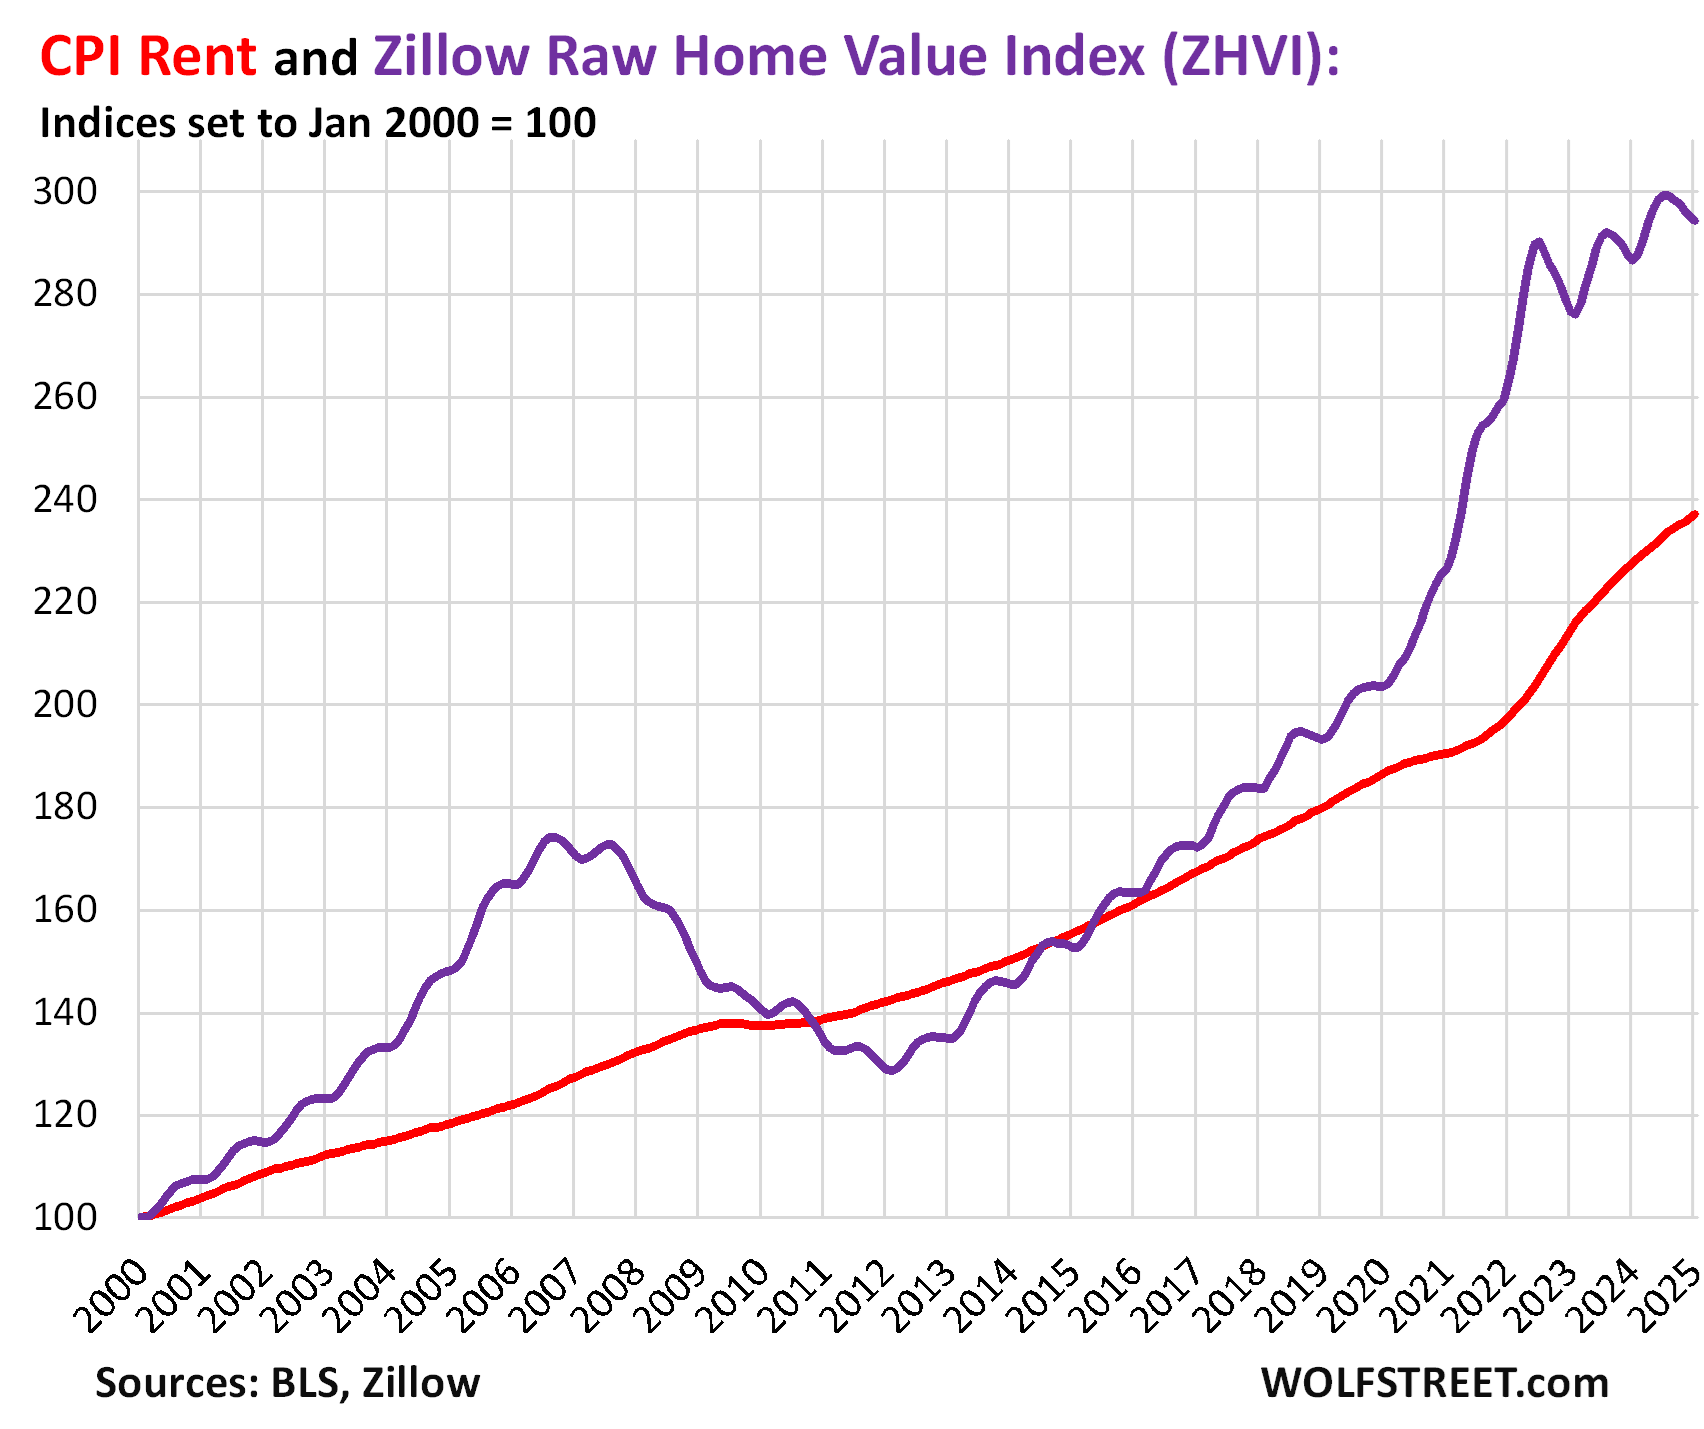
Rent inflation vs. home-price inflation: The red line in the chart below represents the CPI for Rent of Primary Residence as index value. The purple line represents Zillow’s “raw” Home Value Index for the US. Both indexes are set to 100 for January 2000 [home price inflation by metro: The Most Splendid Housing Bubbles in America ]:
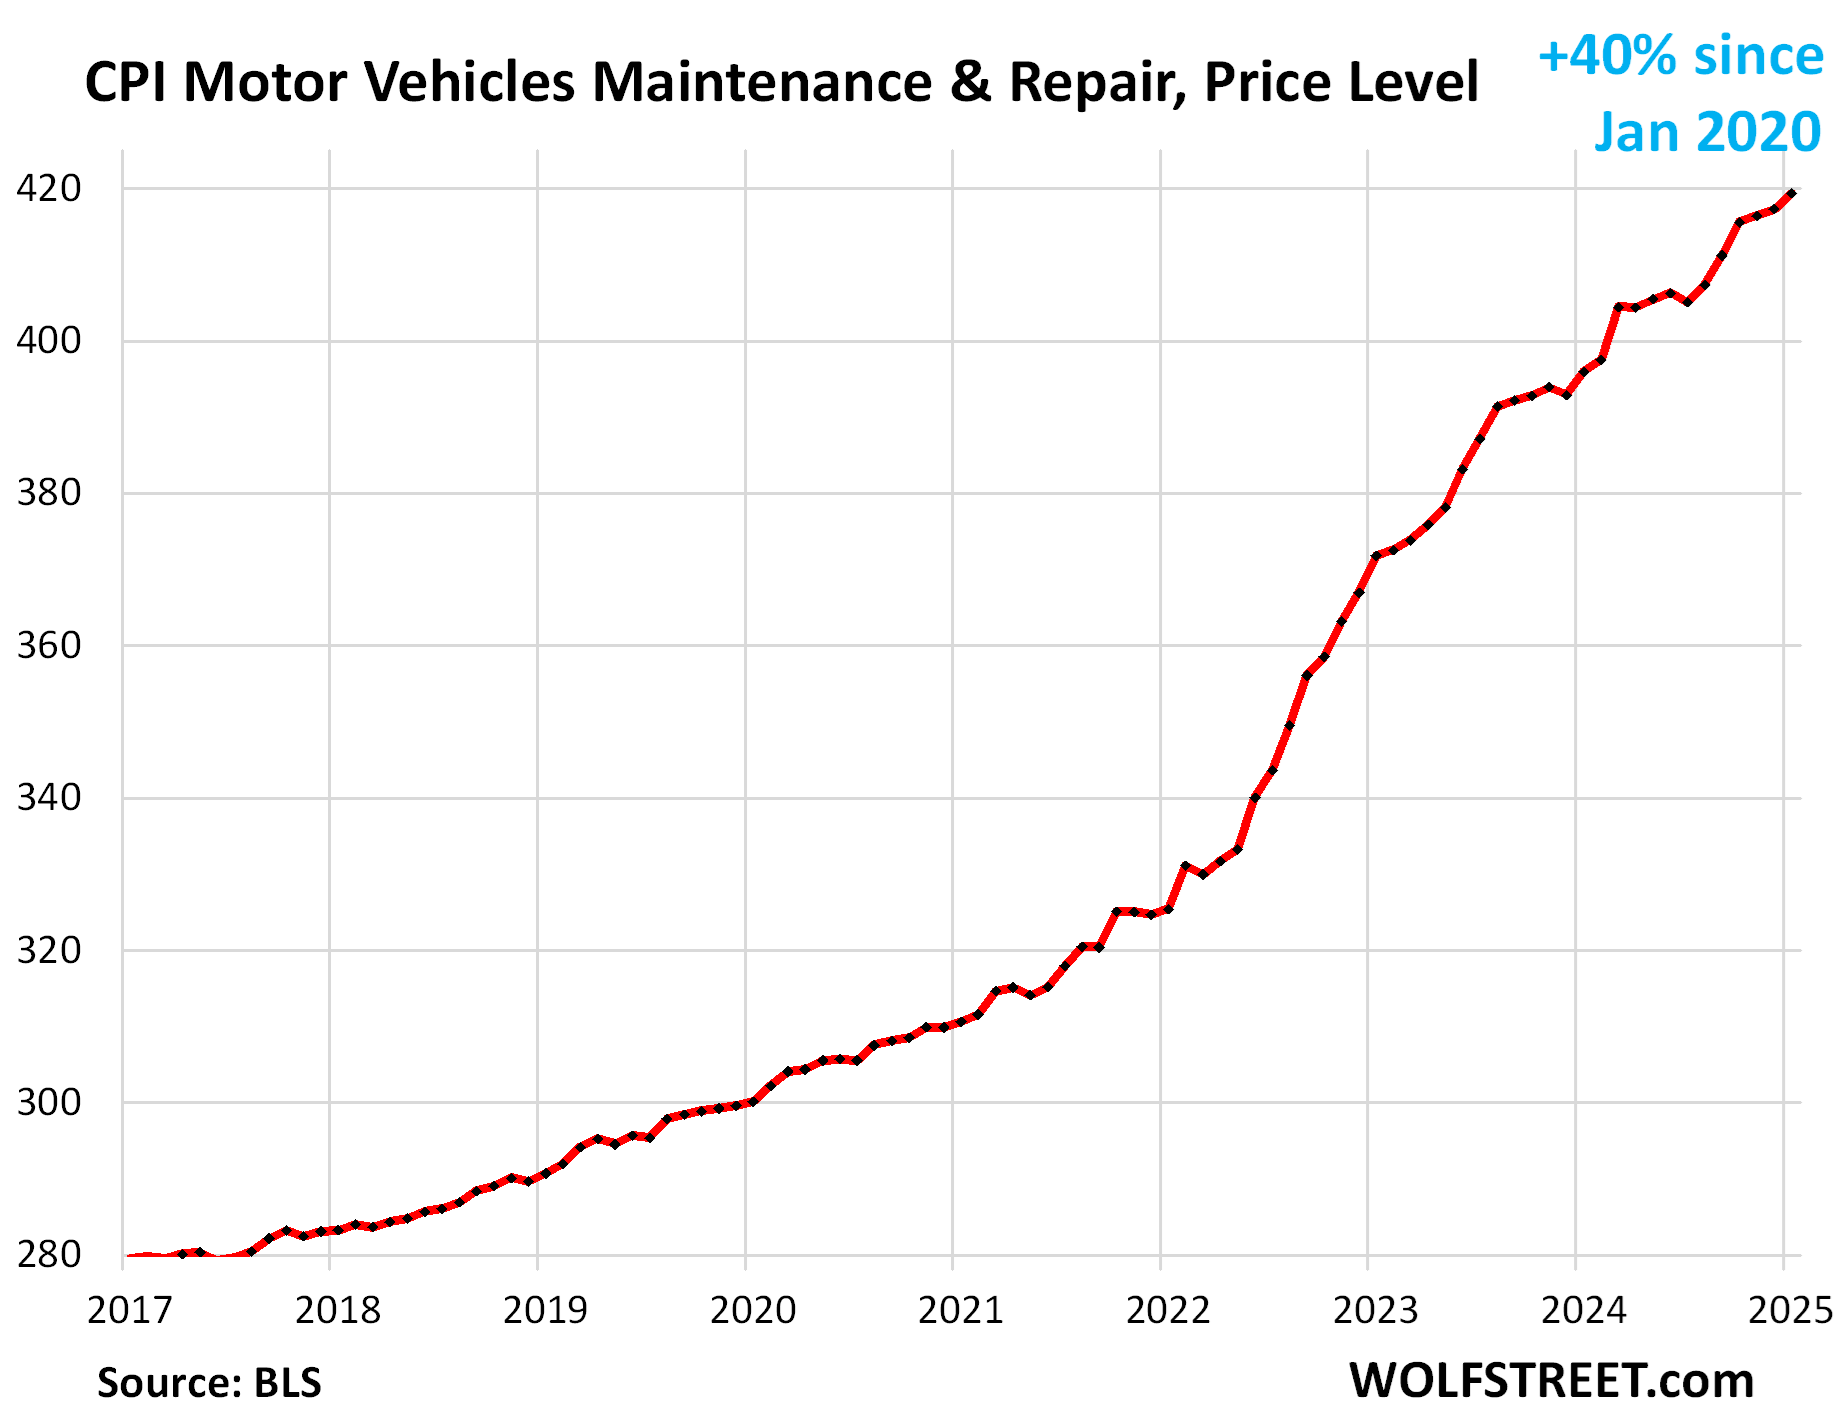
The CPI for motor-vehicle maintenance & repair jumped by 6.2% annualized in January from December. Year-over-year, the index rose by 5.9%, the worst increase since May. Since January 2020, the index has surged by 40%. This chart shows the price level, not the year-over-year percentage change:
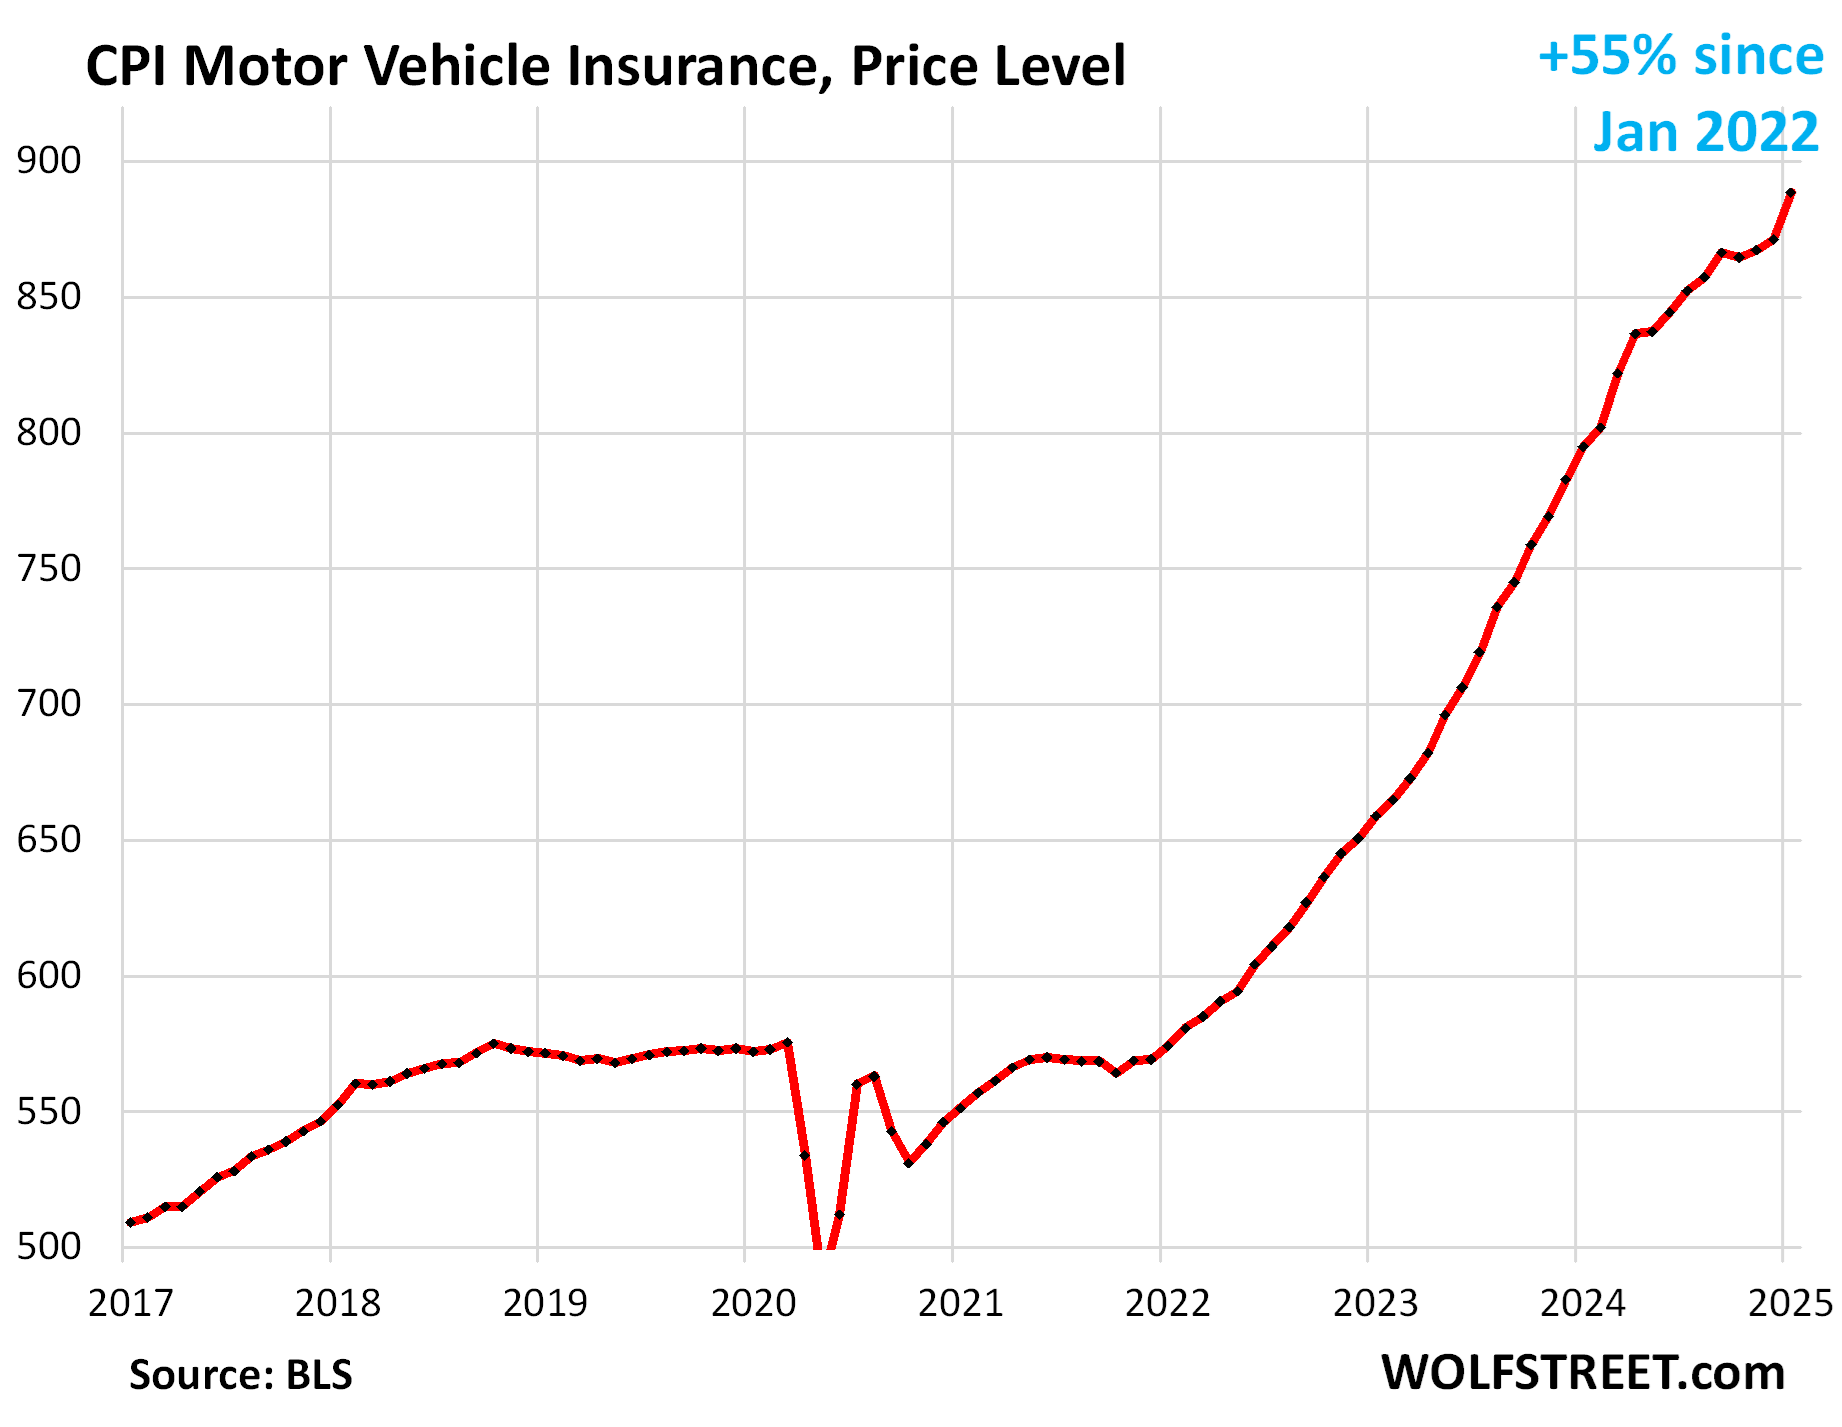
The CPI for motor vehicle insurance spiked by 26.7% annualized in January from December (2.0% not annualized), the worst increase since March 2024. Year-over-year, the index spiked by 11.8%.
Since January 2022, motor vehicle insurance prices have exploded by 55%, fueled by the historic spike in used vehicle prices in 2021 and 2022 (=replacement costs for insurance companies) and by surging repair costs.
Note the spike in January:
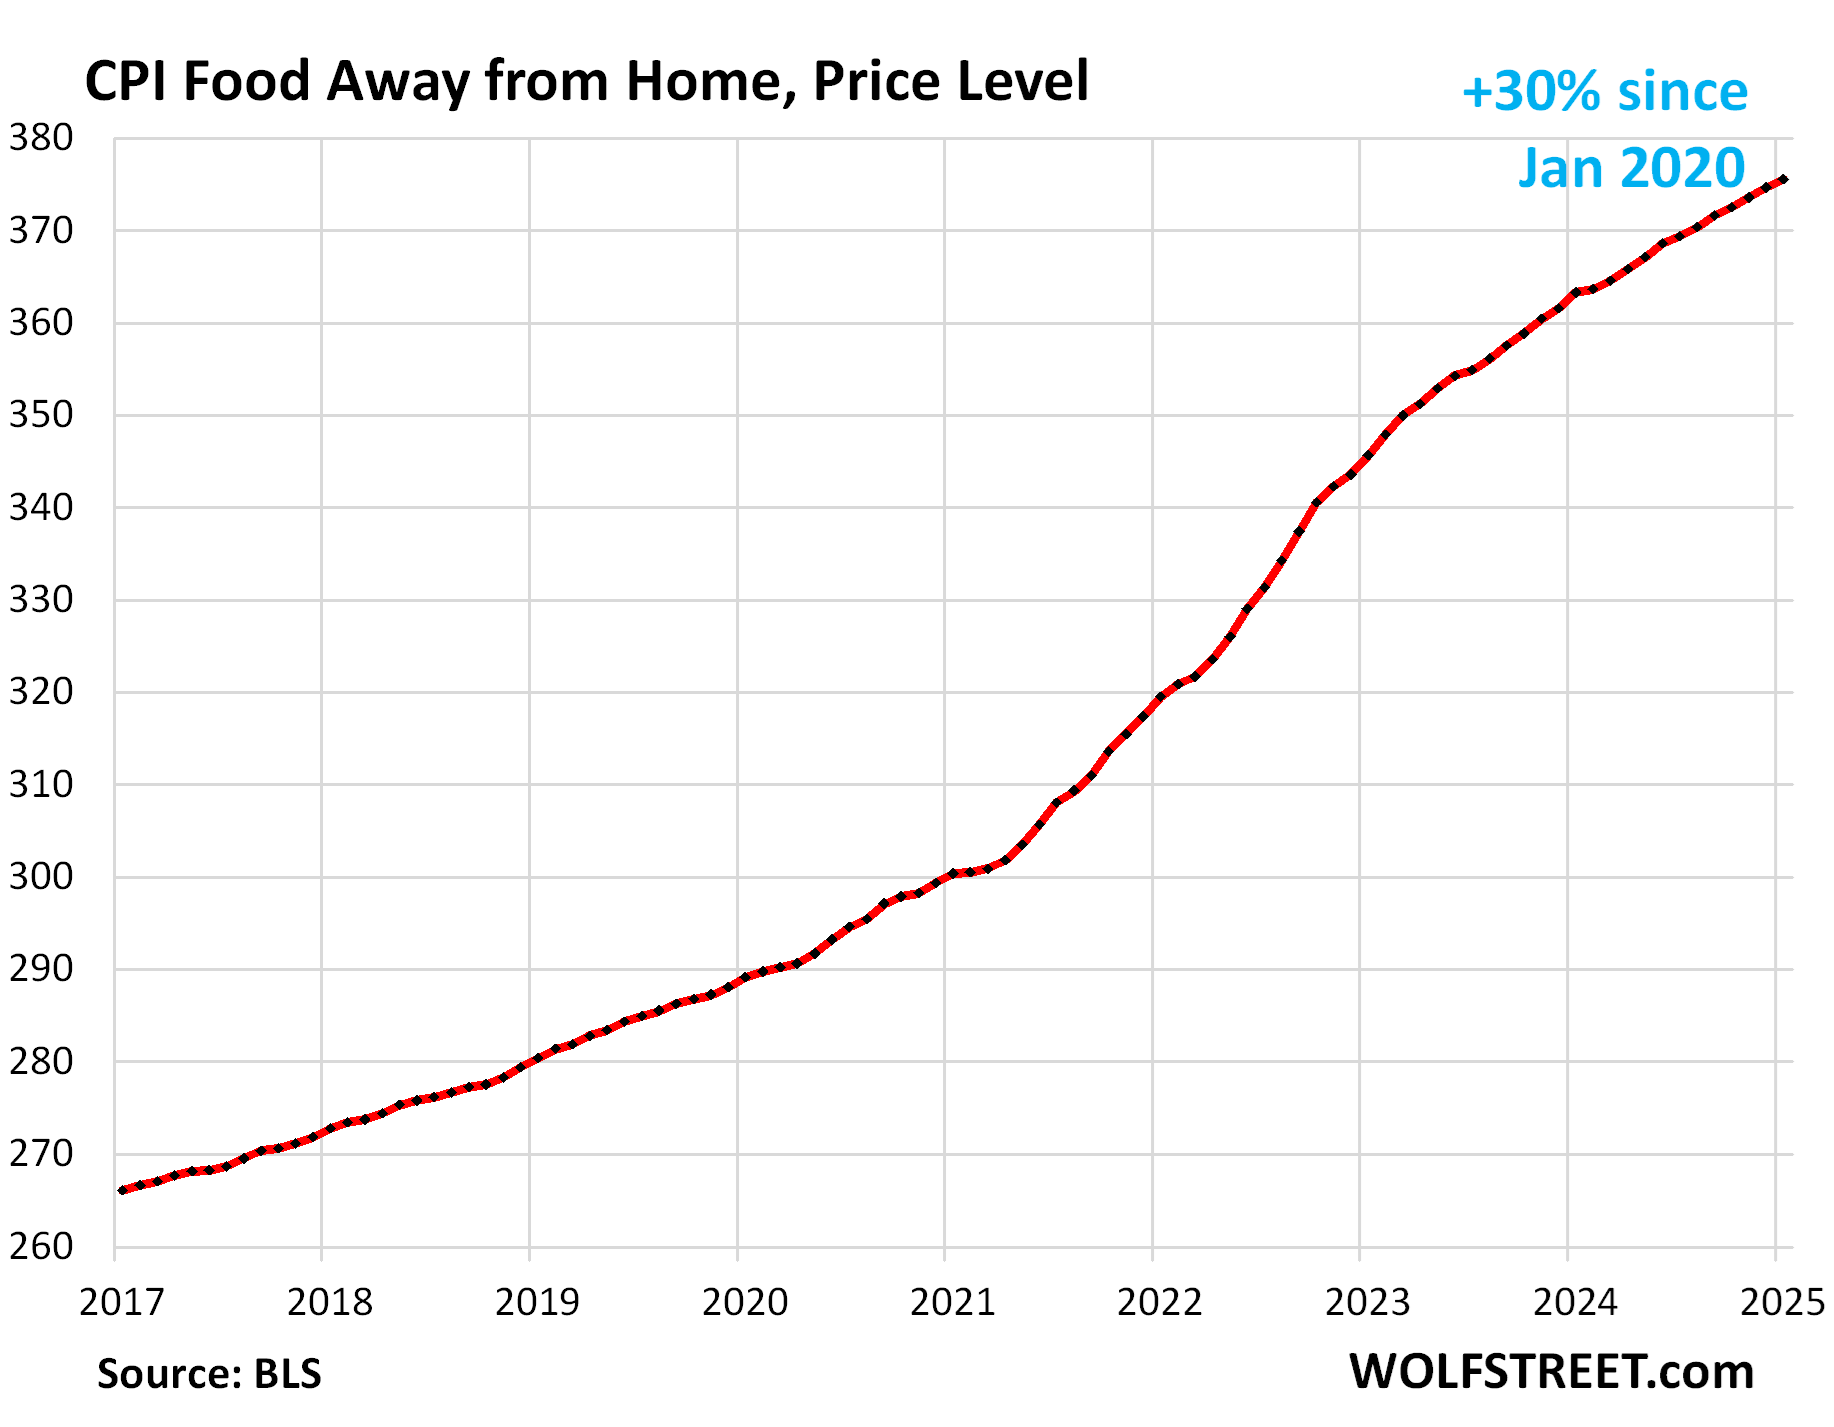
Food away from Home CPI rose by 2.9% annualized in January from December, and by 3.4% year-over-year, the smallest increase since July 2020.
These food services include full-service and limited-service meals and snacks served away from home, such as in restaurants, cafeterias, at stalls, etc.
The table below shows the major categories of “core services.” Combined, they accounted for 64% of total CPI:
| Major Services excluding Energy Services | Weight in CPI | MoM | YoY |
| Core Services | 64% | 0.3% | 4.8% |
| Owner’s equivalent of rent | 26.3% | 0.3% | 4.6% |
| Rent of primary residence | 7.5% | 0.3% | 4.2% |
| Medical care services & insurance | 6.7% | 0.0% | 2.7% |
| Food services (food away from home) | 5.6% | 0.2% | 3.4% |
| Motor vehicle insurance | 2.8% | 2.0% | 11.8% |
| Education (tuition, childcare, school fees) | 2.5% | 0.2% | 3.6% |
| Admission, movies, concerts, sports events, club memberships | 2.1% | 1.5% | 4.0% |
| Other personal services (dry-cleaning, haircuts, legal services…) | 1.6% | -0.5% | 2.3% |
| Public transportation (airline fares, etc.) | 1.5% | 0.7% | 4.9% |
| Telephone & wireless services | 1.5% | 0.2% | 0.0% |
| Lodging away from home, incl Hotels, motels | 1.3% | 1.4% | 2.2% |
| Water, sewer, trash collection services | 1.1% | 0.7% | 4.4% |
| Motor vehicle maintenance & repair | 1.0% | 0.5% | 5.9% |
| Internet services | 0.9% | 1.1% | -0.5% |
| Video and audio services, cable, streaming | 0.8% | 2.0% | 3.2% |
| Pet services, including veterinary | 0.5% | 0.1% | 5.9% |
| Tenants’ & Household insurance | 0.4% | 1.1% | 2.1% |
| Car and truck rental | 0.1% | 1.7% | -3.6% |
| Postage & delivery services | 0.1% | -1.2% | 7.6% |
The core services CPI overall has risen by 24% since January 2020.
Prices of Goods.
The used vehicle CPI jumped by 2.2% not annualized (29.7% annualized) in January from December, seasonally adjusted, the fifth month-to-month increase in a row, and the worst since May 2023 (red in the chart below).
Not seasonally adjusted, the index jumped 0.5% not annualized (6.5% annualized), though it would normally decline in January (blue).
The surge over the past five months has flipped the 10% year-over-year plunges in June and July into a year-over-year increase of 1.0%, the first year-over-year increase since October 2022 back when the historic price spike was unwinding.
The plunge of used vehicle retail prices from early 2022 through August 2024 was a powerful factor in the cooling of CPI inflation. But this U-turn has now become fuel for the re-acceleration of overall inflation, amid structurally tight retail inventories, strong demand, and surging wholesale prices.
Prices are still up by 33% from January 2020, and it now seems unlikely that they will give up more of the pandemic price spike.

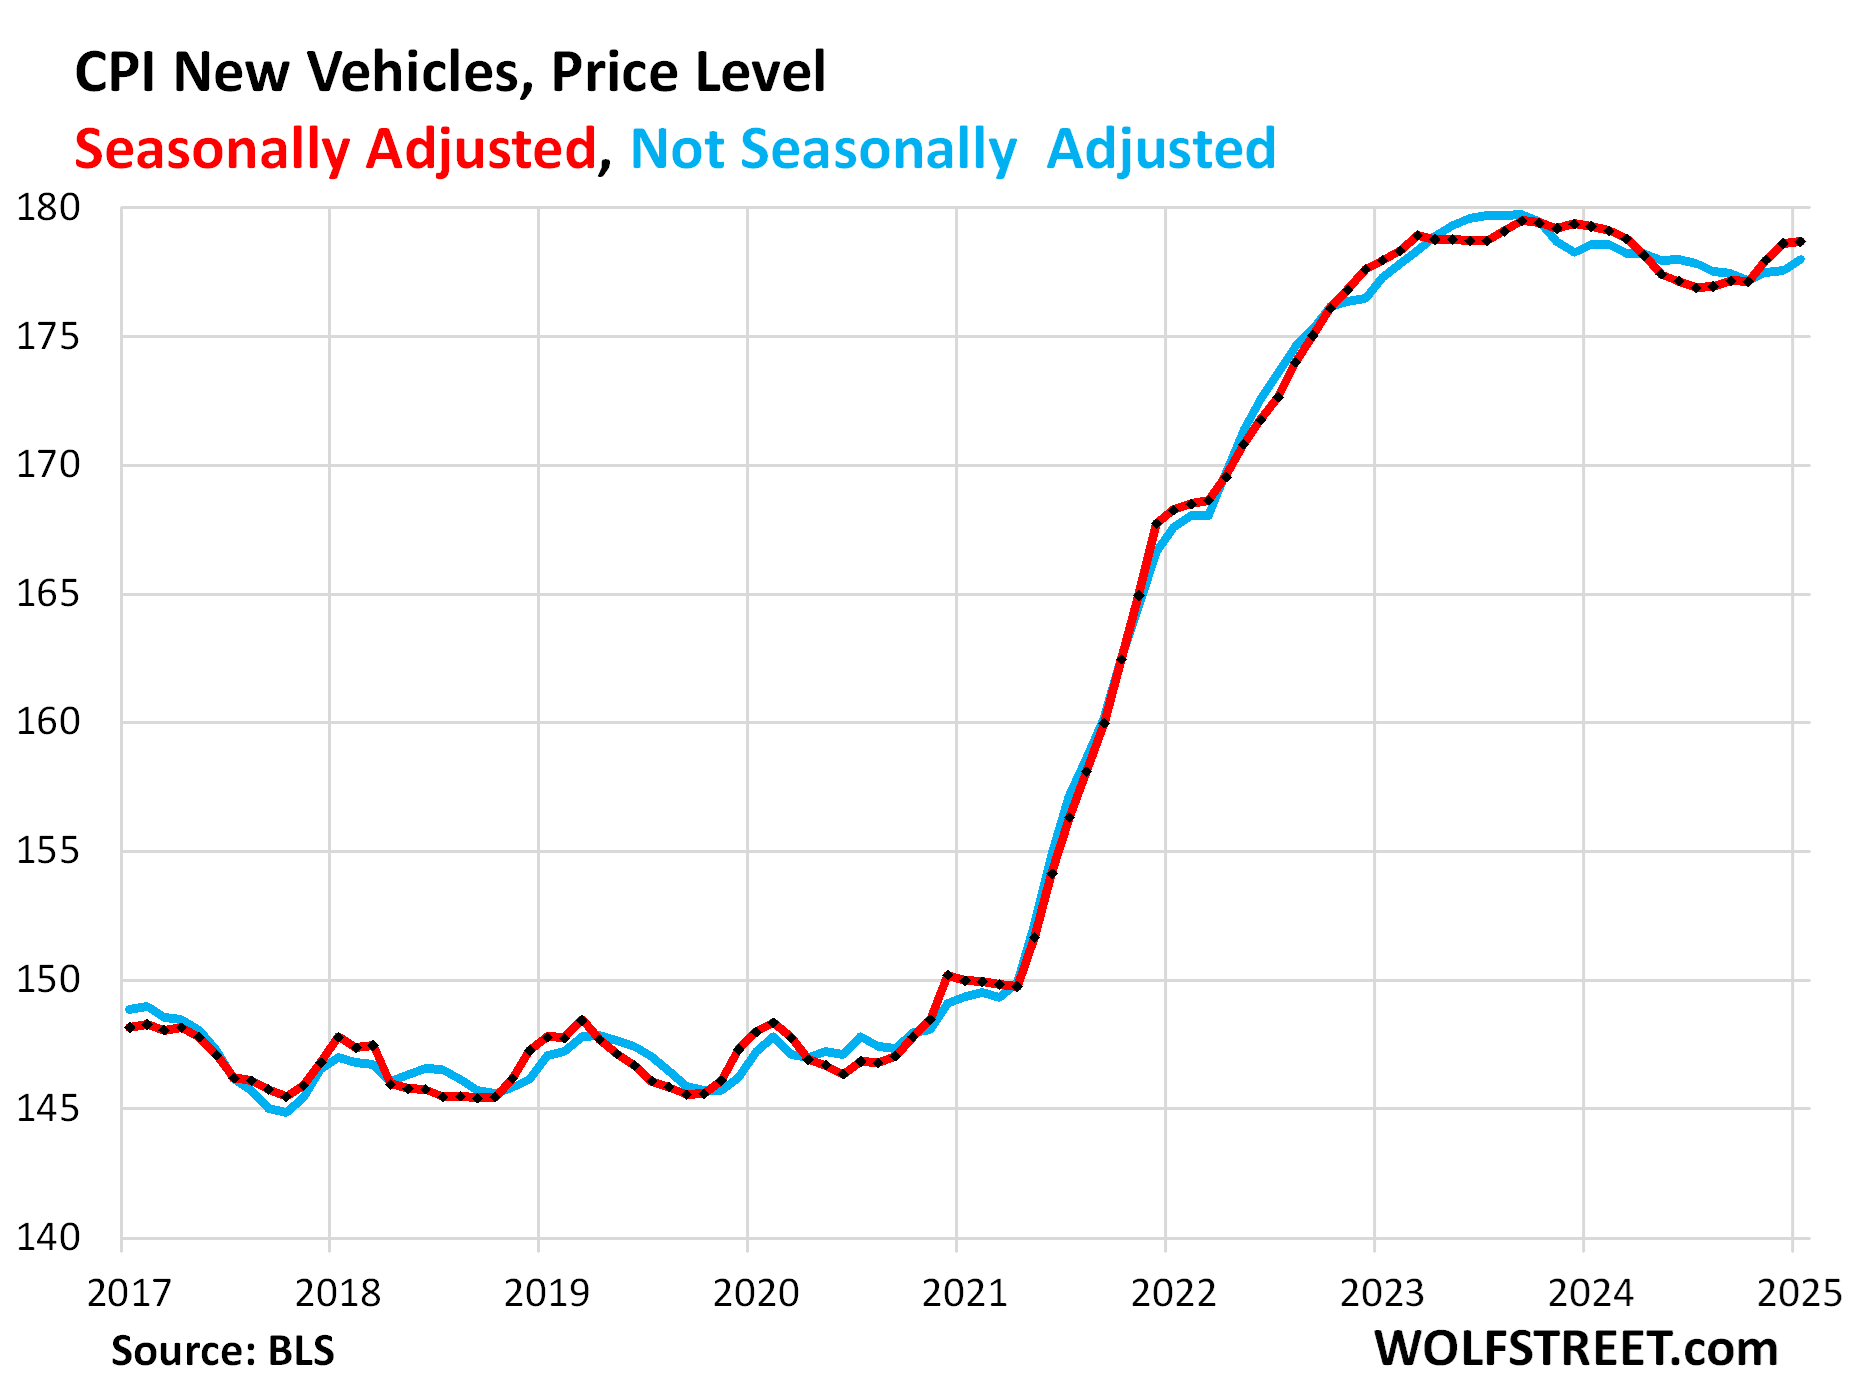
New vehicles CPI edged up by a hair in January from December, seasonally adjusted. Not seasonally adjusted, the index rose by 0.26% (not annualized). This whittled down the year-over-year drop to just 0.3%.
New-vehicle prices have been sticky, unlike used-vehicle prices, despite abundant supply of new vehicles now on many lots, as automakers and dealers are trying to preserve their profit margins. The big incentives and discounts in recent months mostly just undid part of the increases in MSRPs. Since January 2020, the index is up 20.7%.
Durable Goods are dominated by new and used vehicles. Starting in mid- to late 2022, all major durable goods categories experienced price declines (deflation), off the price spike during the pandemic. But the month-to-month price drops in motor vehicles ended months ago, and prices have risen since then. And the other major categories of durable goods prices have slowed or ended their month-to-month declines:
| Major durable goods categories | MoM | YoY |
| Durable goods overall | 0.4% | -1.2% |
| New vehicles | 0.0% | -0.3% |
| Used vehicles | 2.2% | 1.0% |
| Household furnishings (furniture, appliances, floor coverings, tools) | -0.2% | -0.9% |
| Sporting goods (bicycles, equipment, etc.) | 0.2% | -3.8% |
| Information technology (computers, smartphones, etc.) | 0.0% | -8.2% |
Food Inflation.
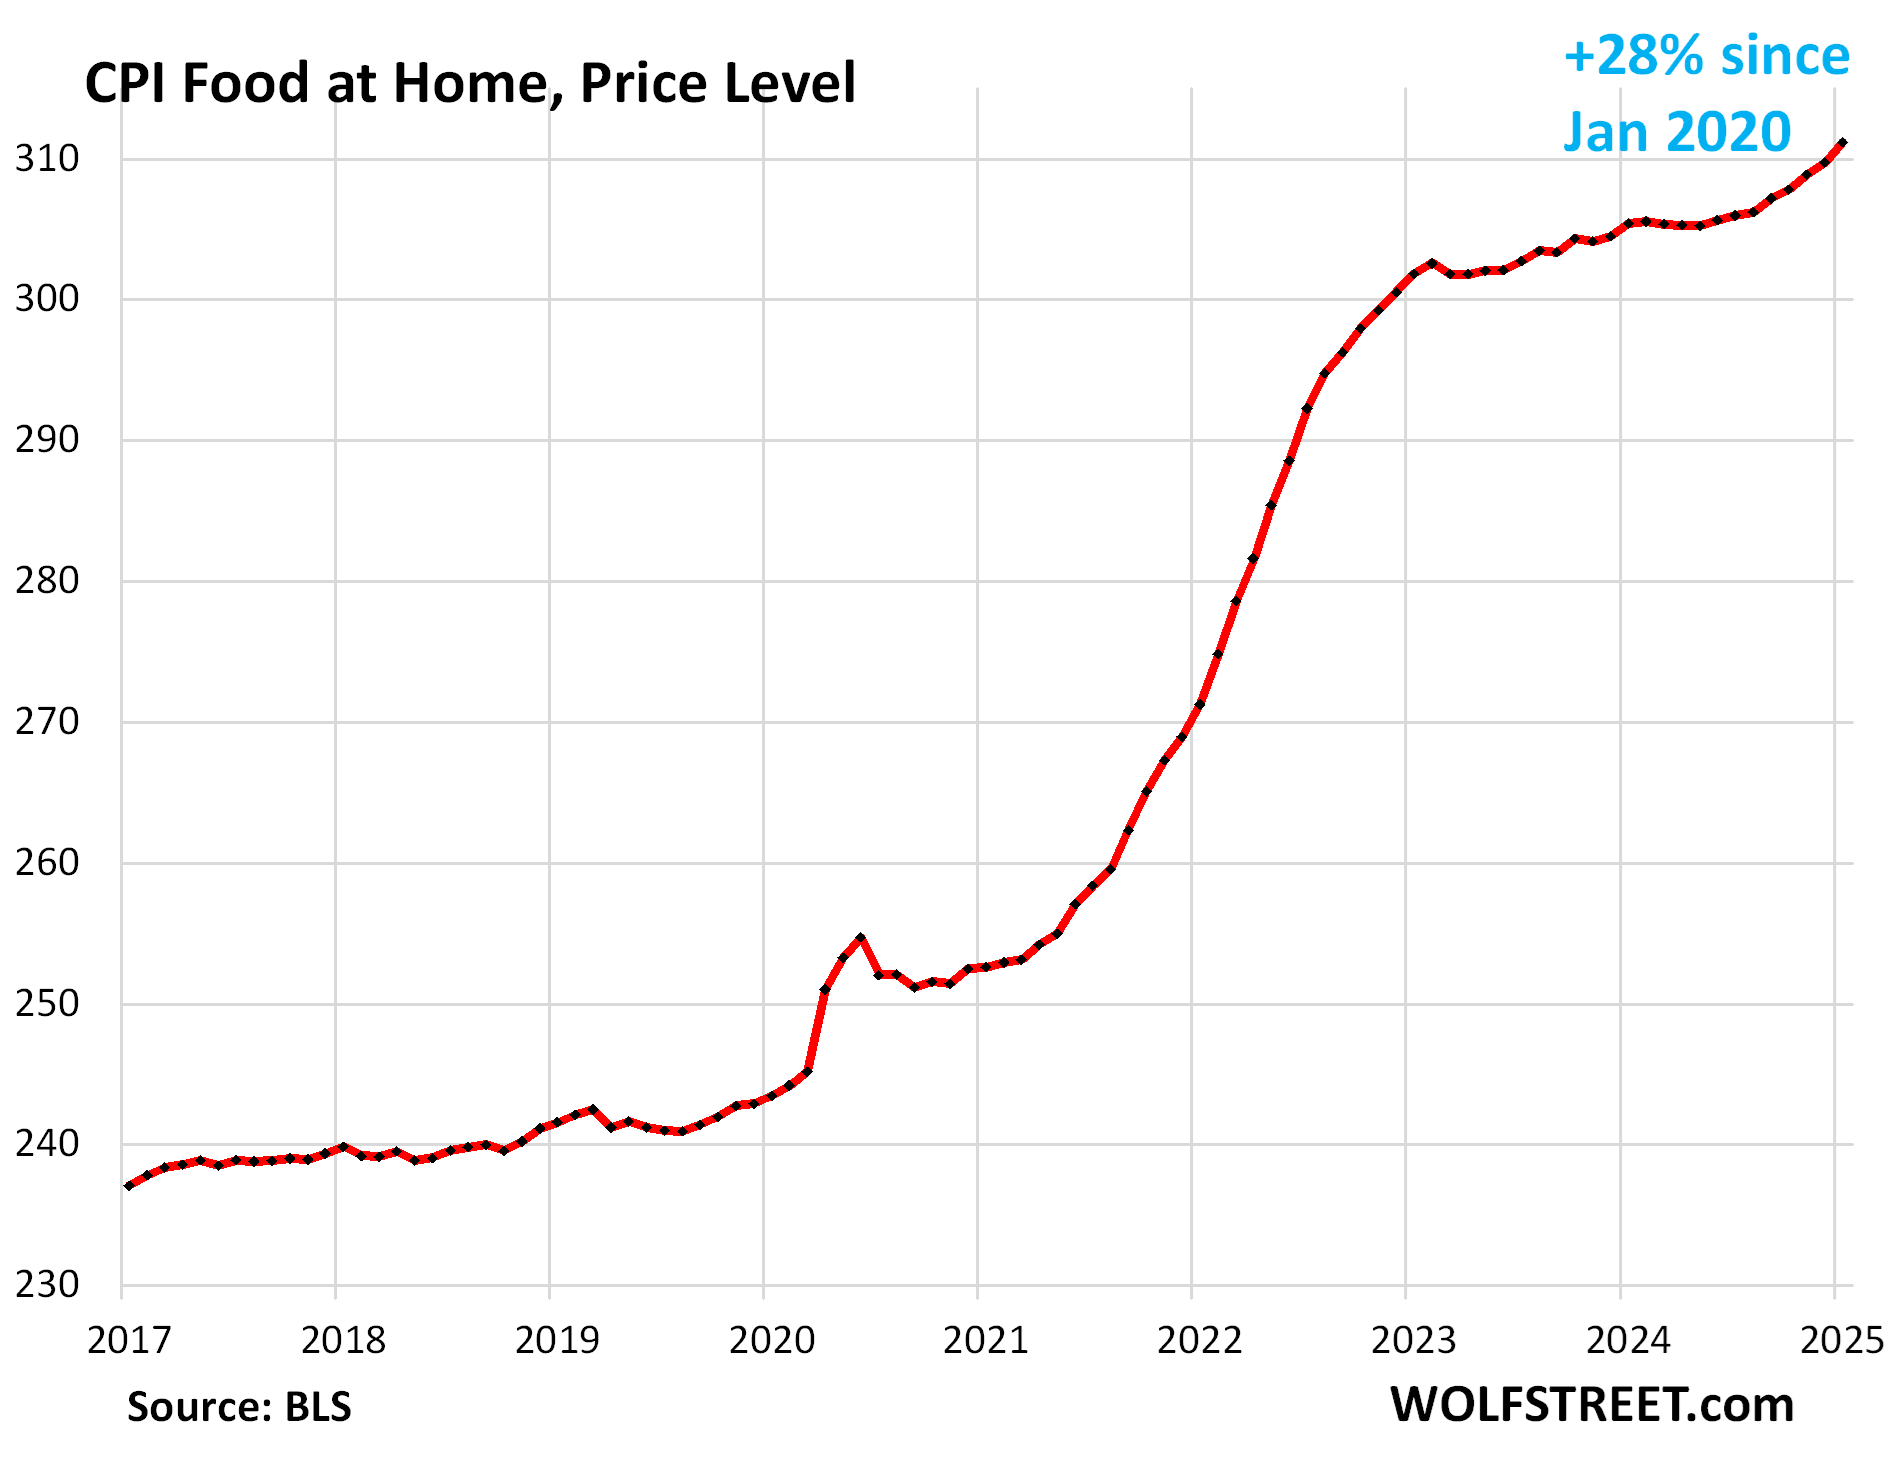
The CPI for “Food at home” – purchased at stores and markets and eaten off premises – jumped by 5.7% annualized in January from December (+0.46% not annualized), the worst increase since October 2022.
This pushed the year-over-year price increase to 1.9%, the biggest increase since October 2023. Since January 2020, food prices have surged by 28%.
After a brief lull at painfully high price levels, food price inflation has been re-accelerating sharply for the past five months.
Part of this re-acceleration is due to the spiking prices for eggs, where the avian flu has been wreaking havoc since early 2024.
Beyond eggs, big month-to-month increases also occurred with beef, pork, fish and seafood, fresh fruit, and juices and nonalcoholic drinks.
| MoM | YoY | |
| Food at home | 0.5% | 1.9% |
| Cereals, breads, bakery products | -0.4% | 0.4% |
| Beef and veal | 0.7% | 5.5% |
| Pork | 0.7% | 2.8% |
| Poultry | -0.1% | 0.4% |
| Fish and seafood | 0.8% | 0.9% |
| Eggs | 15.2% | 53.0% |
| Dairy and related products | 0.3% | 1.2% |
| Fresh fruits | 0.5% | 1.4% |
| Fresh vegetables | -1.7% | -0.6% |
| Juices and nonalcoholic drinks | 1.1% | 1.9% |
| Coffee, tea, etc. | -0.1% | 3.1% |
| Fats and oils | 0.1% | 0.4% |
| Baby food & formula | -0.3% | 1.1% |
| Alcoholic beverages at home | 0.1% | 0.8% |
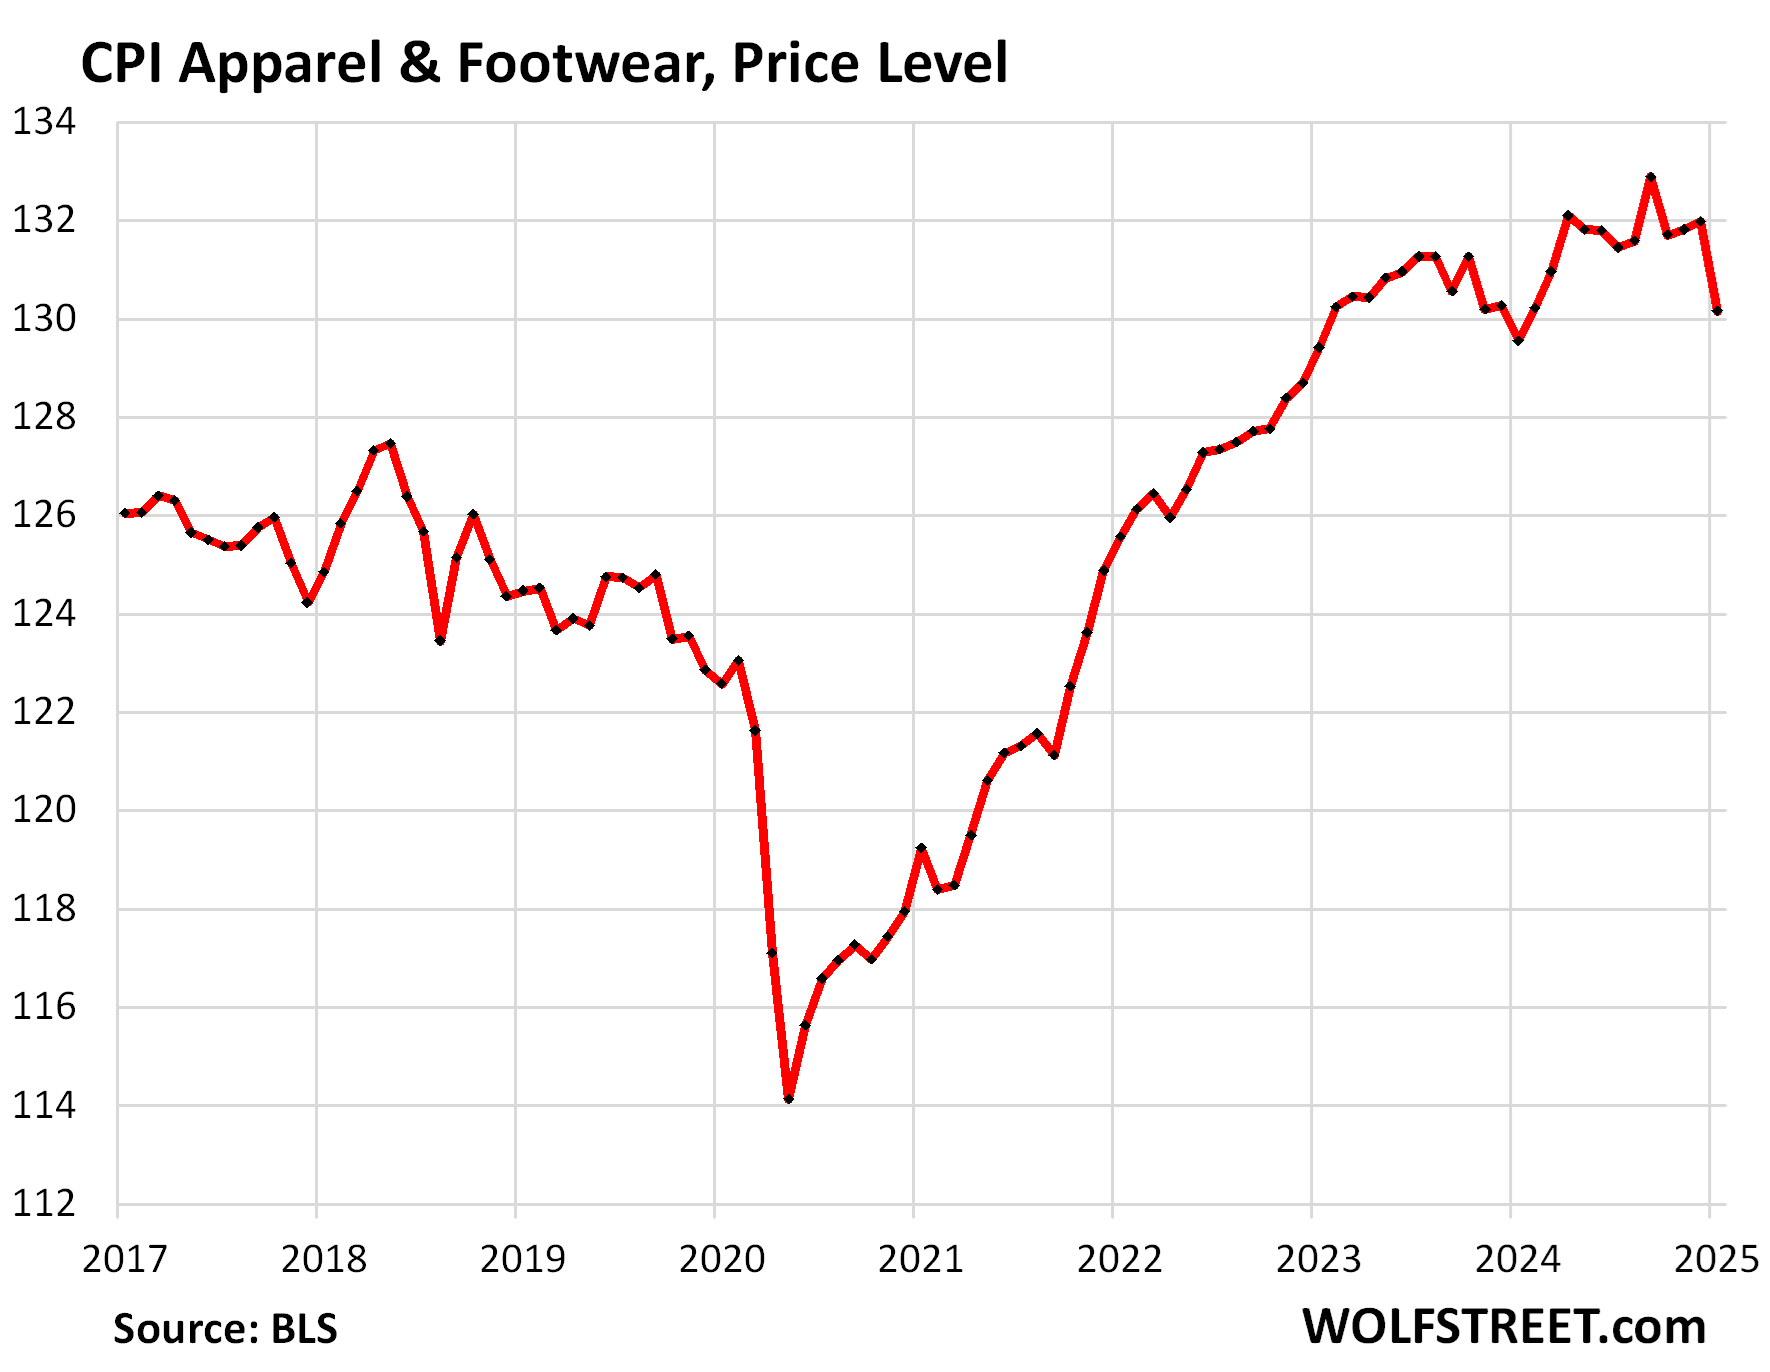
Apparel and footwear.
The CPI for apparel and footwear dropped by 1.4% (not annualized) in January from December, which reduced the year-over-year increase to 0.5%.
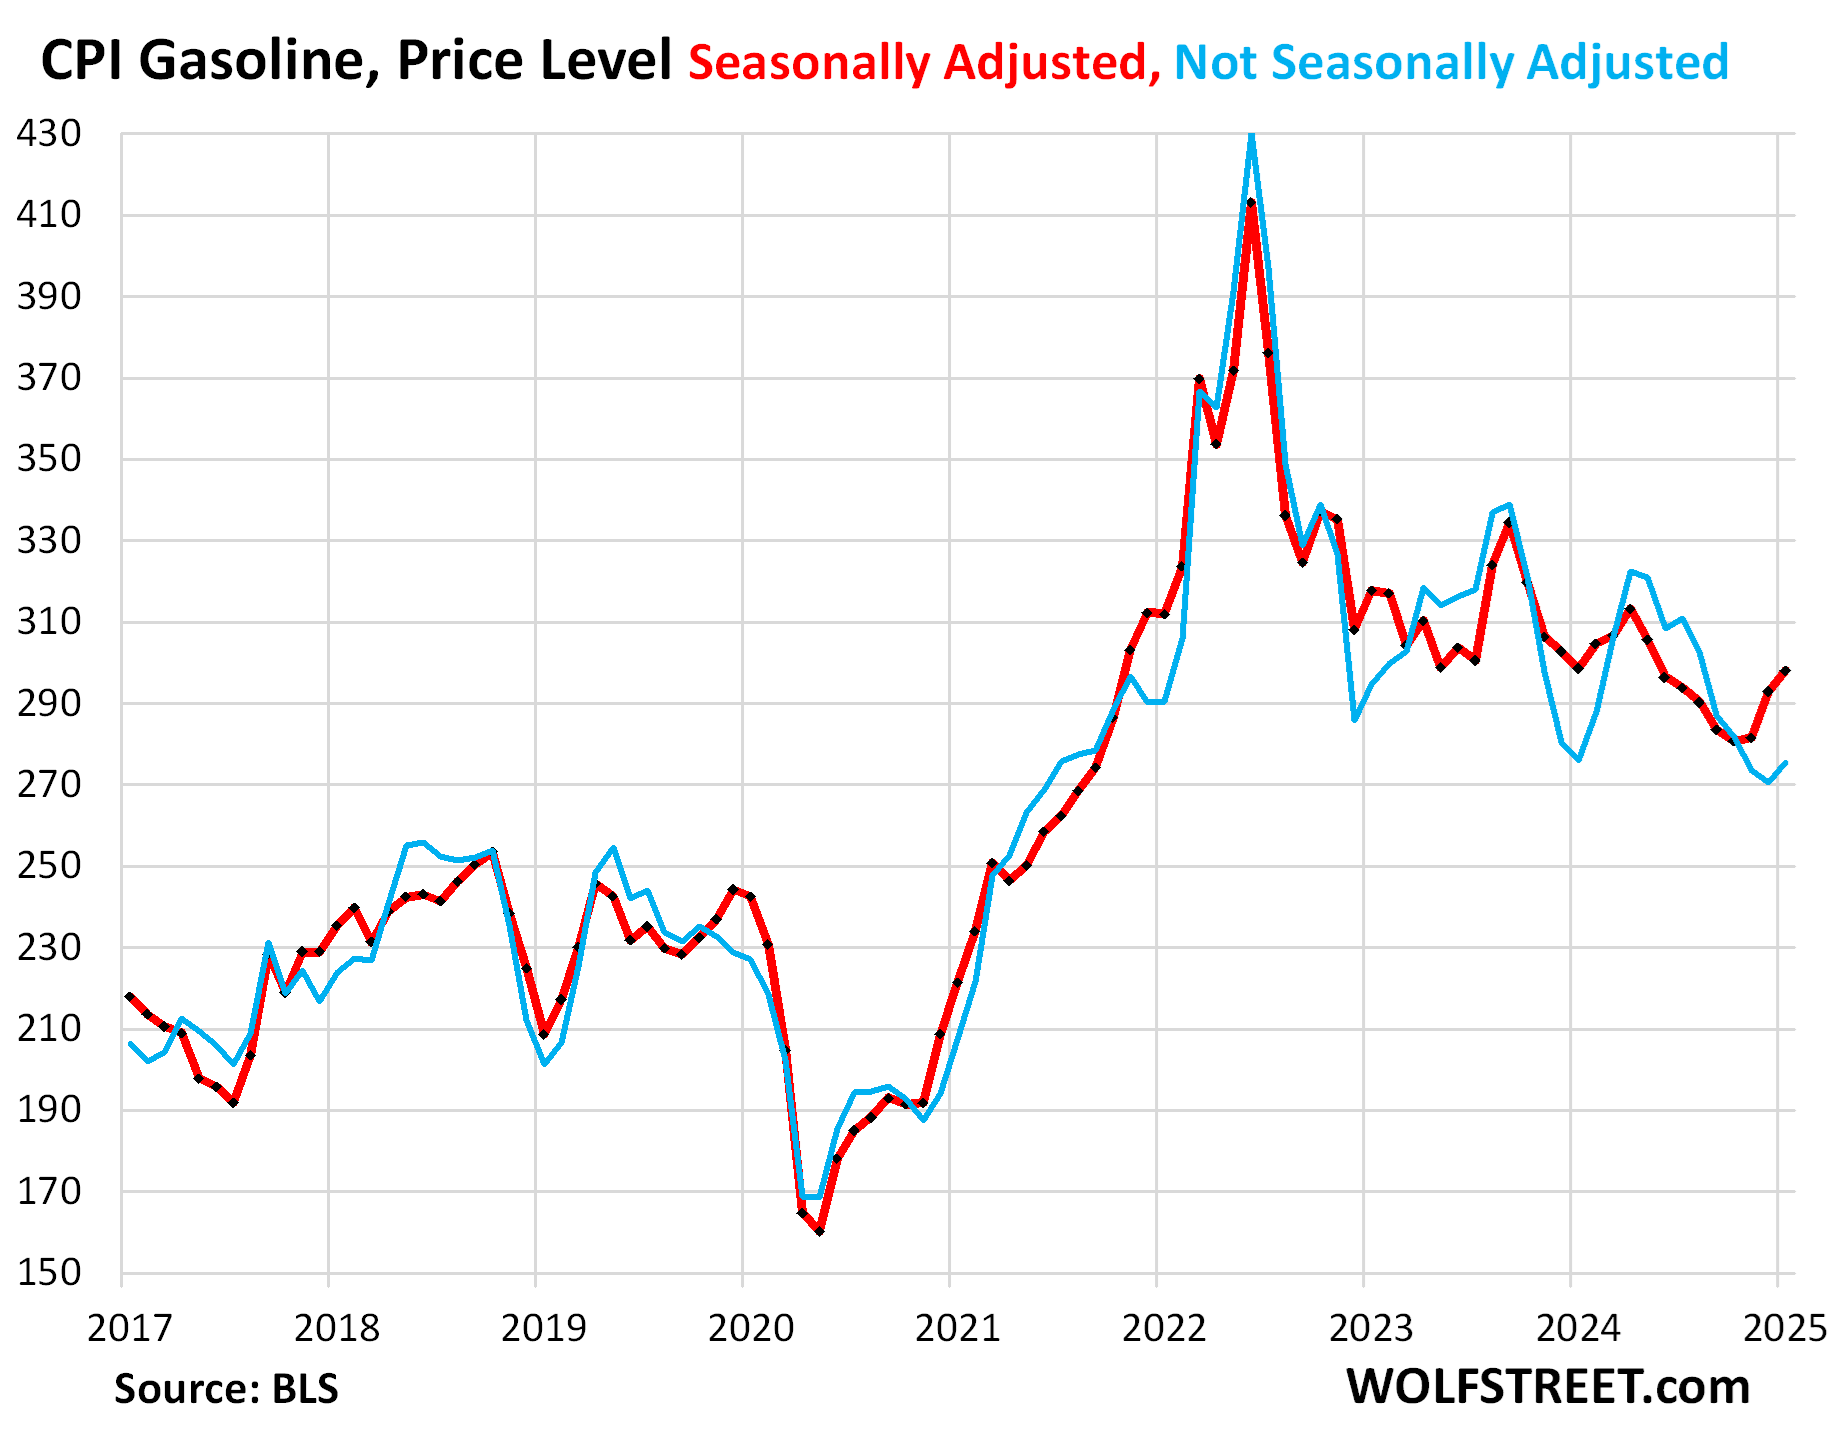
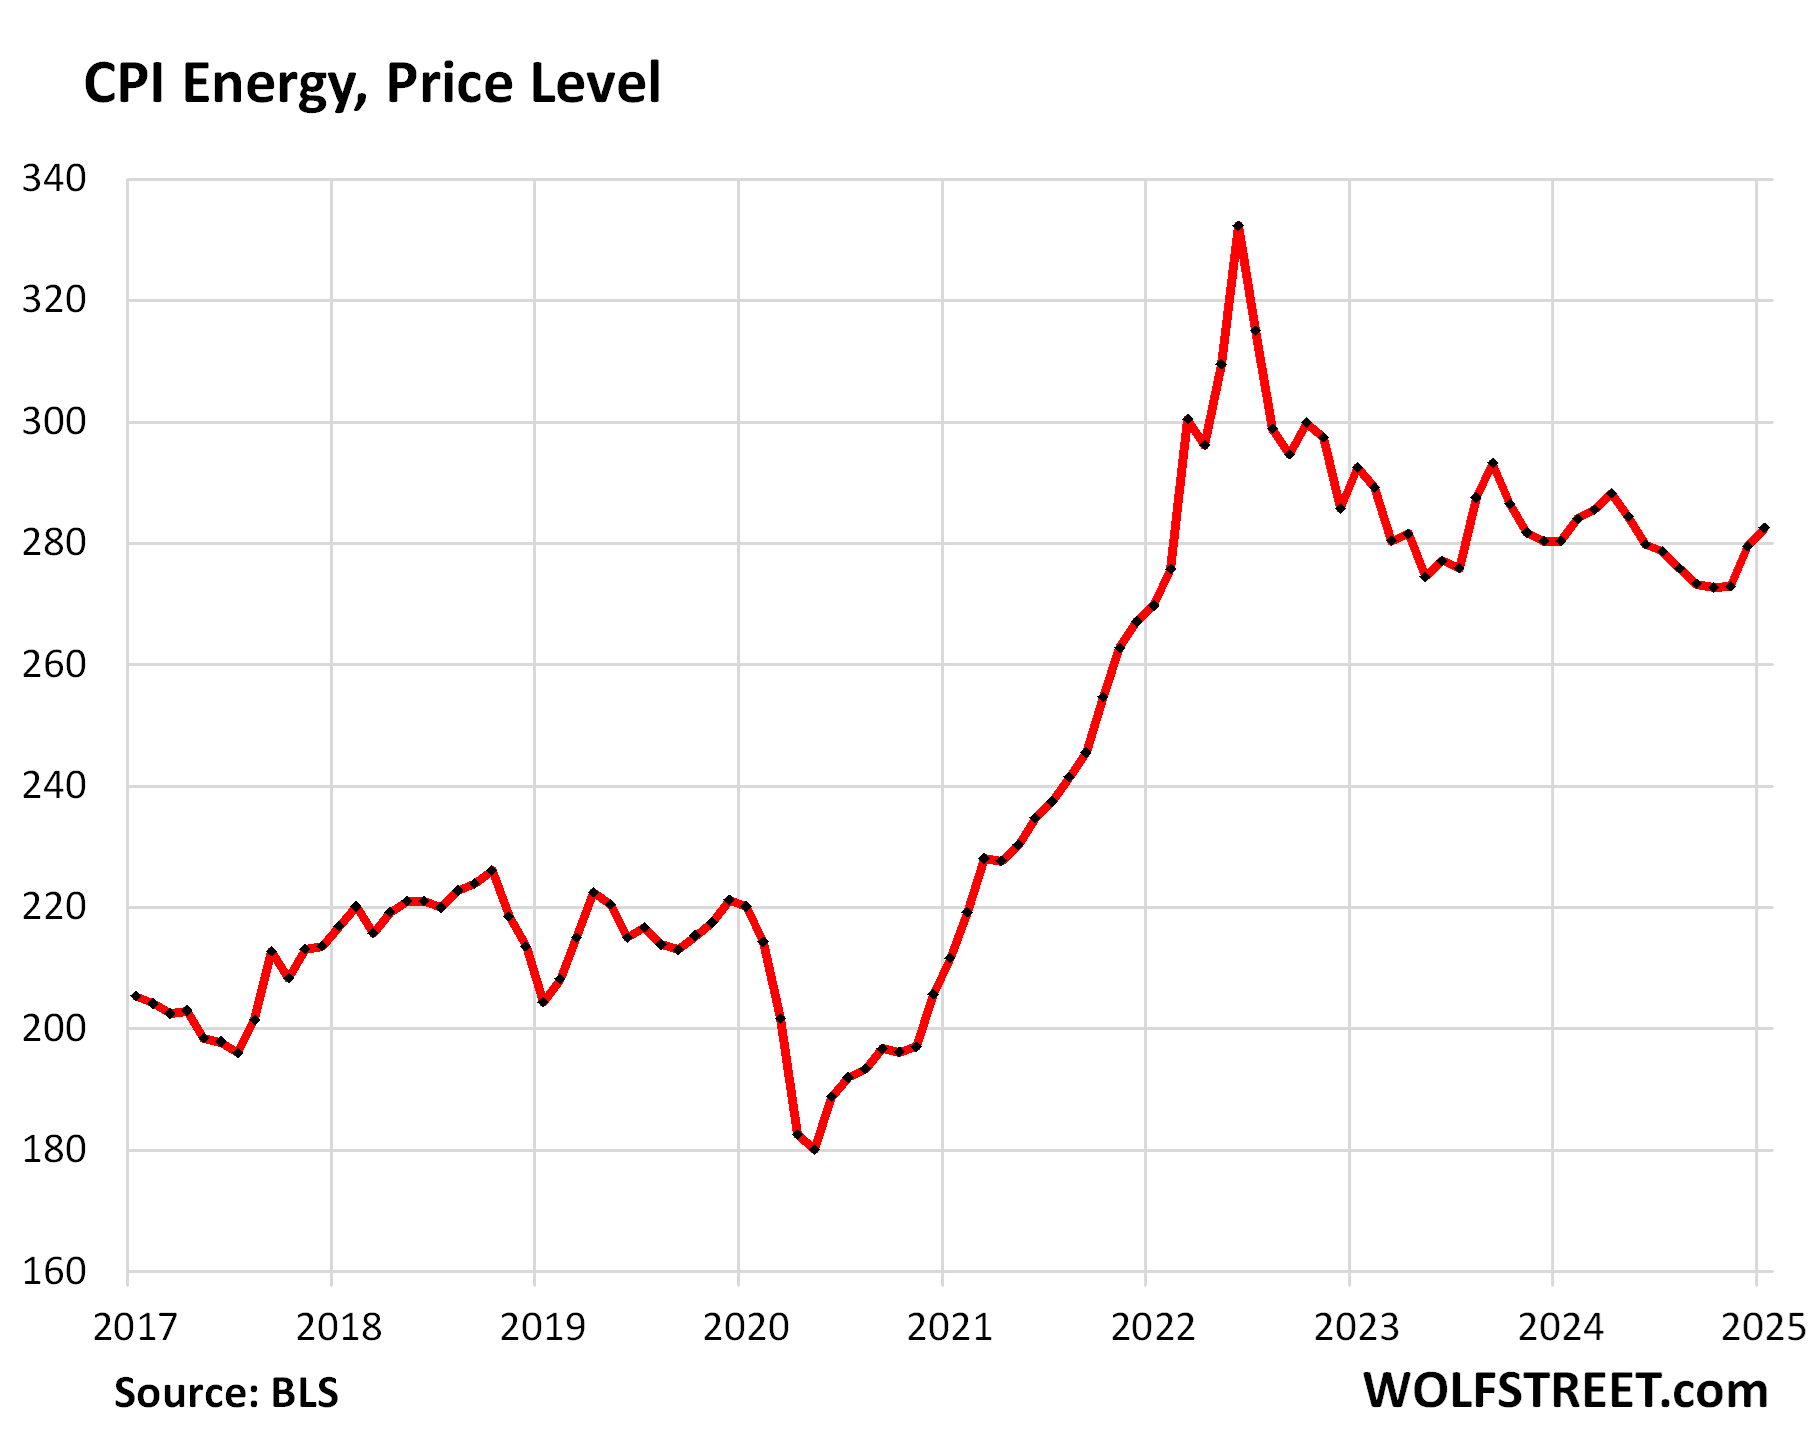
Energy.
The CPI for gasoline makes up about half of the overall energy CPI. It jumped 1.8% in January from December, seasonally adjusted, which about ended the year-over-year decline.
Not seasonally adjusted, gasoline also rose, when it normally declines during the low-demand winter months.
Compared to the peak in the summer of 2022, gasoline prices plunged by 28% seasonally adjusted (red), and by 36% not seasonally adjusted (blue). This had been a big factor in the deceleration of overall CPI inflation.
The CPI for energy, which covers energy products and services that consumers buy and pay for directly, including gasoline, jumped by 1.1% in January from December, and rose by 1.0% year-over-year, the first year-over-year gain since July.
| CPI for Energy, by Category | MoM | YoY |
| Overall Energy CPI | 1.1% | 1.0% |
| Gasoline | 1.8% | -0.2% |
| Electricity service | 0.3% | 2.5% |
| Utility natural gas to home | 1.8% | 4.9% |
| Heating oil, propane, kerosene, firewood | 4.1% | -1.3% |
Enjoy reading WOLF STREET and want to support it? You can donate. I appreciate it immensely. Click on the beer and iced-tea mug to find out how:

Would you like to be notified via email when WOLF STREET publishes a new article? Sign up here.
![]()
The post Beneath the Skin of CPI Inflation: Worst Month-to-Month Acceleration of CPI since Aug 2023, on Spikes in Used Vehicles, Non-Housing Services, Food, Energy appeared first on Energy News Beat.
Energy News Beat