
Austin, Oakland, New Orleans, San Francisco, Washington D.C., Phoenix, Portland, Denver, Fort Worth, San Antonio.
By Wolf Richter for WOLF STREET.
For the US overall, for the entire market, the median price of all single-family homes was up on a year-over year basis by 1.7% in April, having shrunk for the fourth month in a row. But someone buying a home buys it in a specific market. They don’t buy the median home in the US at the median price.
And there are dramatically different scenarios in various big cities: Some are showing continued price increases, while others are showing serious price declines.
Five of these big cities had double-digit price declines from their peaks in mid-2022:
- Austin: -21.5%
- Oakland: -19.2%
- New Orleans: -16.7%
- San Francisco: -15.2%
- Washington DC: -10.2%
Other major cities had similar price declines, such as Birmingham, AL, (-14%). But the population of those cities is too small to qualify for this big-city list.
Three more big cities had price declines of 8%-plus, and two of 7%-plus from their peaks in mid-2022:
- Phoenix: -8.3%
- Portland: -8.3%
- Denver: -8.1%
- Fort Worth: -7.3%
- San Antonio: -7.1%
Many other big cities have smaller price declines from their peaks.
Here we’re drilling down to the city level, single-family homes only, in the largest cities – not Metropolitan Statistical Areas (MSA) that can cover multiple cities in several states. By contrast, our long-running Wolf Street series, The Most Splendid Housing Bubbles of America, charts 33 of the largest and most expensive MSAs, single-family and condo combined. So here only cities, and only single-family homes.
All data through April. These prices here are seasonally adjusted and a three-month moving average to iron out the month-to-month squiggles. They’re part of the Zillow Home Value Index (ZHVI) data, based on the Zillow Database of All Homes. These are not median prices.
The 10 Big Cities with the biggest price declines.
The metrics in each table: price decline from the peak, change from prior month (MoM), change year-over-year (YoY), and increase since January 2000.
| Austin, City, Single-Family Home Prices | |||
| From Jun 2022 peak | MoM | YoY | Since 2000 |
| -21.5% | -0.7% | -5.2% | 174.7% |
Despite this drop, prices are only back where they’d first been during the price explosion in May 2021. They exploded on the way up but are much slower-moving on the way back.
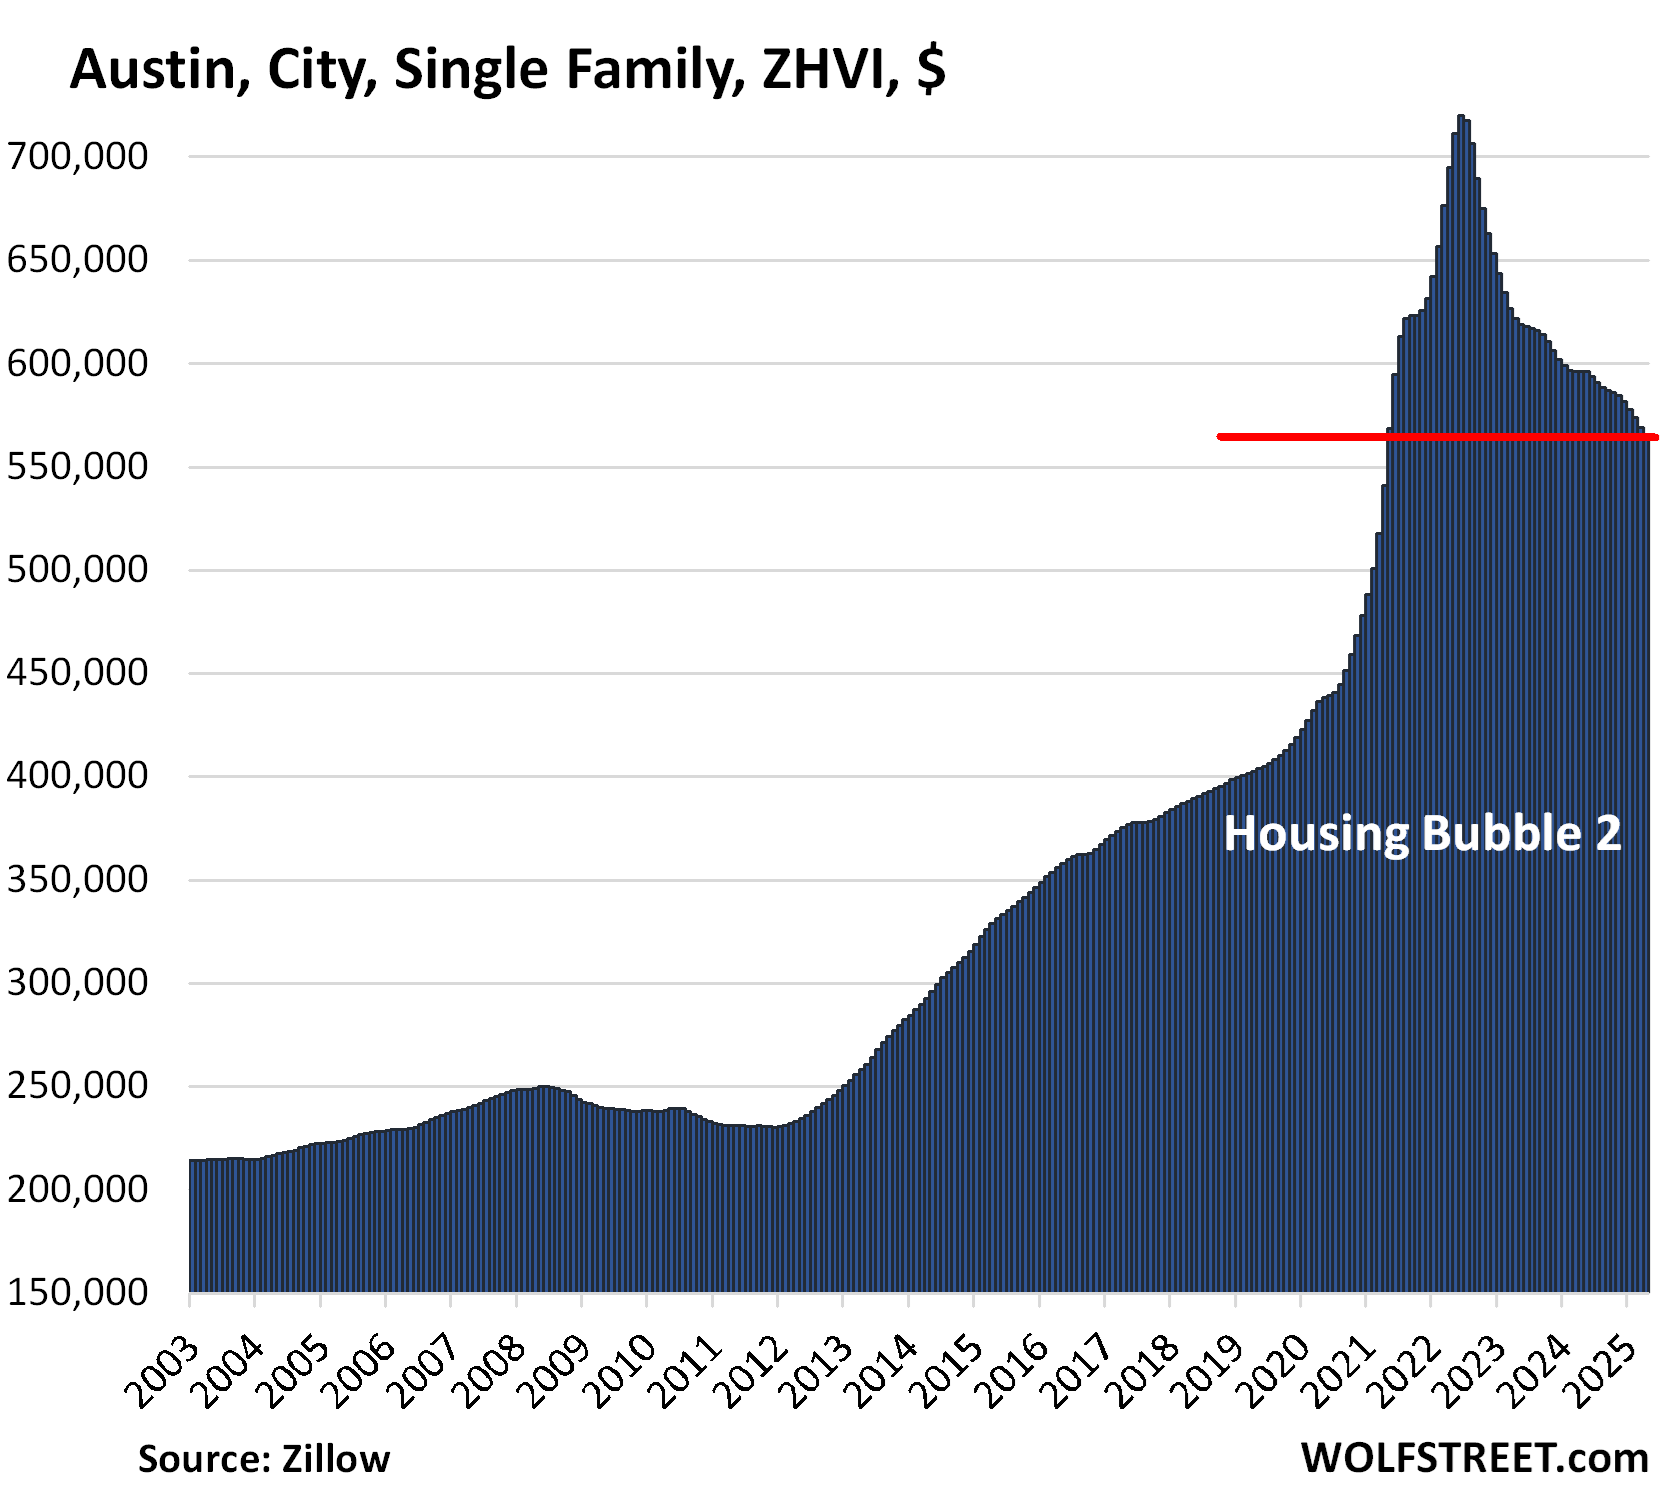
No housing chart should ever look like this. In the two years from mid-2020 through mid-2022, prices in the city of Austin had spiked by 64%. Homes are not cryptos. A chart like this shows that there was something seriously wrong: The Fed’s monetary policy, specifically the all-out interest rate repression, including through the Fed’s massive purchases of mortgage-backed securities (MBS) that helped push mortgage rates down below 3%.
It was one of the most egregious policy errors of all time, resulting in massive historic home price inflation, on top of already substantial price increases in prior years, that completely distorted every aspect of the housing market.
But now the Fed is doing the opposite. Mortgage rates are back in the 7% range. And prices have begun to unwind in many markets.
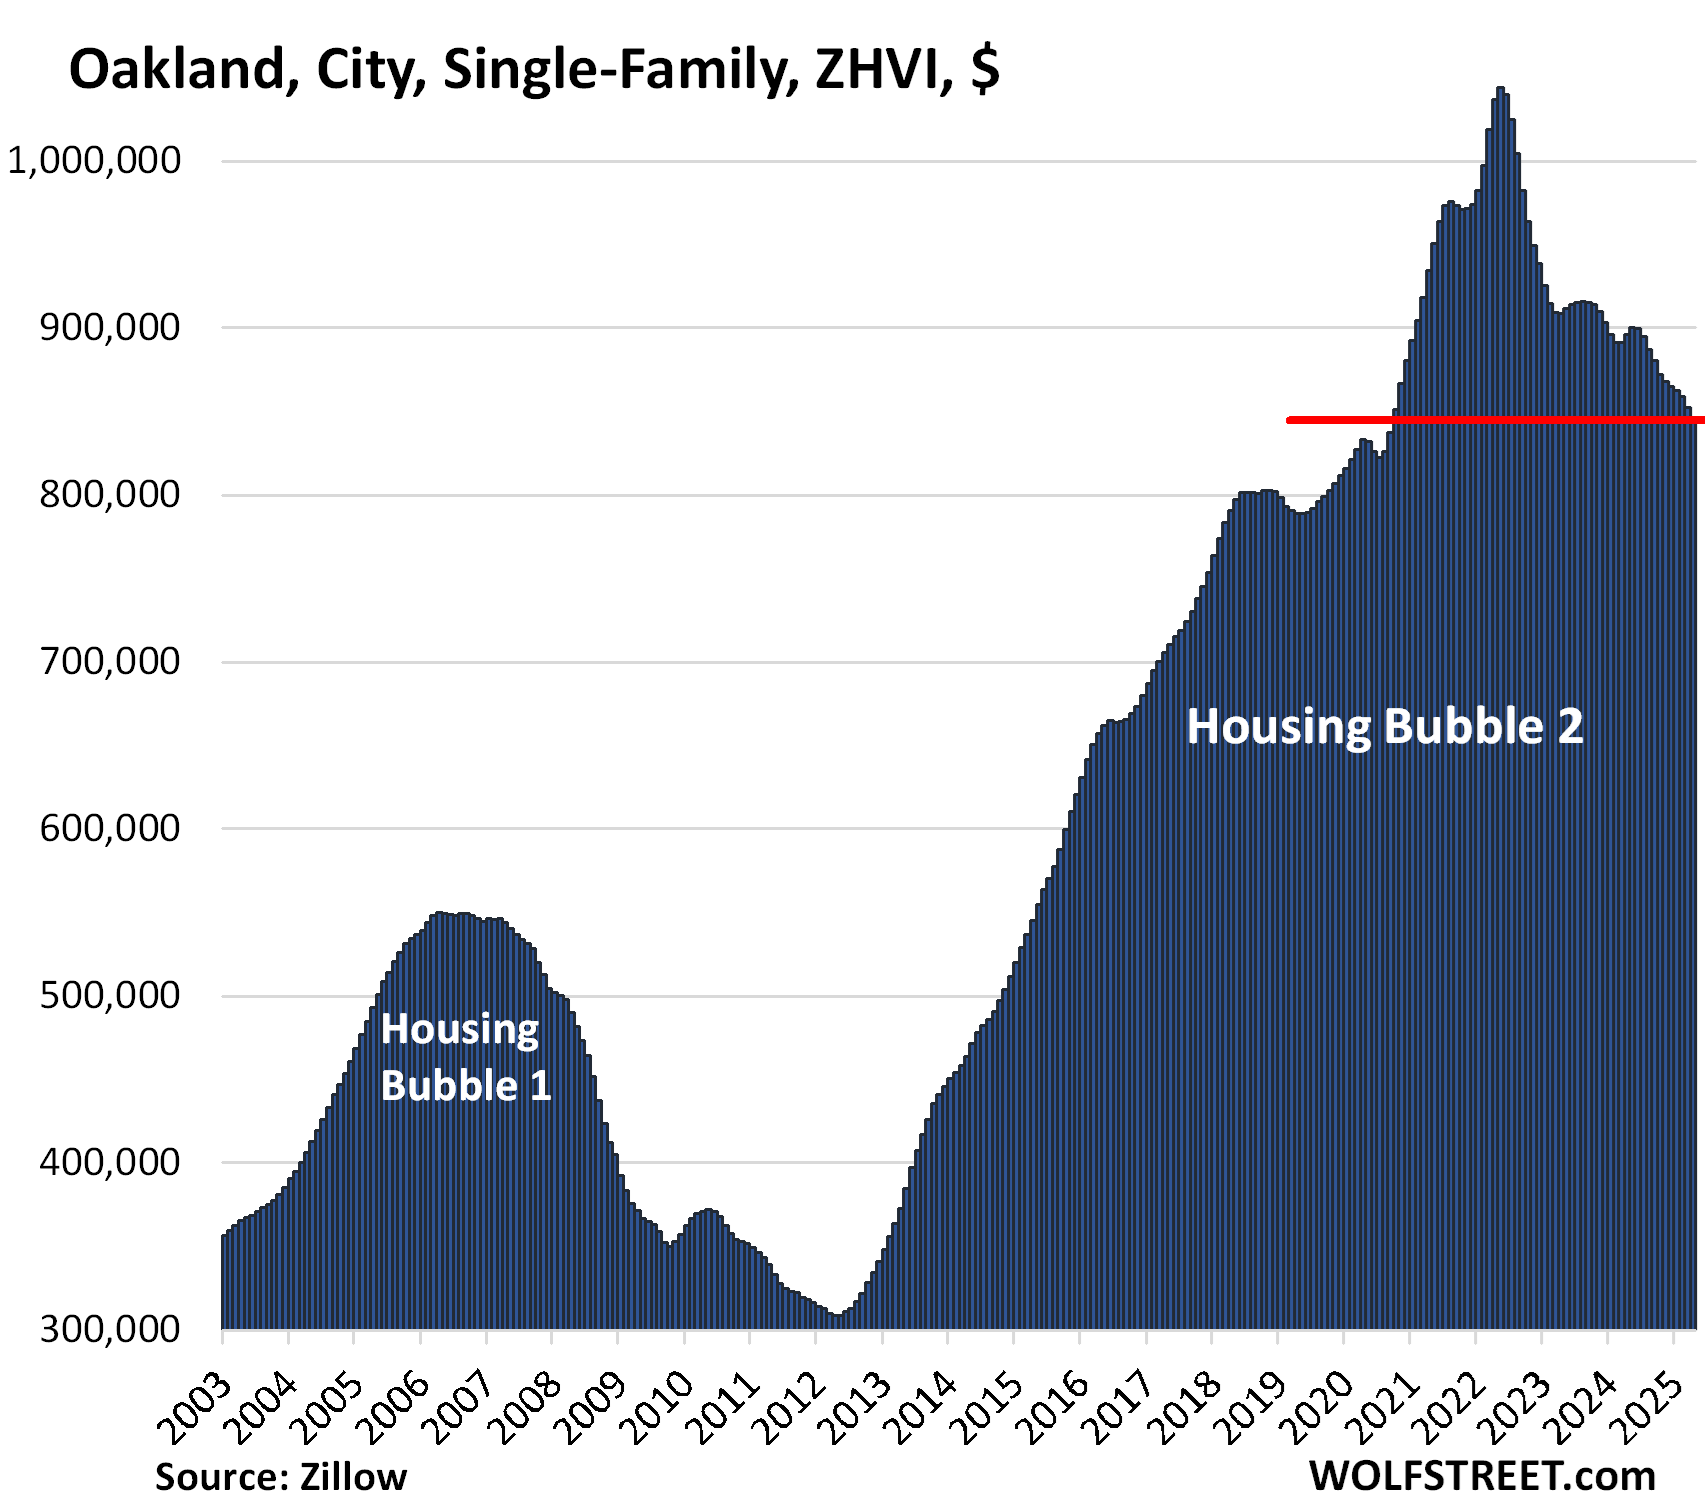
| Oakland, City, Single-Family Home Prices | |||
| From May 2022 peak | MoM | YoY | Since 2000 |
| -19.2% | -1.0% | -5.8% | 302.8% |
Prices are back where they’d first been in October 2020. In the 10 years between mid-2012 and the peak in May 2022, prices had exploded by 236%.
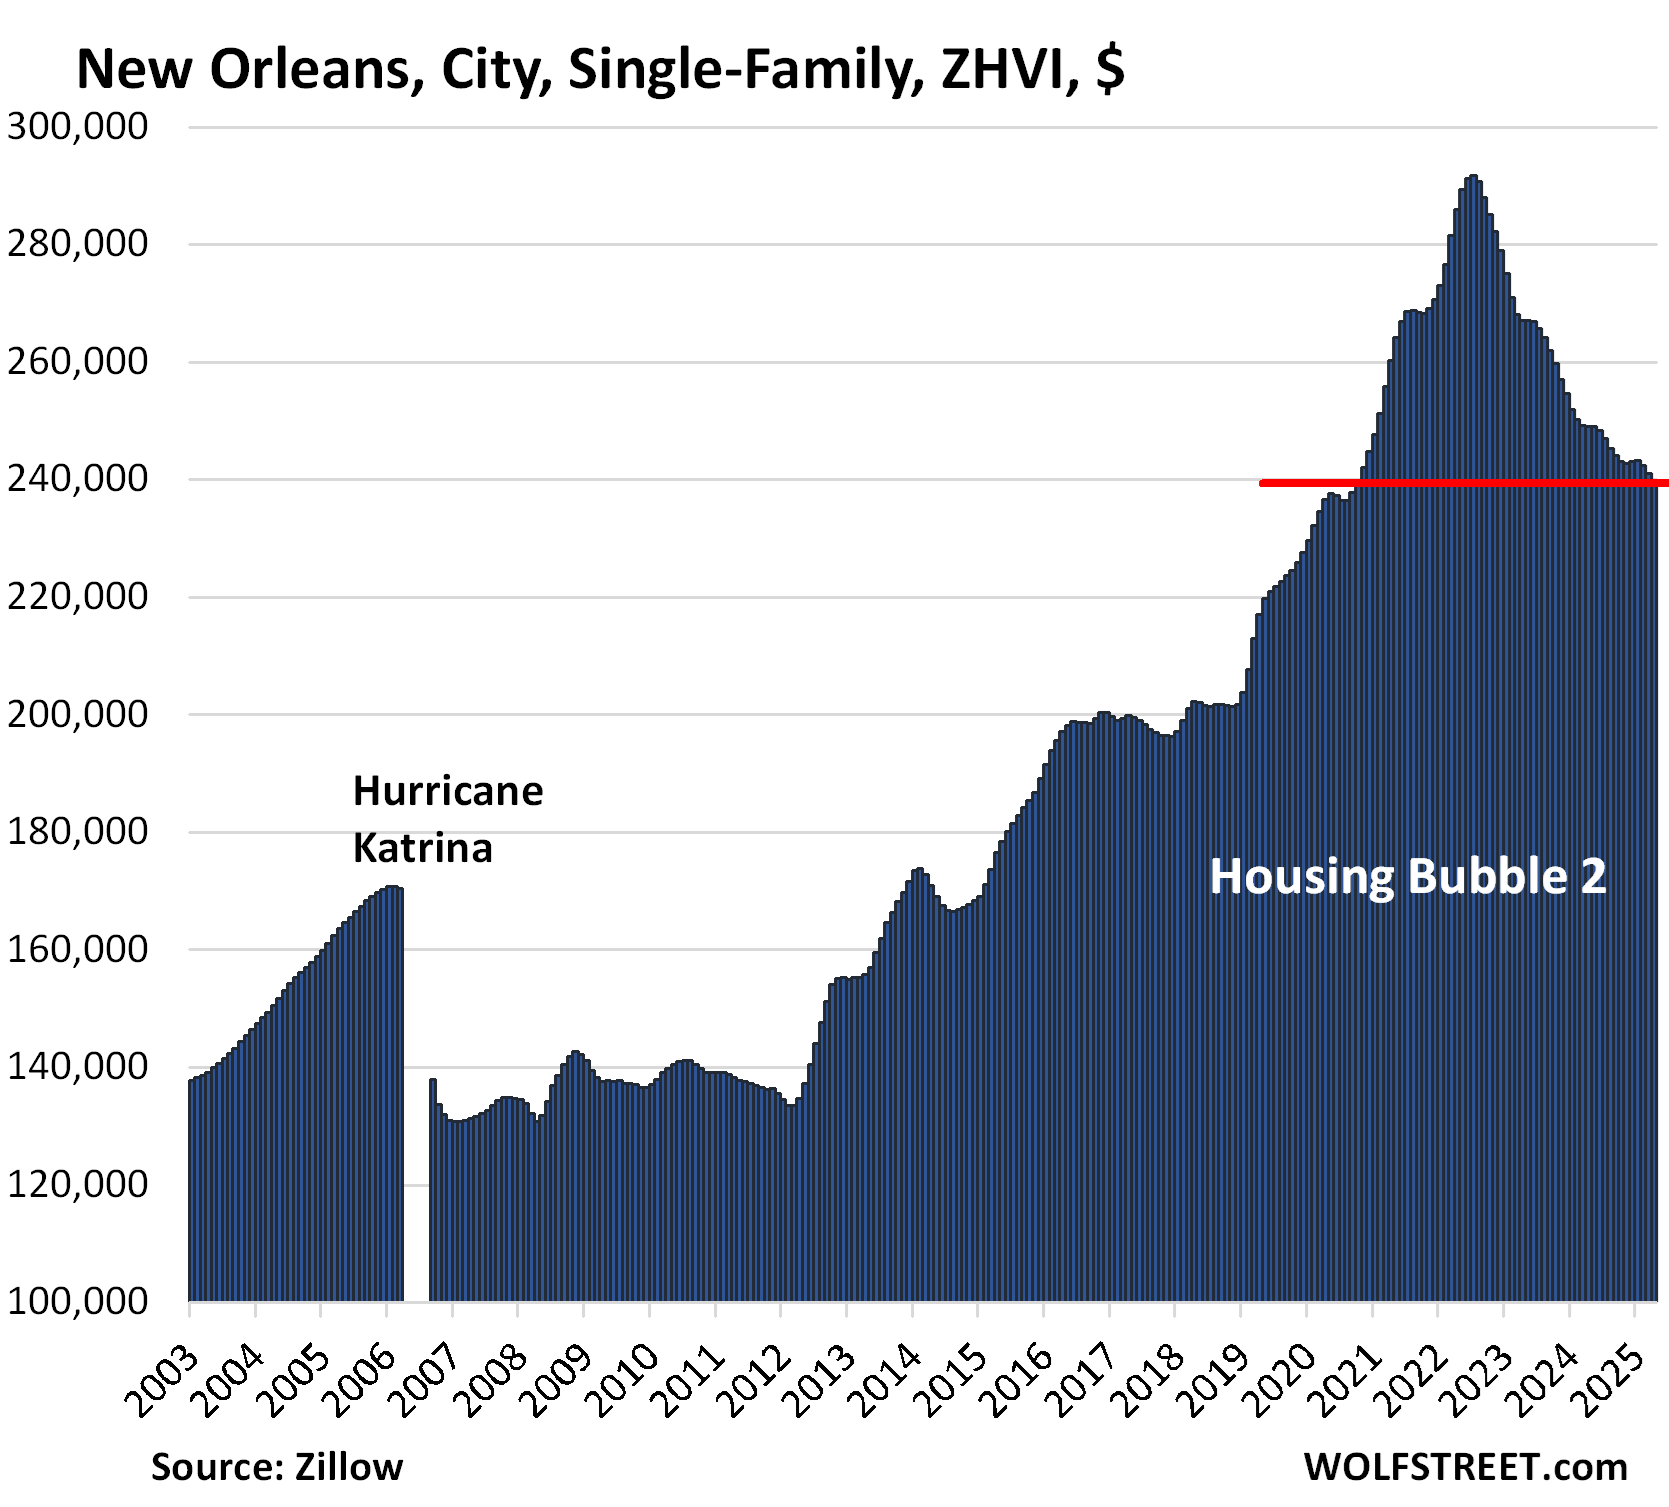
| New Orleans, City, Single-Family Home Prices | |||
| From Jun 2022 peak | MoM | YoY | Since 2007 |
| -16.7% | -0.5% | -3.7% | 110% |
Prices are back where they’d first been in September 2020.
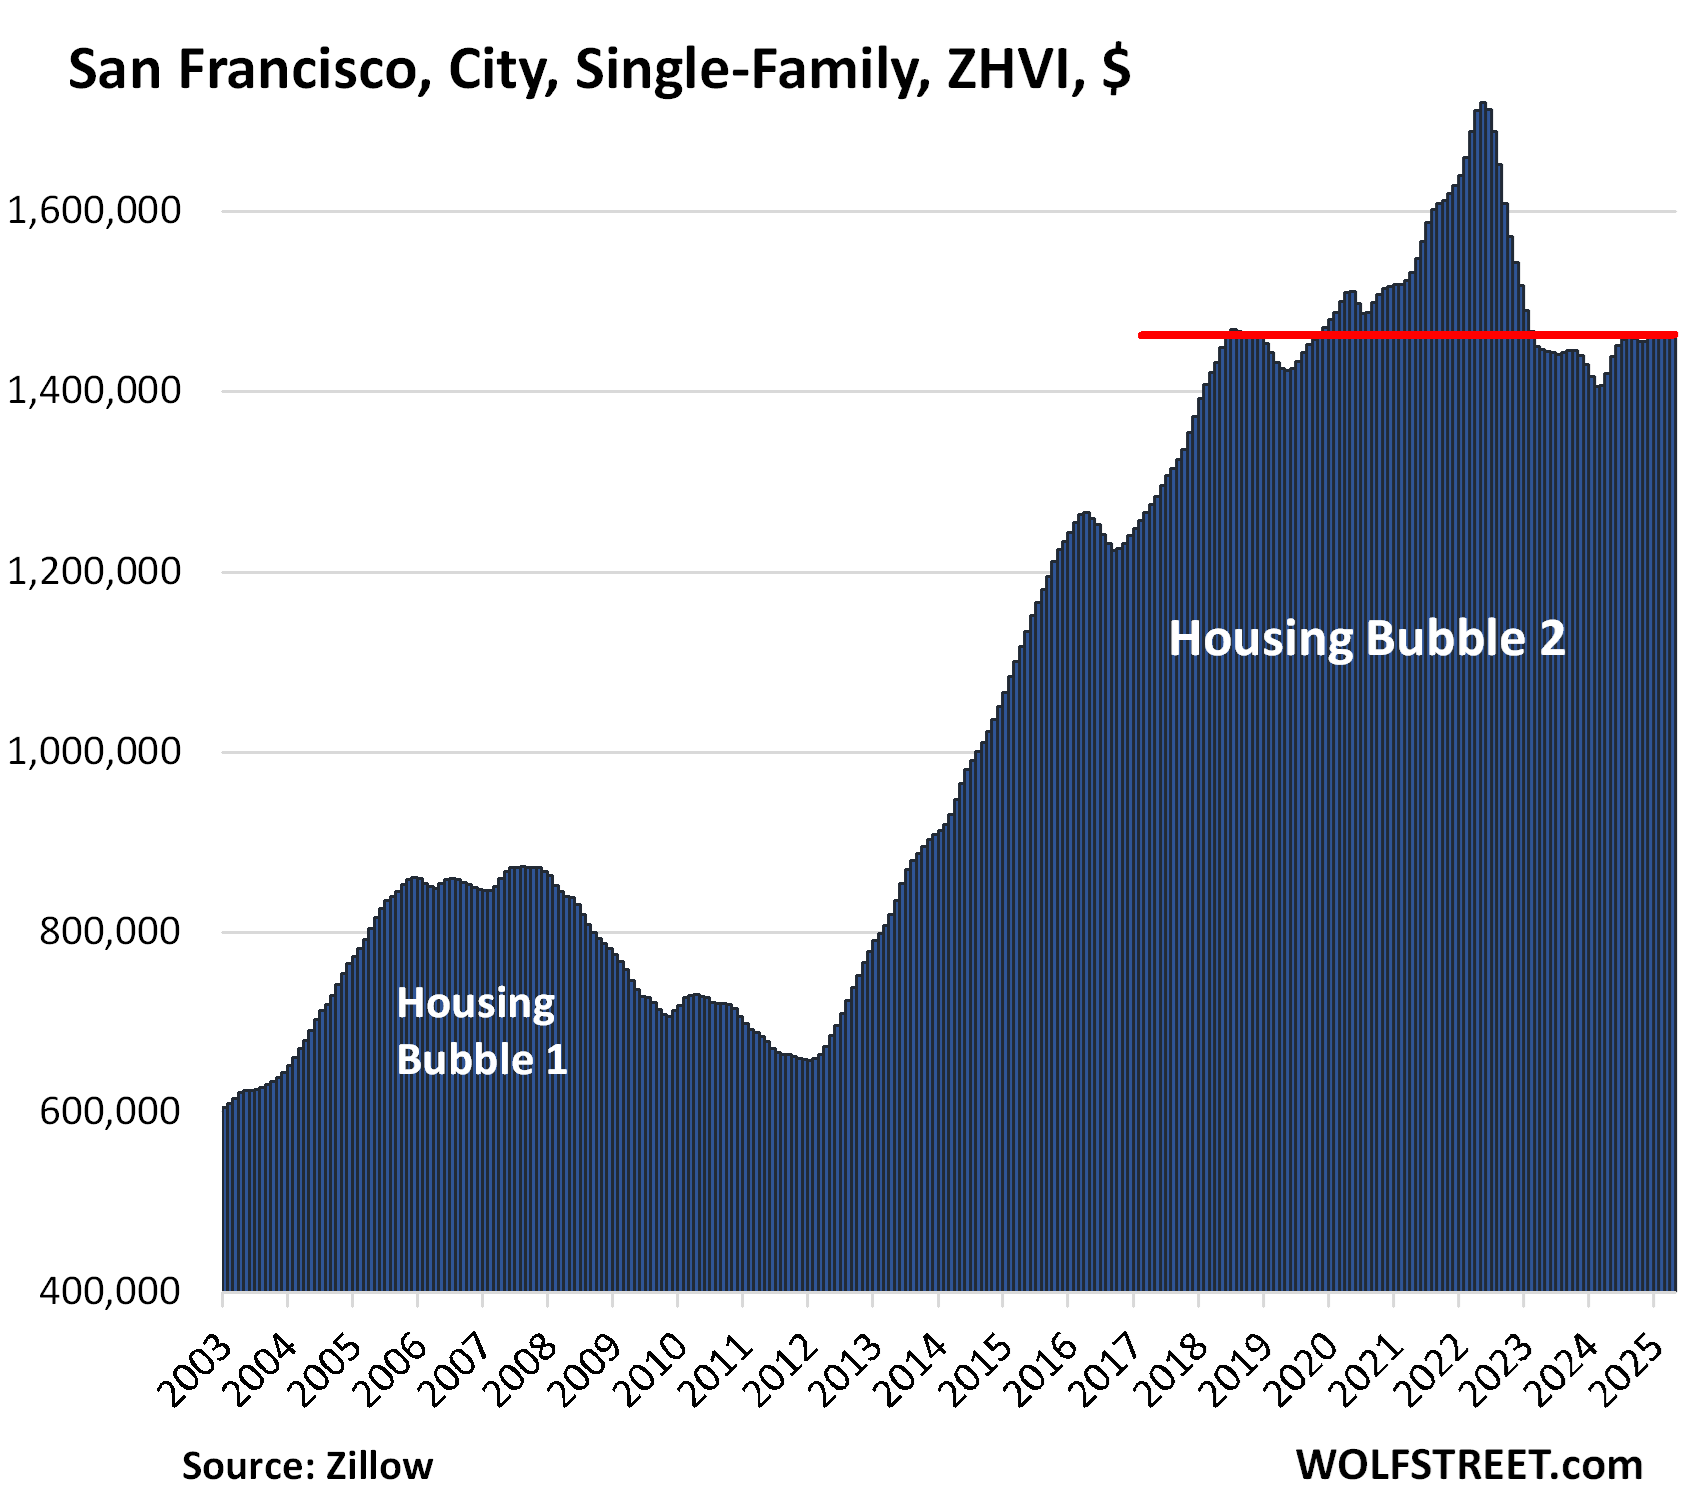
| San Francisco, City, Single-Family Home Prices | |||
| From May 2022 peak | MoM | YoY | Since 2000 |
| -15.1% | 0.0% | 2.9% | 237% |
Prices are now back to where they had first been in mid-2018. That was over six years ago. Over the decade through mid-2022, prices had shot up by 146%.
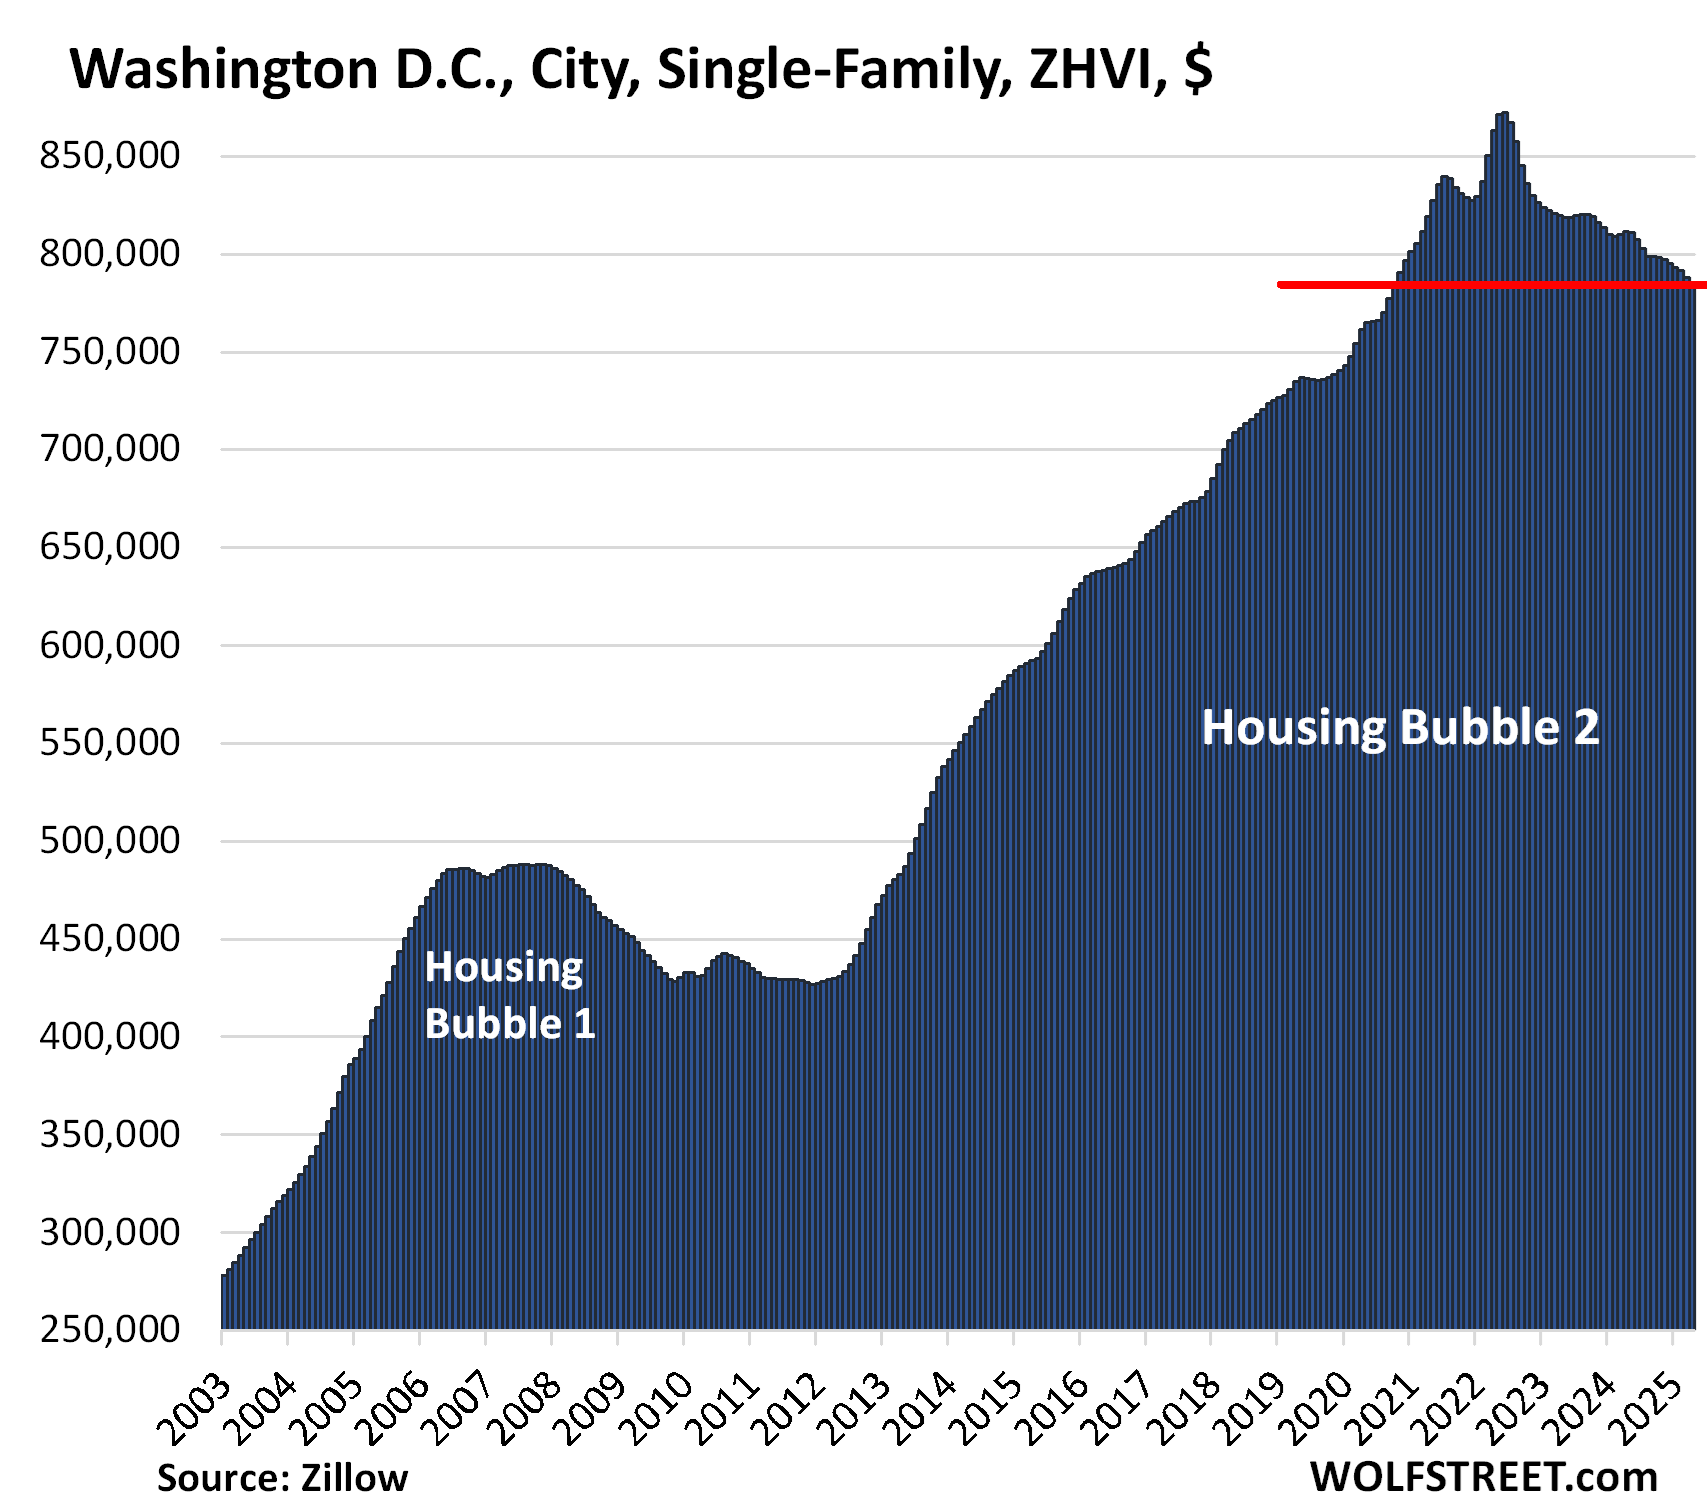
| Washington D.C., Single-Family Home Prices | |||
| From Jun 2022 | MoM | YoY | Since 2000 |
| -10.2% | -0.5% | -3.4% | 282% |
Prices are back to October 2020 levels.
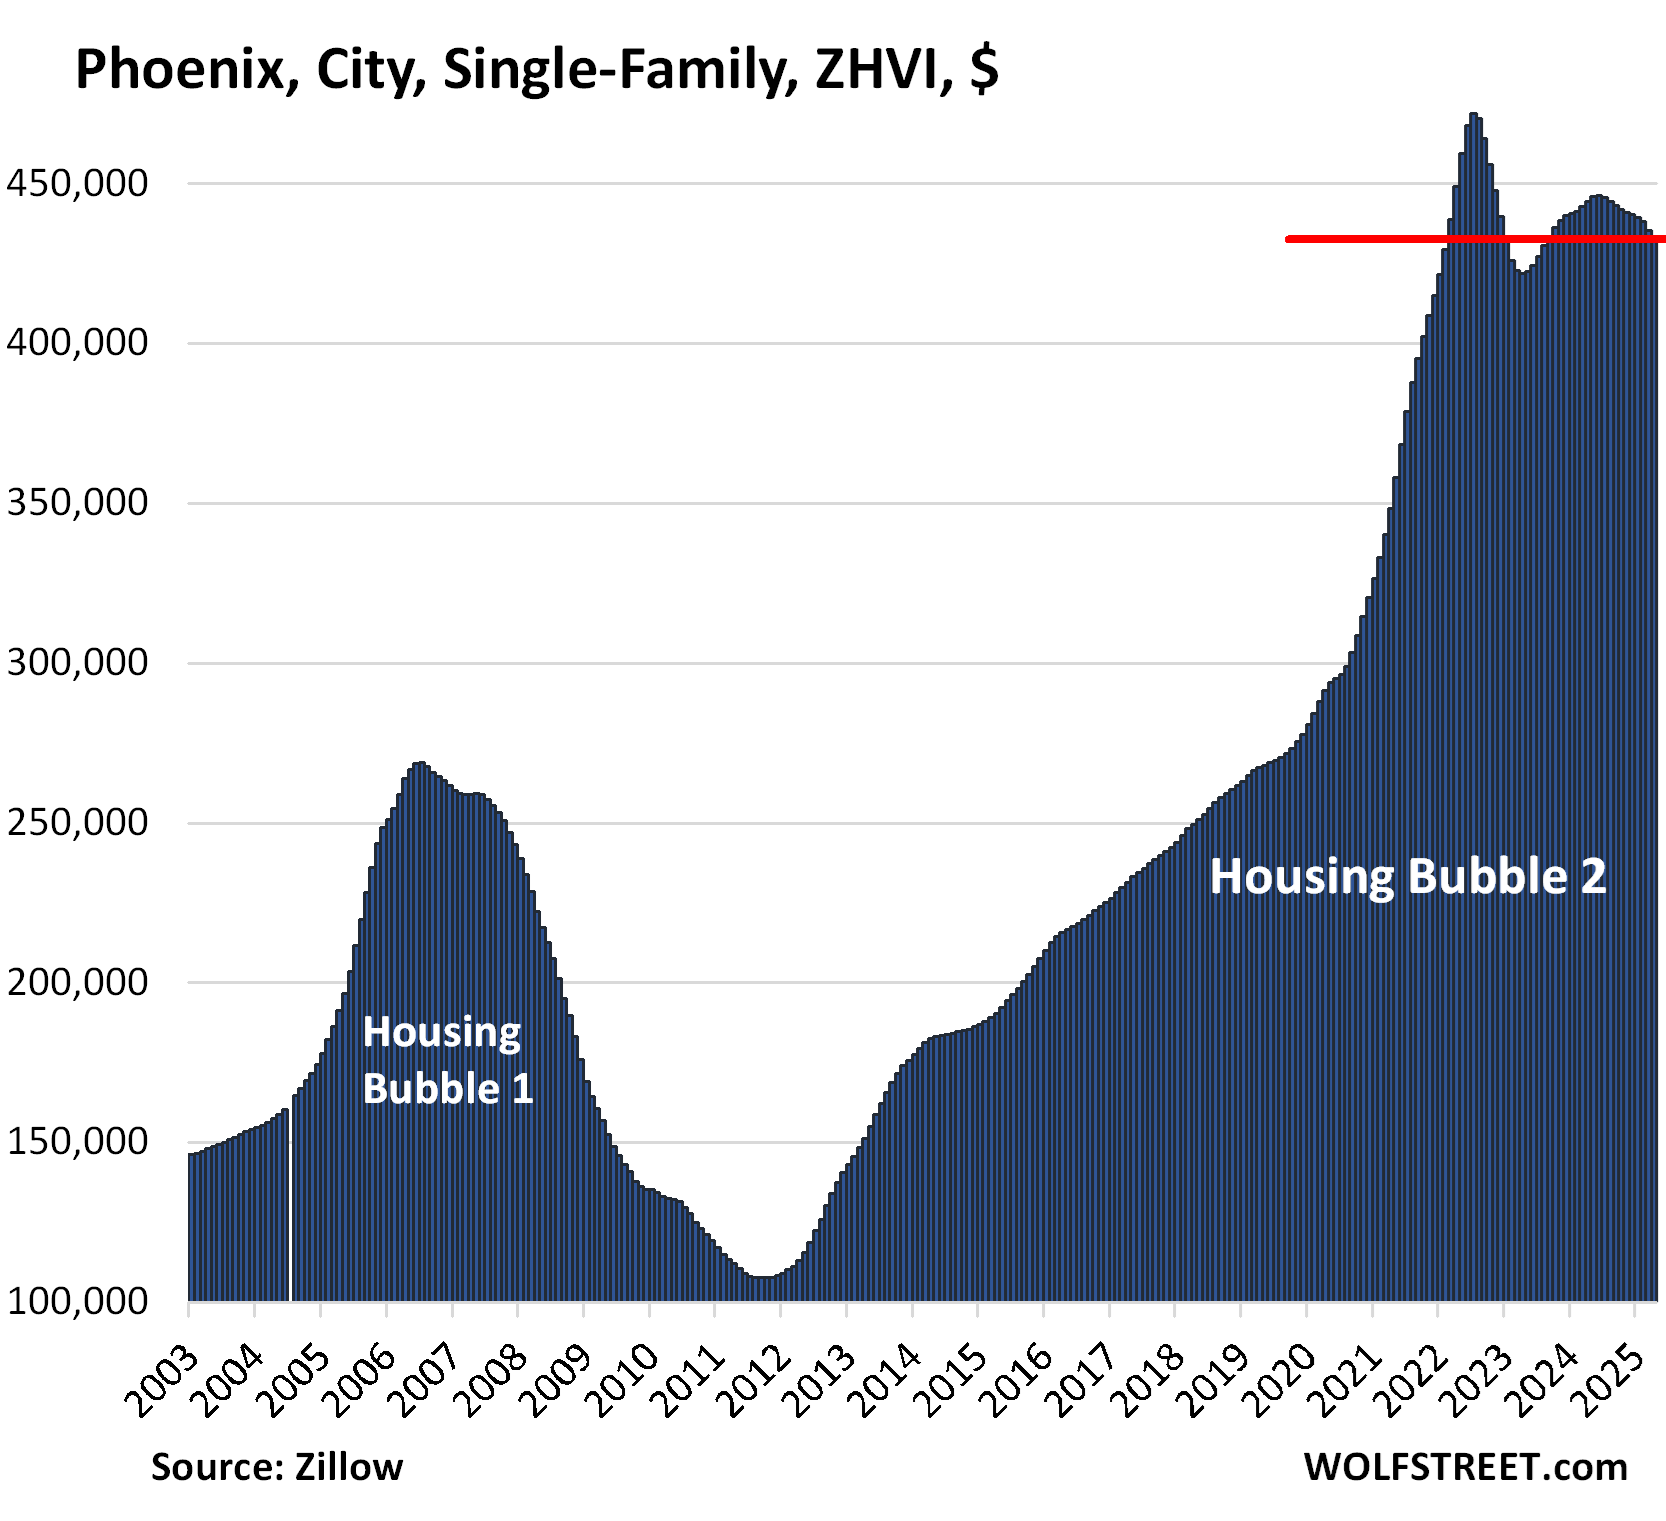
| Phoenix, City, Single-Family Home Prices | |||
| From Jul 2022 peak | MoM | YoY | Since 2000 |
| -8.3% | -0.5% | -2.6% | 256.0% |
The spike topped out in July 2022. That mini-hump topped out in June 2024.
In the 26 months between April 2020 and July 2022, prices of single-family homes had spiked 62%. In the 10 years through mid-2022, prices had exploded by 339%.
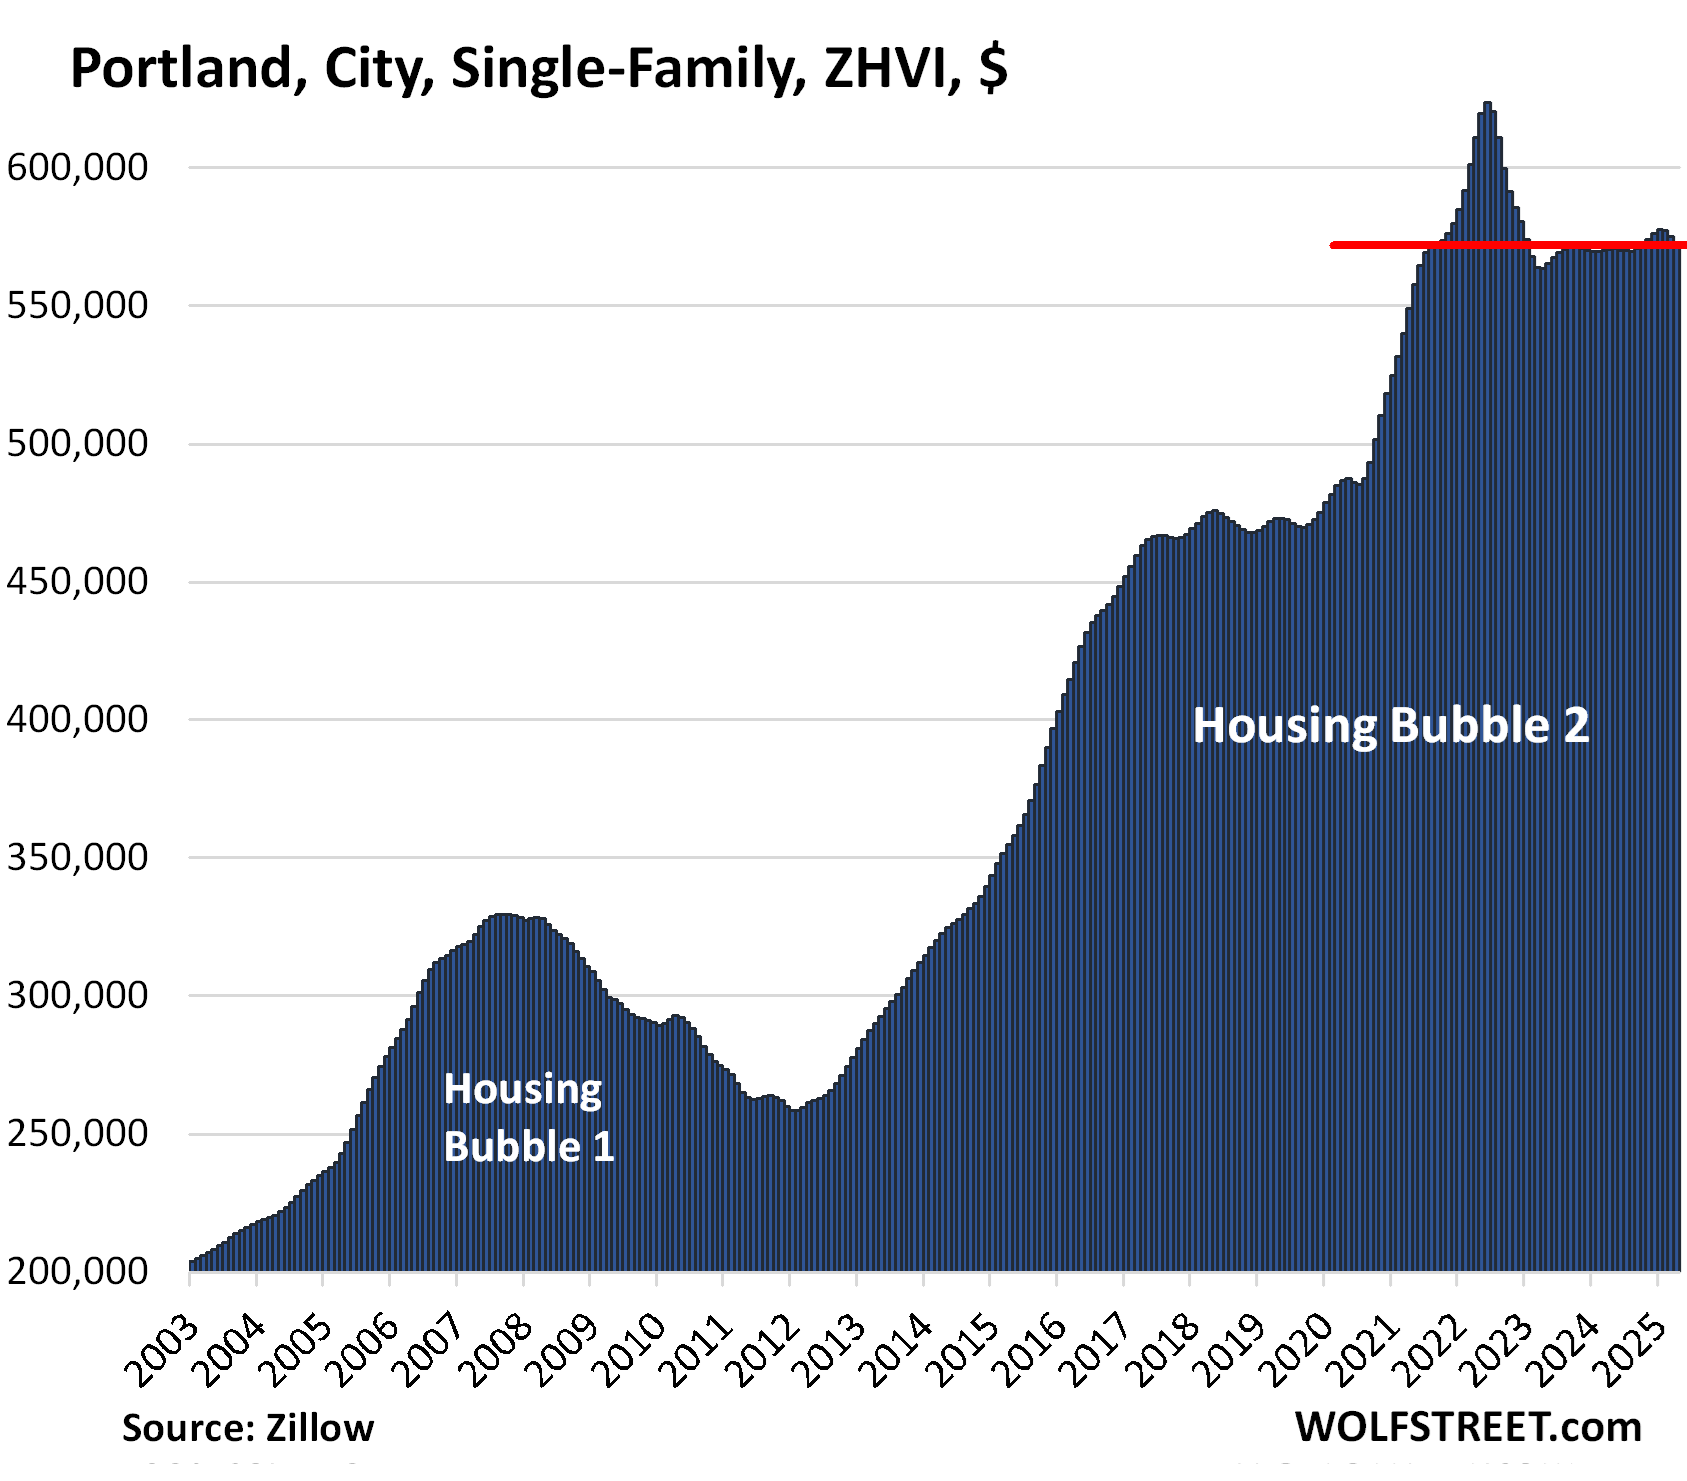
| Portland, City, Single-Family Home Prices | |||
| From May 2022 peak | MoM | YoY | Since 2000 |
| -8.3% | -0.6% | 0.3% | 227% |
Prices are back where they’d first been in August 2021.
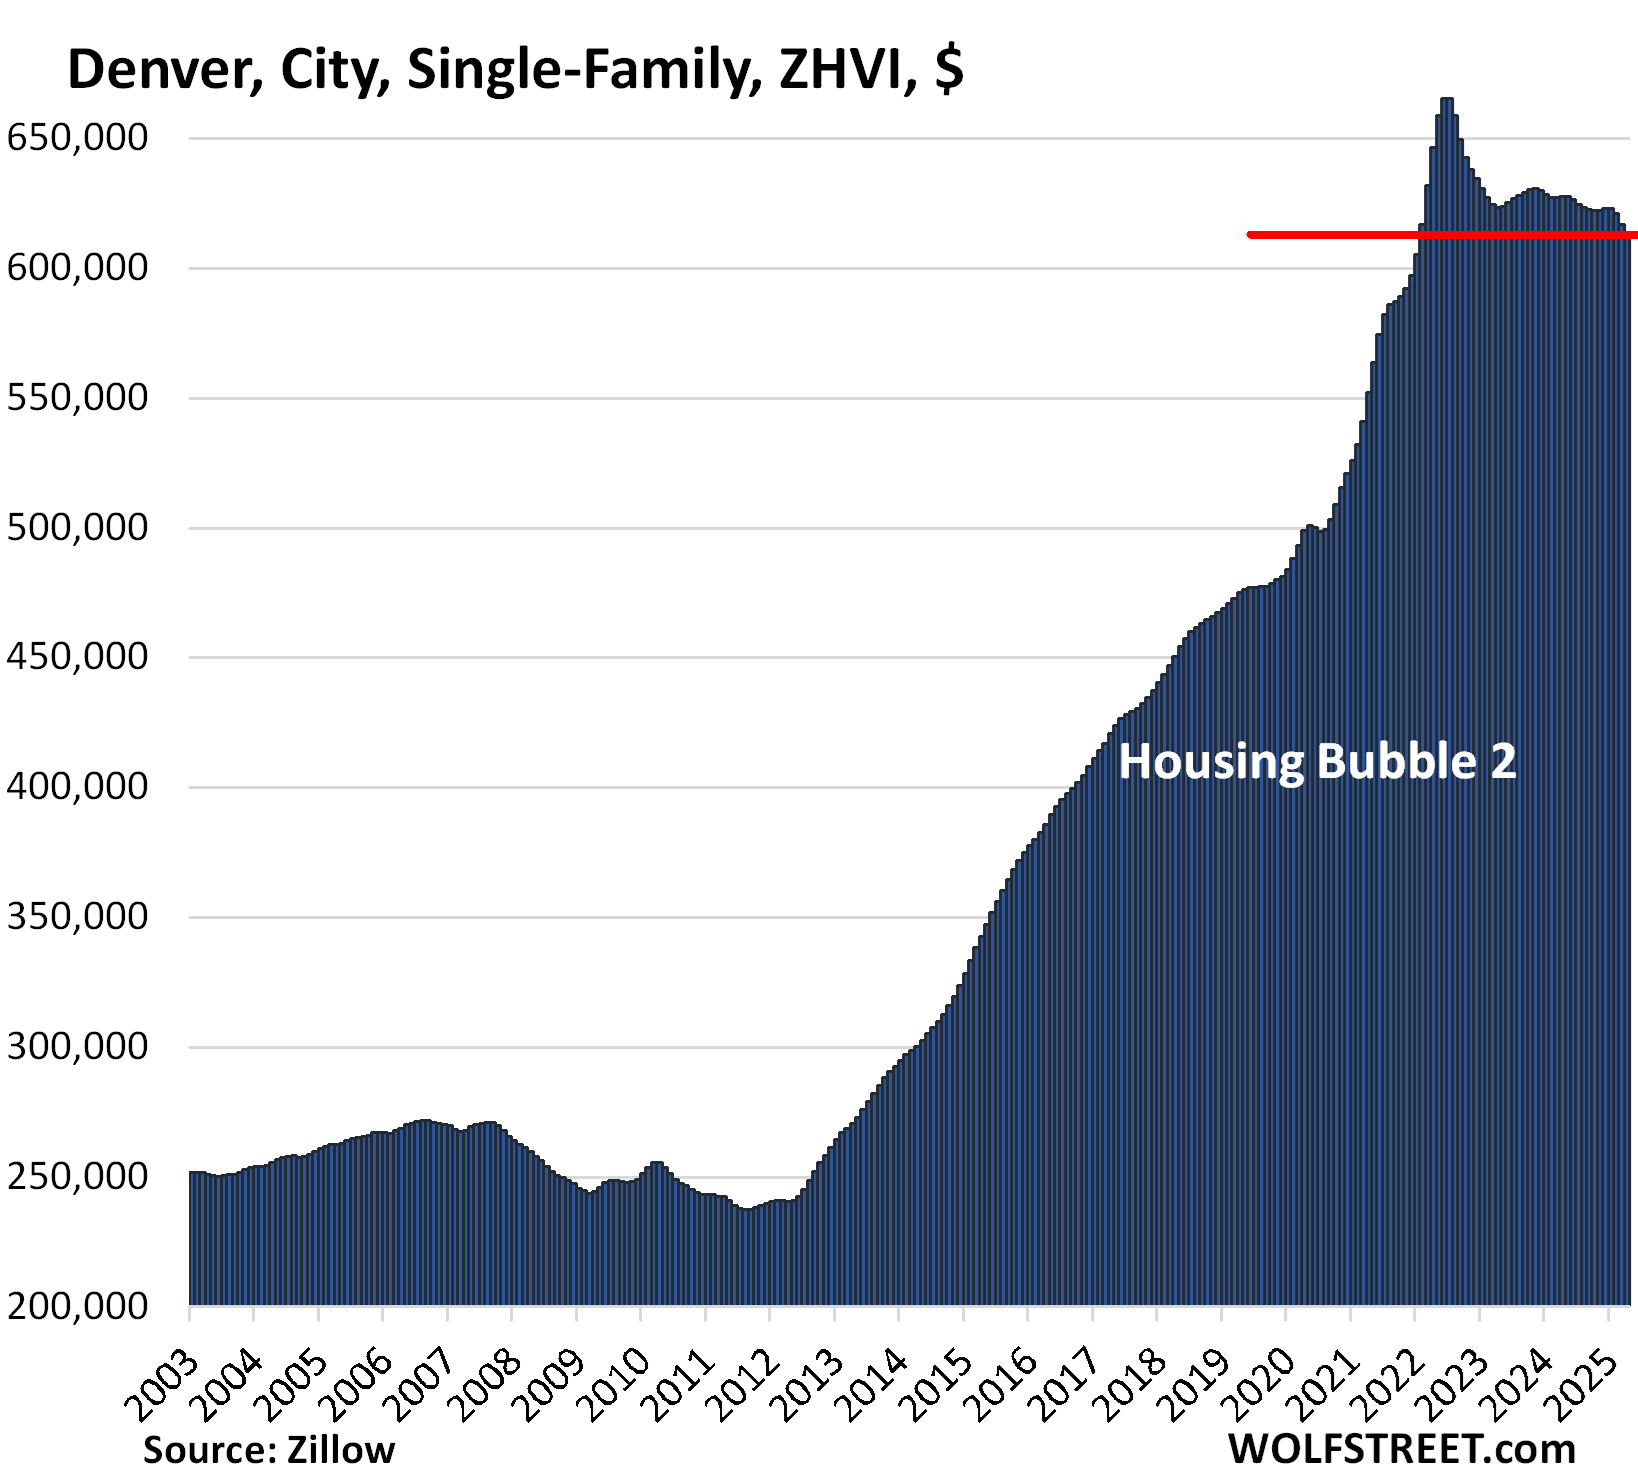
| Denver, City, Single-Family Home Prices | |||
| From Jun 2022 peak | MoM | YoY | Since 2000 |
| -8.1% | -0.8% | -2.6% | 221% |
Prices dropped below February 2022 levels. In the 10 years through mid-2022, prices had spiked by 174%.
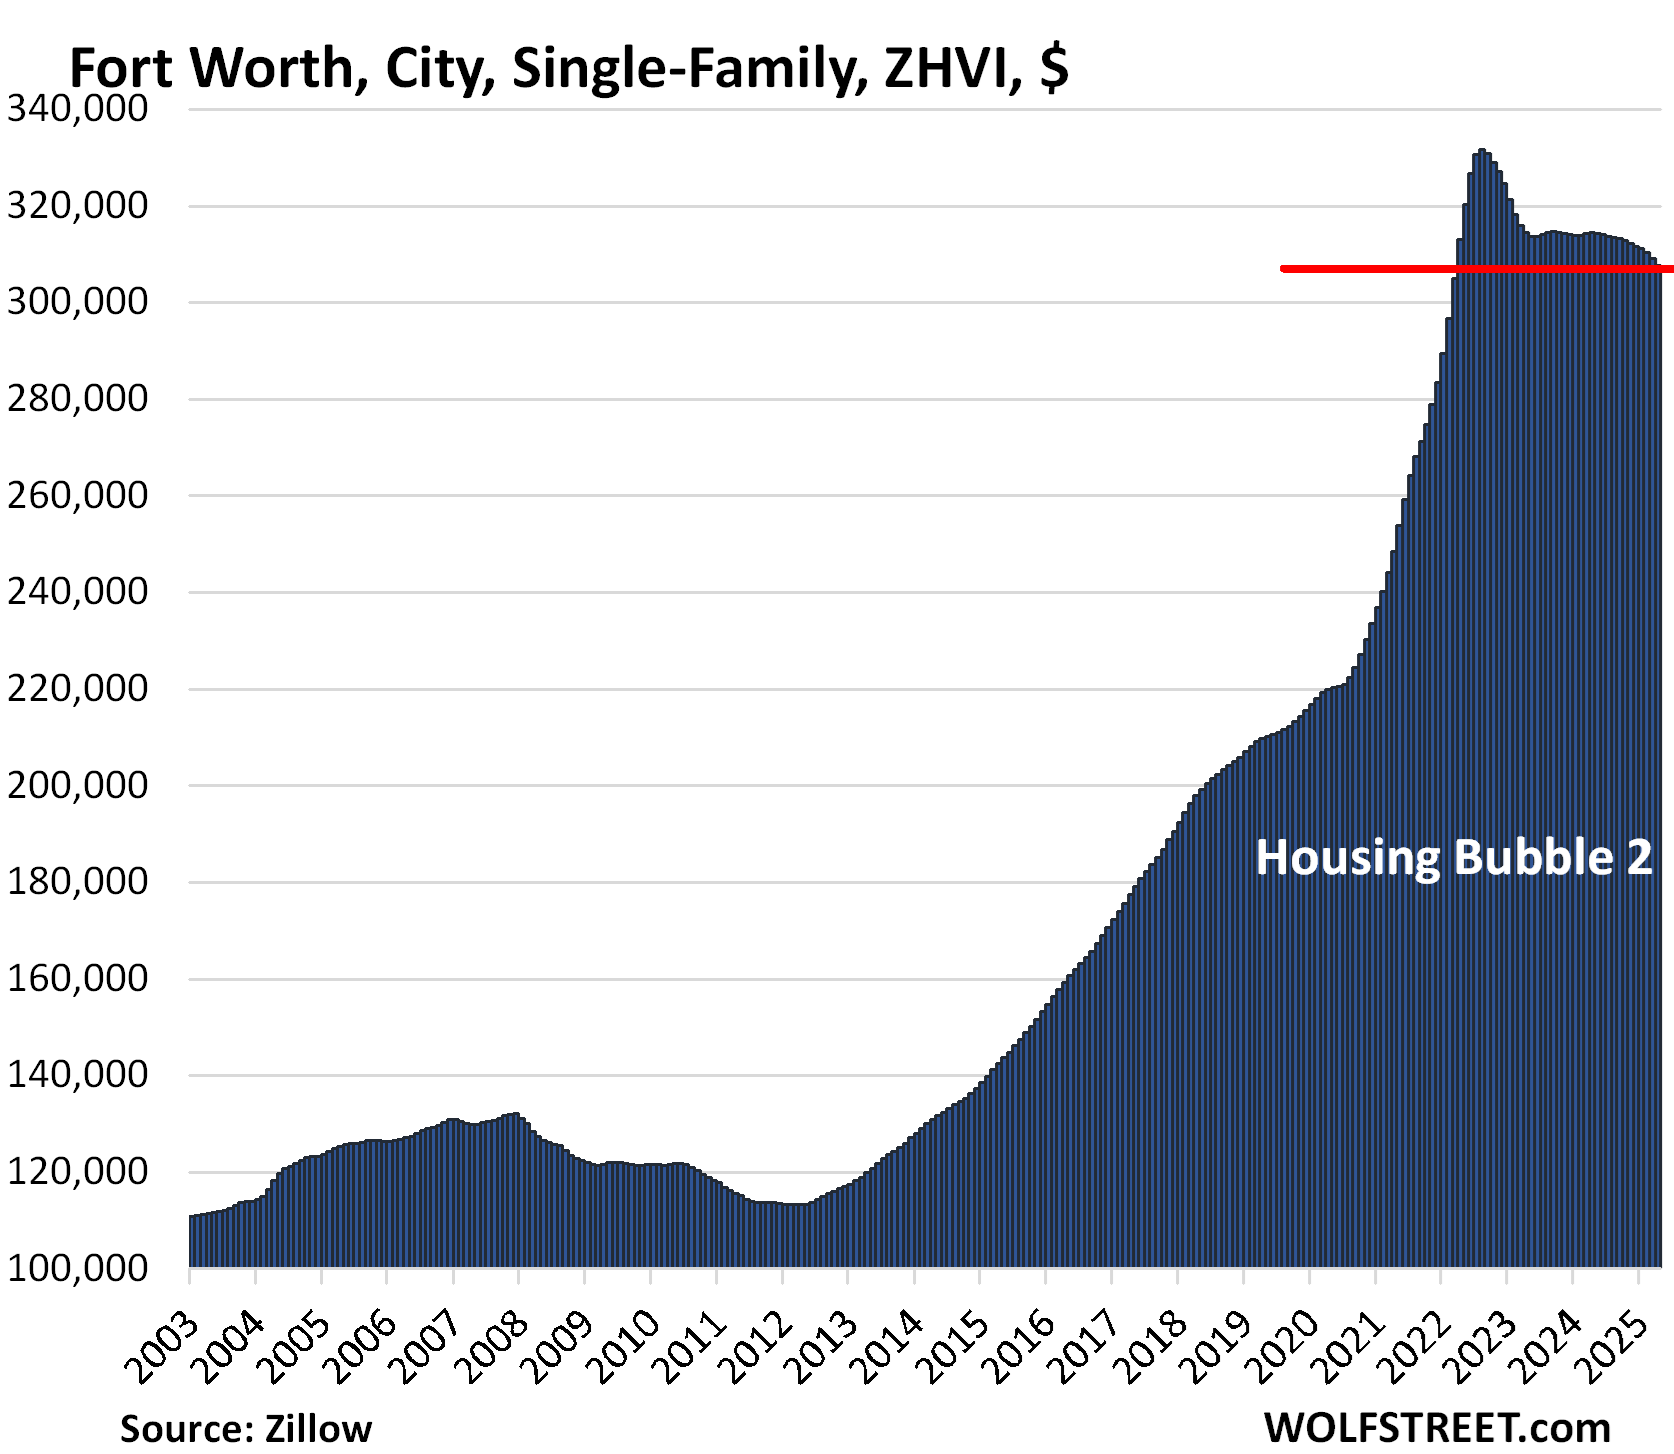
| Fort Worth, City, Single-Family Home Prices | |||
| From Aug 2022 peak | MoM | YoY | Since 2000 |
| -7.3% | -0.5% | -2.2% | 196% |
Prices are back to March 2022. In the 10 years through August 2022, prices had spiked by 187%.
Texas didn’t experience much of a Housing Bubble 1, and Housing Bust 2 was therefore relatively mild.
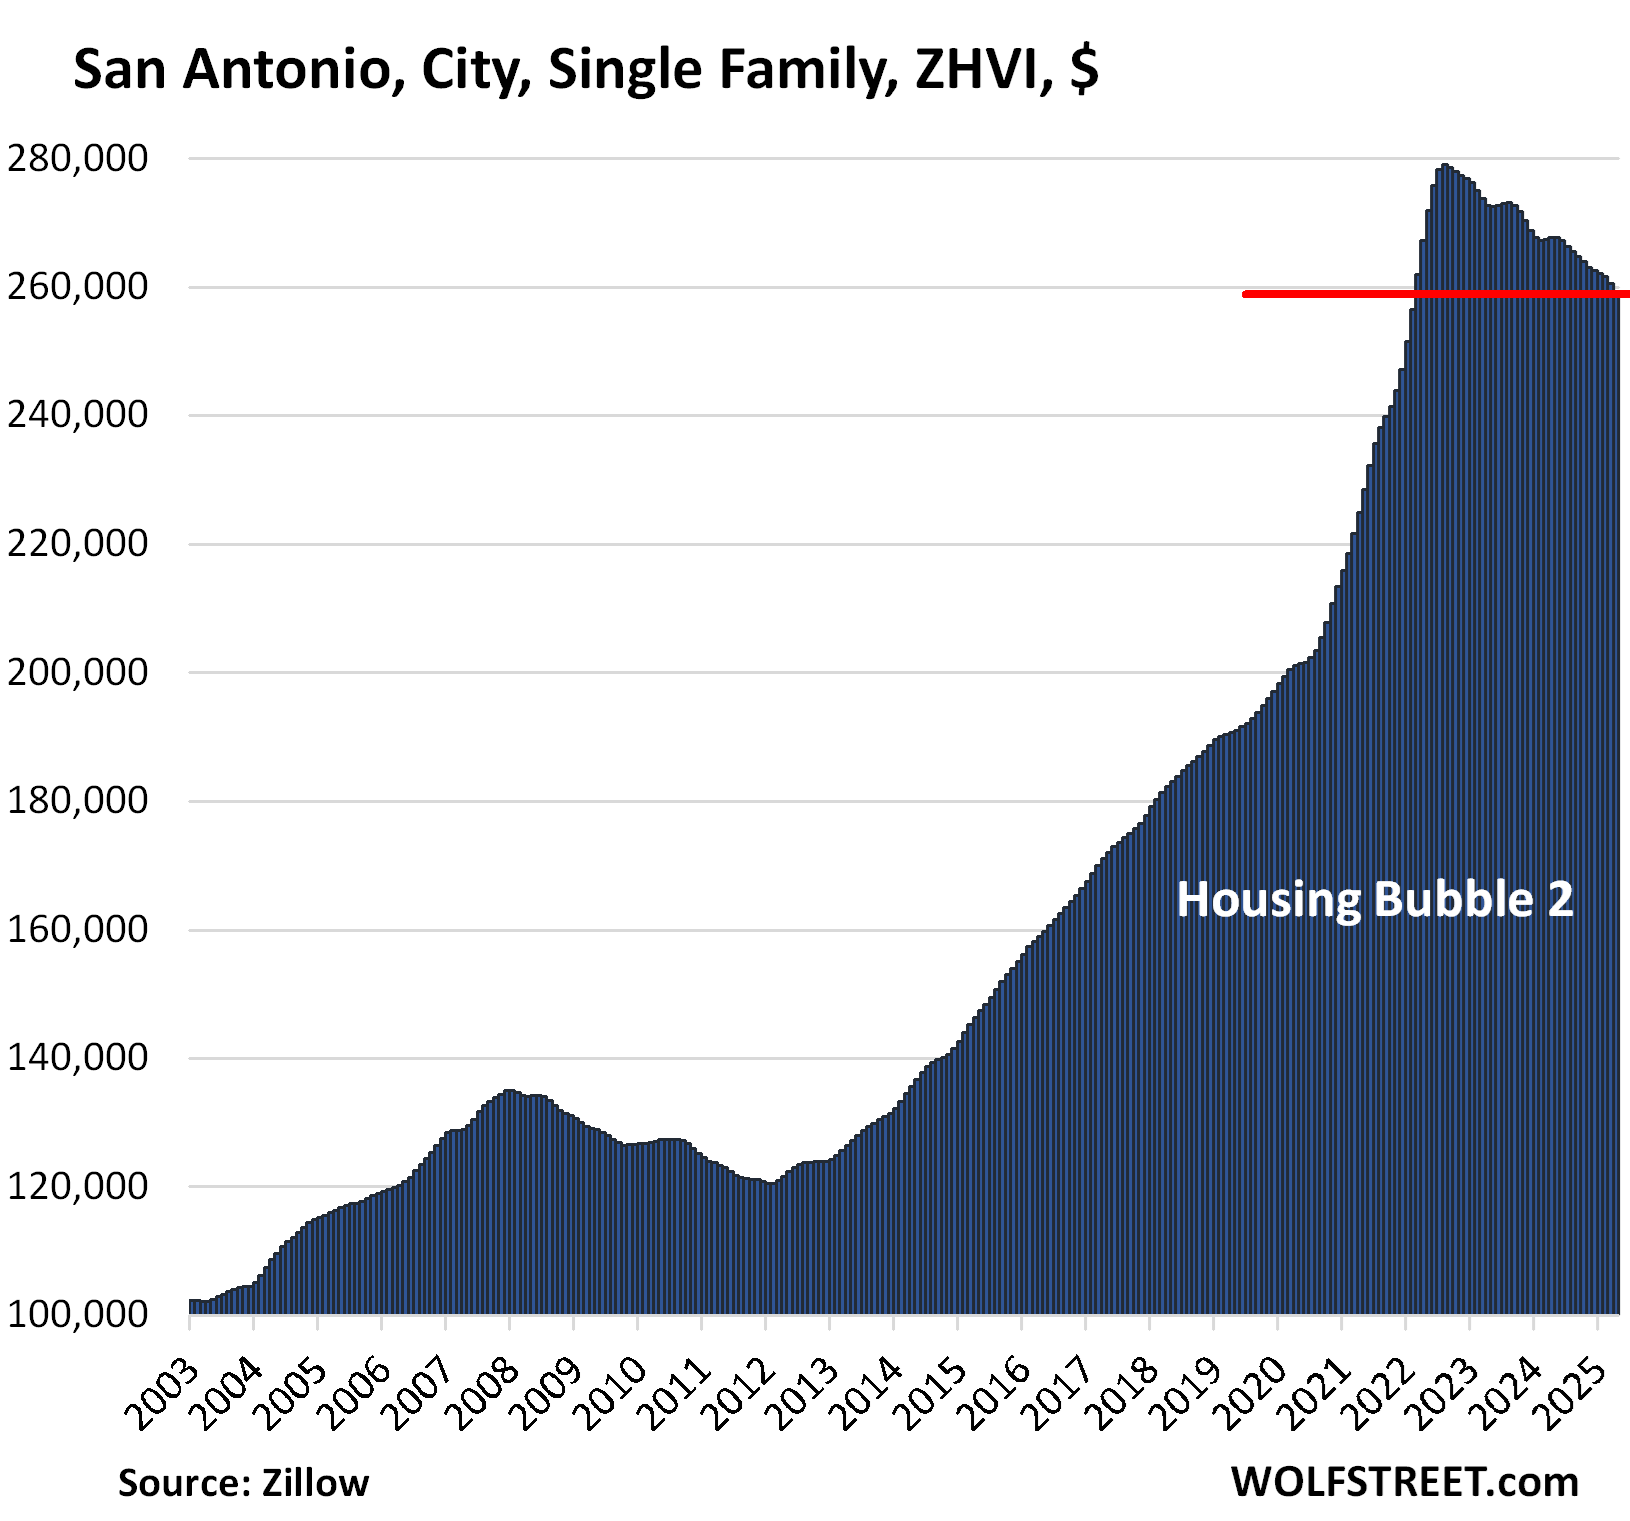
| San Antonio, City, Single-Family Home Prices | |||
| From Jul 2022 peak | MoM | YoY | Since 2000 |
| -7.1% | -0.5% | -3.1% | 154.9% |
Prices are back to about February 2022 levels.
In the 10 years through mid-2022, prices had shot up by 126%, while wages of workers covered by unemployment insurance have risen by only 34%. This is why these crazy home-price spikes are not sustainable; they trigger demand destruction, plunging sales, and surging inventories, the scenario now playing out, even in Texas.
Enjoy reading WOLF STREET and want to support it? You can donate. I appreciate it immensely. Click on the mug to find out how:

![]()
Energy News Beat