
By Wolf Richter for WOLF STREET.
What are we looking for? The National Bureau of Economic Research (NBER), which calls the official recessions in the US, has always defined recessions as broad economic downturns that include downturns in the labor market, such as declines in employment and significantly rising unemployment.
Weekly data for unemployment insurance benefits are the earliest indicators of systemic job losses. Among the data sets, weekly continued claims for unemployment benefits, also called “insured unemployment,” is our favorite Recession Indicator. It essentially counts the number of people receiving unemployment benefits after their initial claim.
The prior three business cycle recessions – not counting the Pandemic which was a lockdown, not a business cycle recession – came after Insured Unemployment had surged to:
2.64 million in December 2008, beg. of Great Recession
2.56 million in March 2001, beg. of 2001 Recession
2.49 million in July 1990, beg. of 1990 Recession.
The levels that entail a recession have risen as total employment has risen. This growth of employment over the years causes the Recession Indicator line to be slanted upward (black slanted line in the chart below).
Today, about 2.7 million insured unemployment would indicate the beginning of a recession.
But insured unemployment dipped by 29,000 in the latest week, to 1.88 million, according to the Labor Department today. The four-week average edged up by 8,750 to 1.87 million, essentially unchanged since October. These levels are still historically low, and far below the Recession Indicator of 2.7 million. The purple columns indicate recessions.
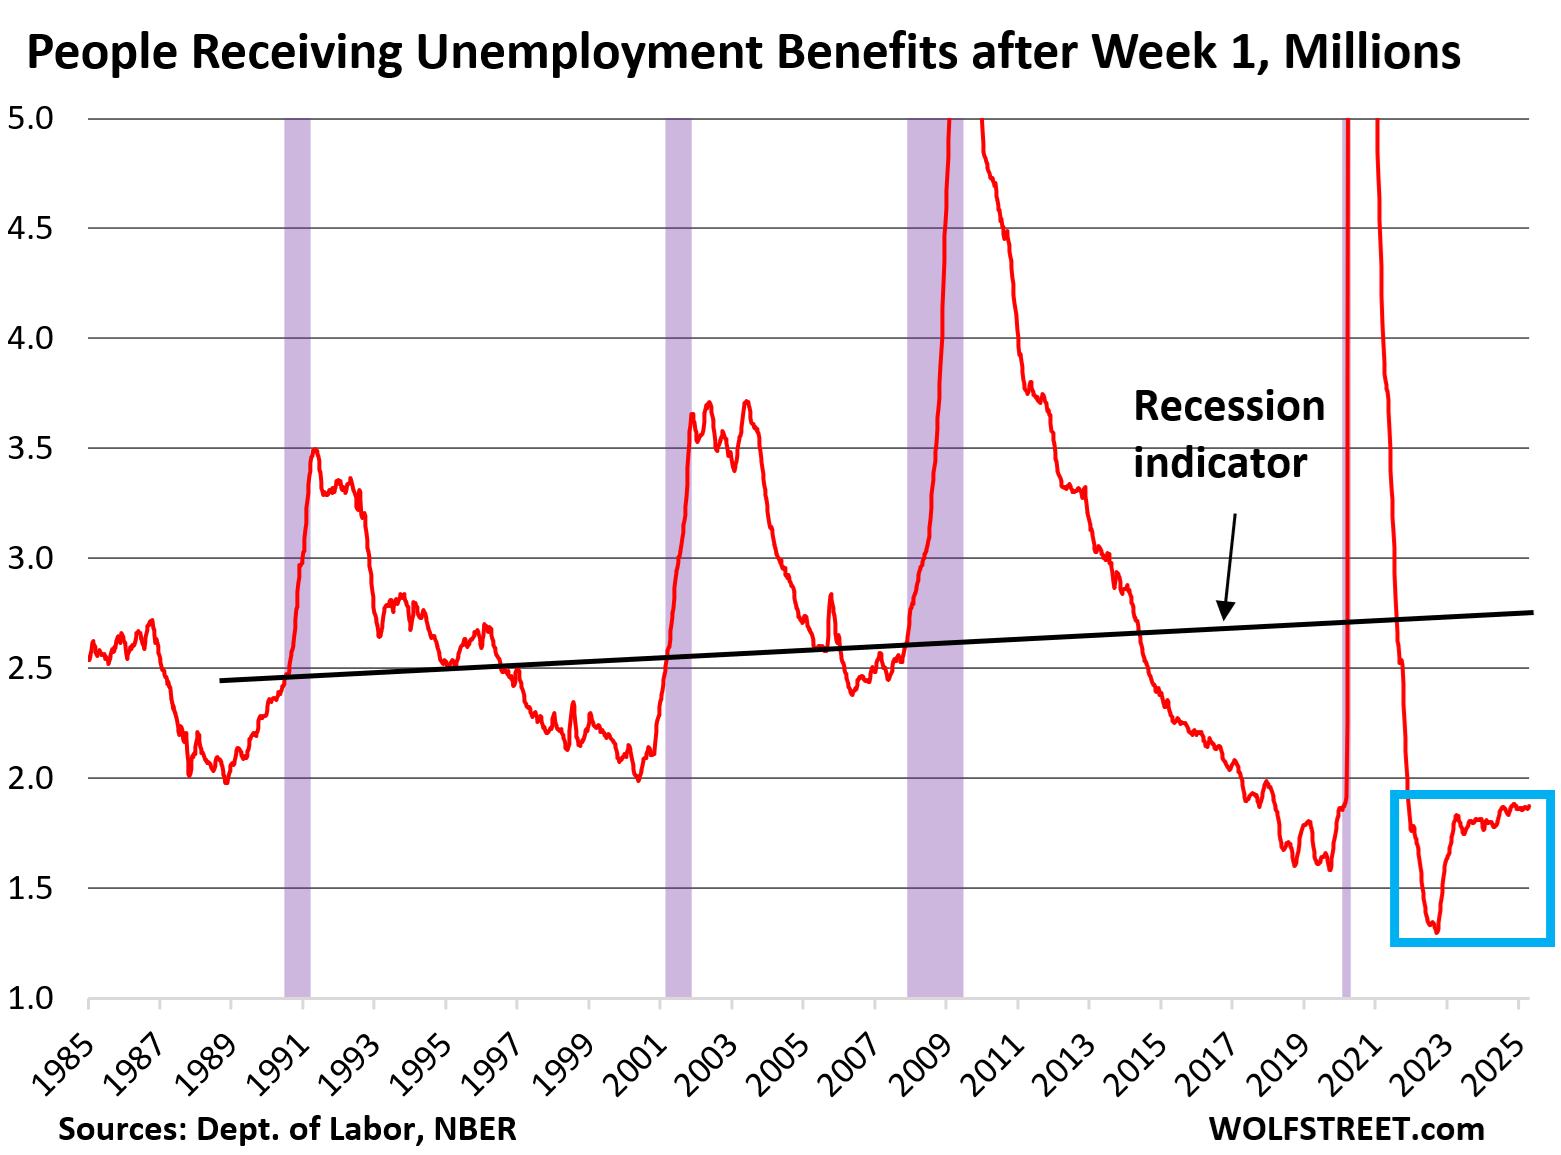
Watch for 1. surge to 2. high levels. This takes two factors: a surge, and high levels. Note how insured unemployment began to surge before a recession. It’s this kind of surge to much higher levels that we need to watch out for.
There was a surge in 2023, but from record low levels during the labor shortages, and since the level it surged to was still so low, that surge did not entail a recession; it just “rebalanced” the labor market.
This measure is a combination of two factors: Essentially, how many people got laid off, and how long it takes them to find a new job. If it takes people longer to find a job, even if there are few new people getting laid off, then that measure slowly rises, which was the case in 2024. But it has been roughly unchanged for the past six months.
It surges when there are suddenly lots of layoffs that the labor market cannot absorb, and the number of people receiving unemployment benefit rises sharply to much higher levels. That’s the recession indicator.
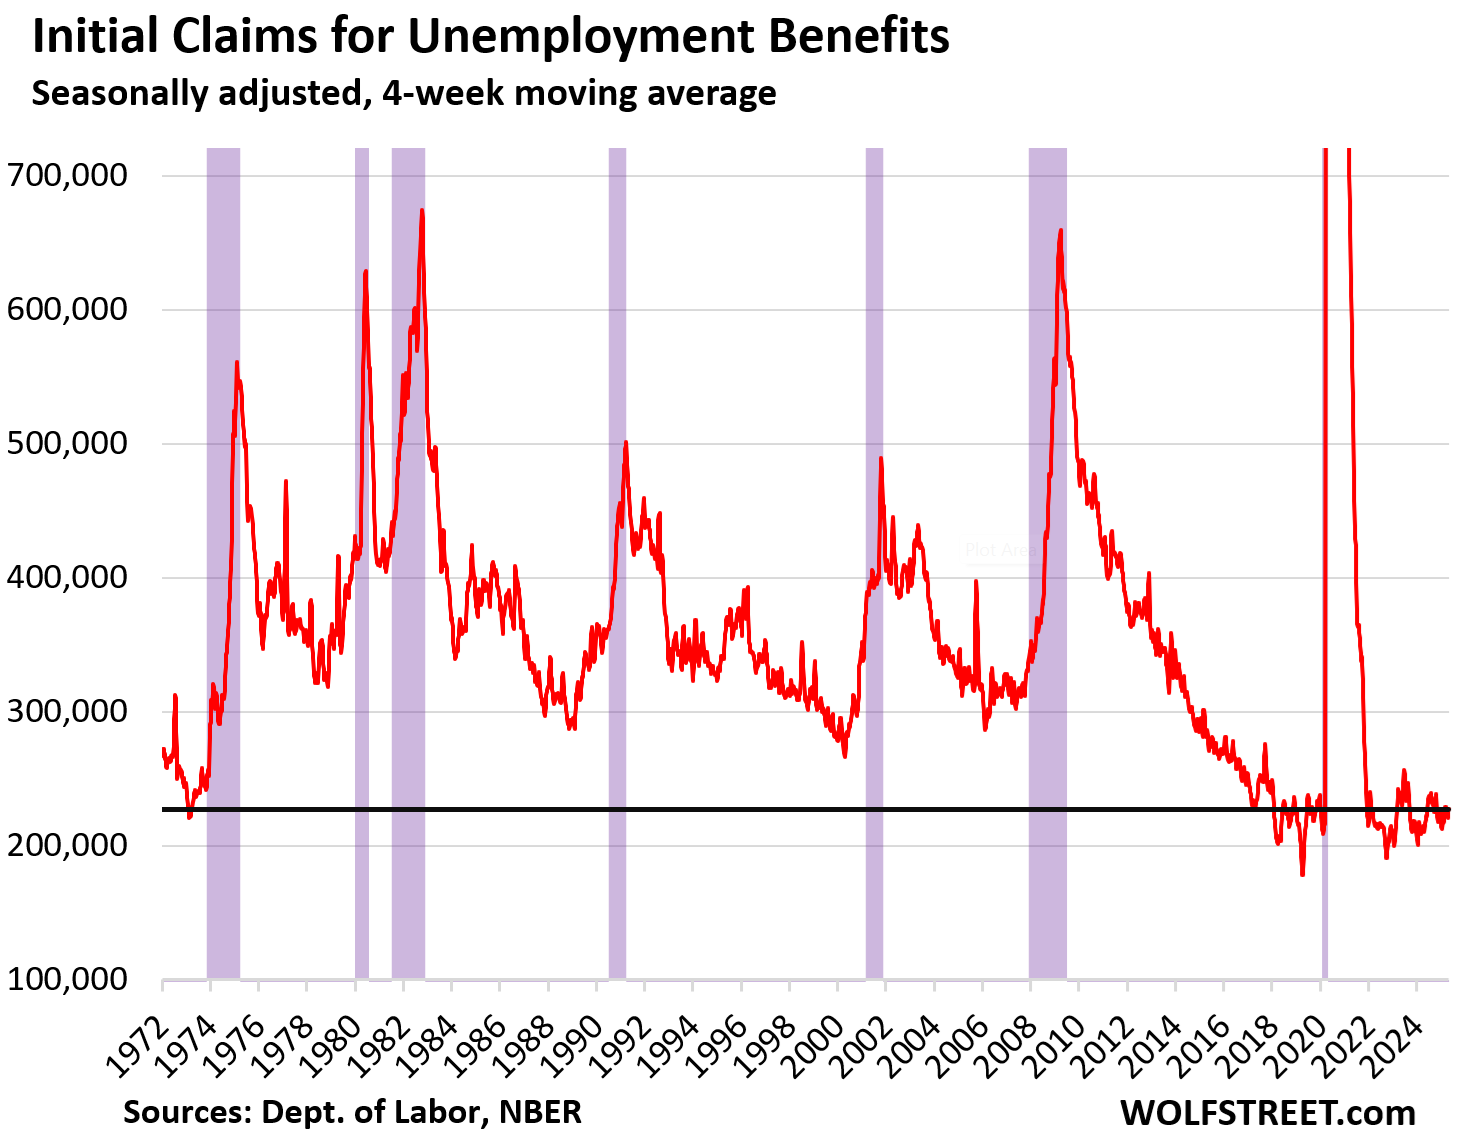
Layoffs are still historically low. Weekly initial claims for unemployment insurance benefits – people initially filing for unemployment insurance benefits after they got laid off – dipped by 13,000 in the latest week, to 228,000 seasonally adjusted, according to the Department of Labor today.
The four-week average, which irons out the week-to-week squiggles, edged up 1,000 to 227,000 and is historically low. The purple columns indicate recessions.
Note how those claims begin to surge before a business cycle recession (the 2020 recession wasn’t a business cycle recession but a lockdown).
The fact that insured unemployment (first chart) has risen from the labor-shortage lows in 2022, despite the low number of new layoffs (initial claims, second chart) indicates that it now takes more time to find a new job than it did back in 2022. And the low number of initial claims shows that few people are getting laid off. So companies are not cutting staff, but they’re slower in hiring than they were in 2022, though historically they’re still absorbing people at a fast clip.
These are signs of a reasonably “balanced” labor market, where supply of labor and demand for labor are roughly balanced, and that the labor shortages and the huge churn in the labor force in 2021 and 2022 are gone.
Negative GDP growth for other reasons. When a historic spike in imports, which are subtracted from GDP, pushes GDP growth into the negative, it’s not an indicator of a recession. A spike in imports is not a sign of weak demand, on the contrary. In Q1 2025, this situation happened, same as in Q1 2022, but consumer spending growth was OK and business investment was very strong, and so this was not a recessionary indication. But GDP is released quarterly and way behind.
Leading indicator. This data on unemployment insurance benefits is weekly and more immediate than monthly or quarterly data, and its surge to a high level warns of a recession in advance, which makes the Recession Indicator a leading indicator.
Enjoy reading WOLF STREET and want to support it? You can donate. I appreciate it immensely. Click on the mug to find out how:

![]()
Energy News Beat