
The millions of immigrants that arrived in 2021-2024 finally get picked up in the data for labor force and total employment, which continued to spike.
By Wolf Richter for WOLF STREET.
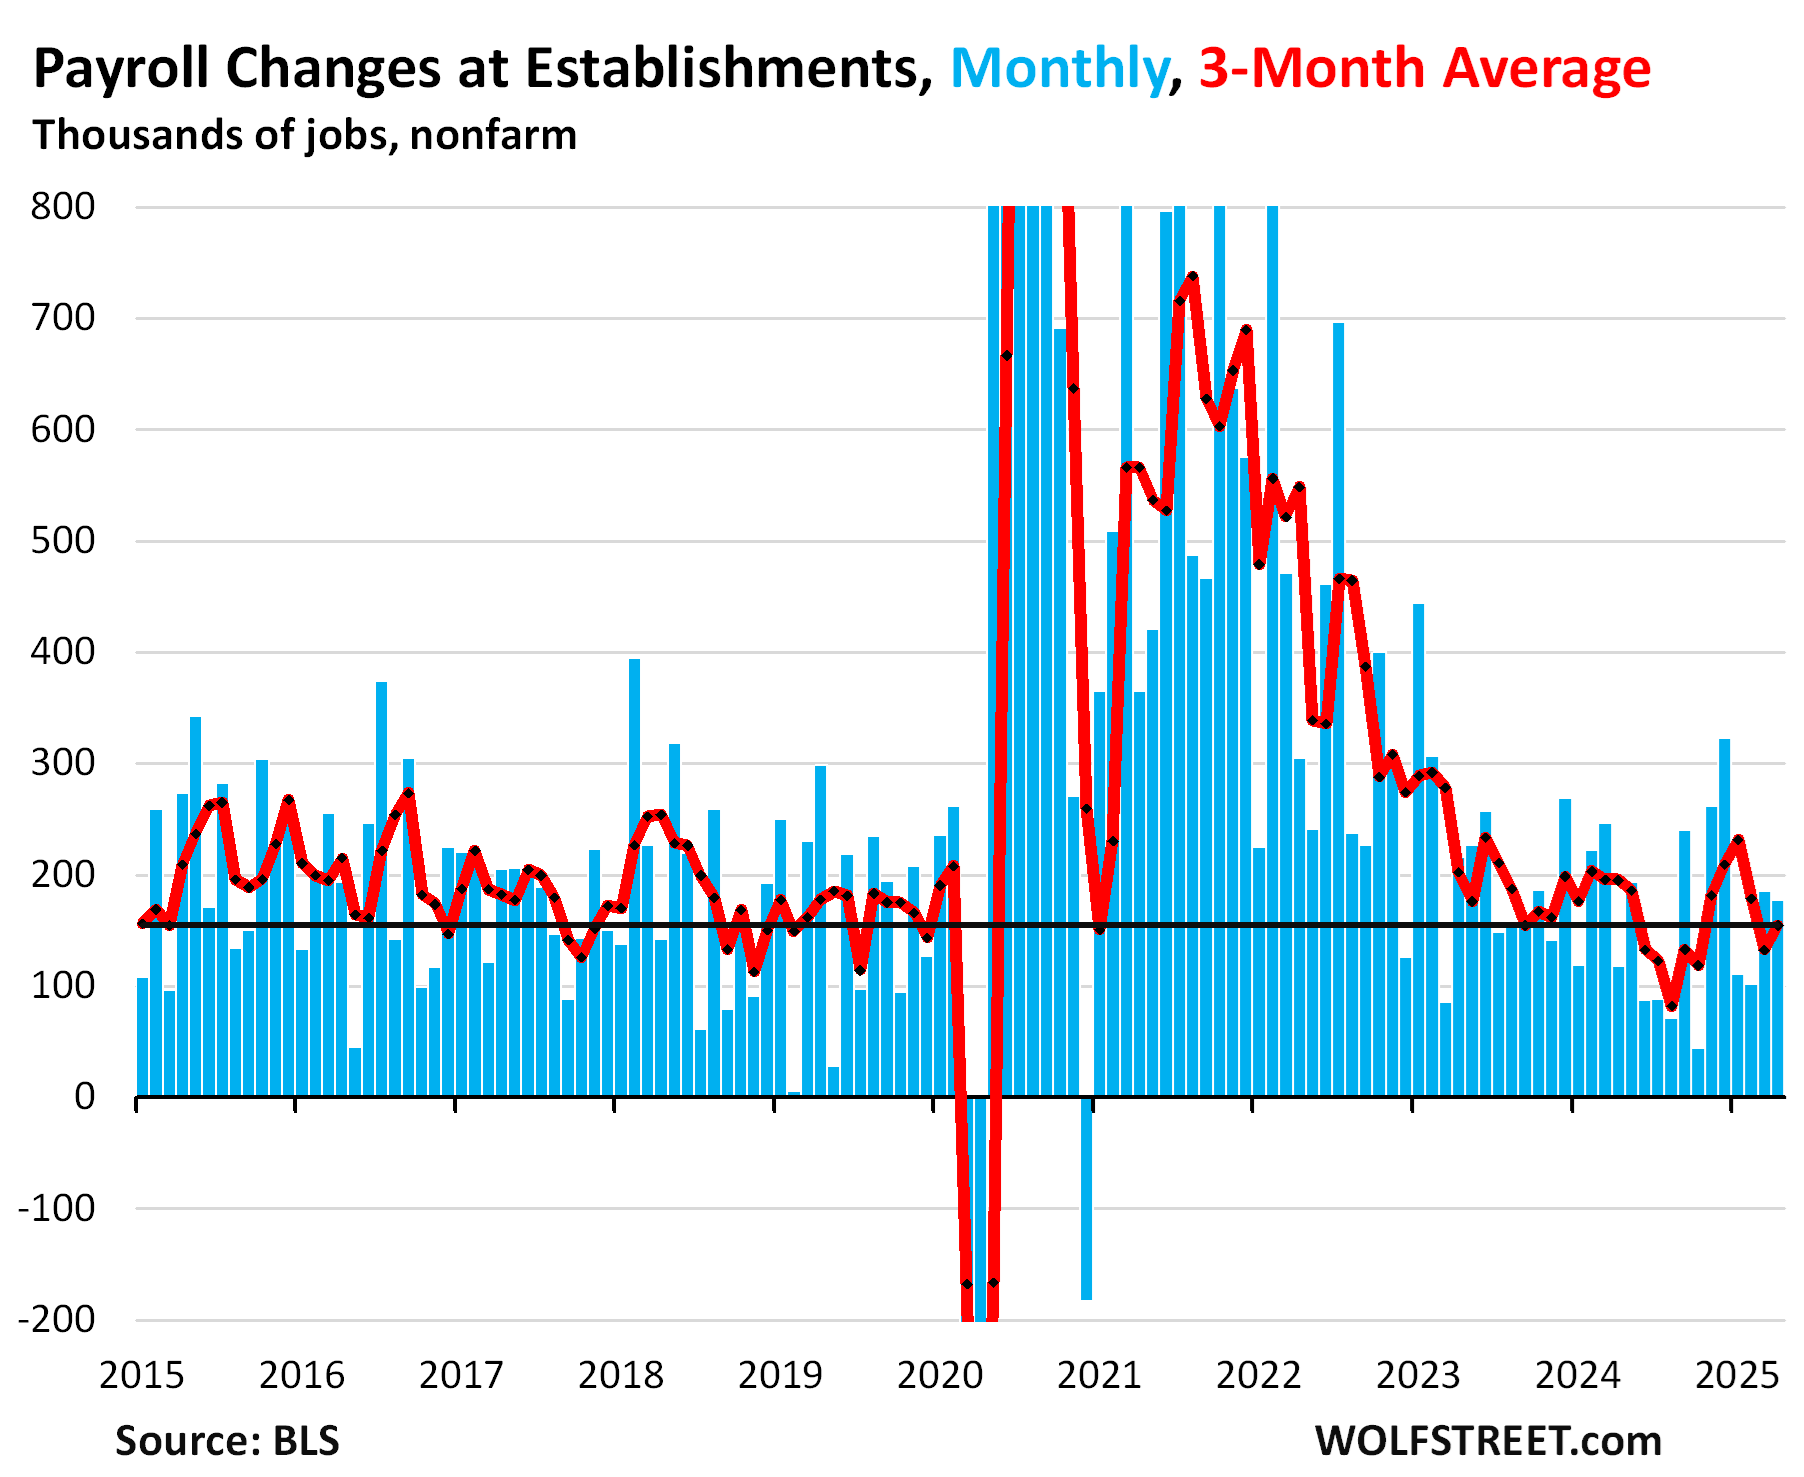
Total nonfarm payrolls rose by 177,000 in April from March, well above the 12-month average of 157,000 for the second month in a row, to a record 159.5 million jobs at employers, not including farm jobs and some independent workers, according to the Bureau of Labor Statistics today (blue columns in the chart).
The three-month average job creation, which includes the revisions – March job creation was revised down to 185,000 and February to 102,000 – rose to 155,000 jobs created per month, which is in solid territory (red line).
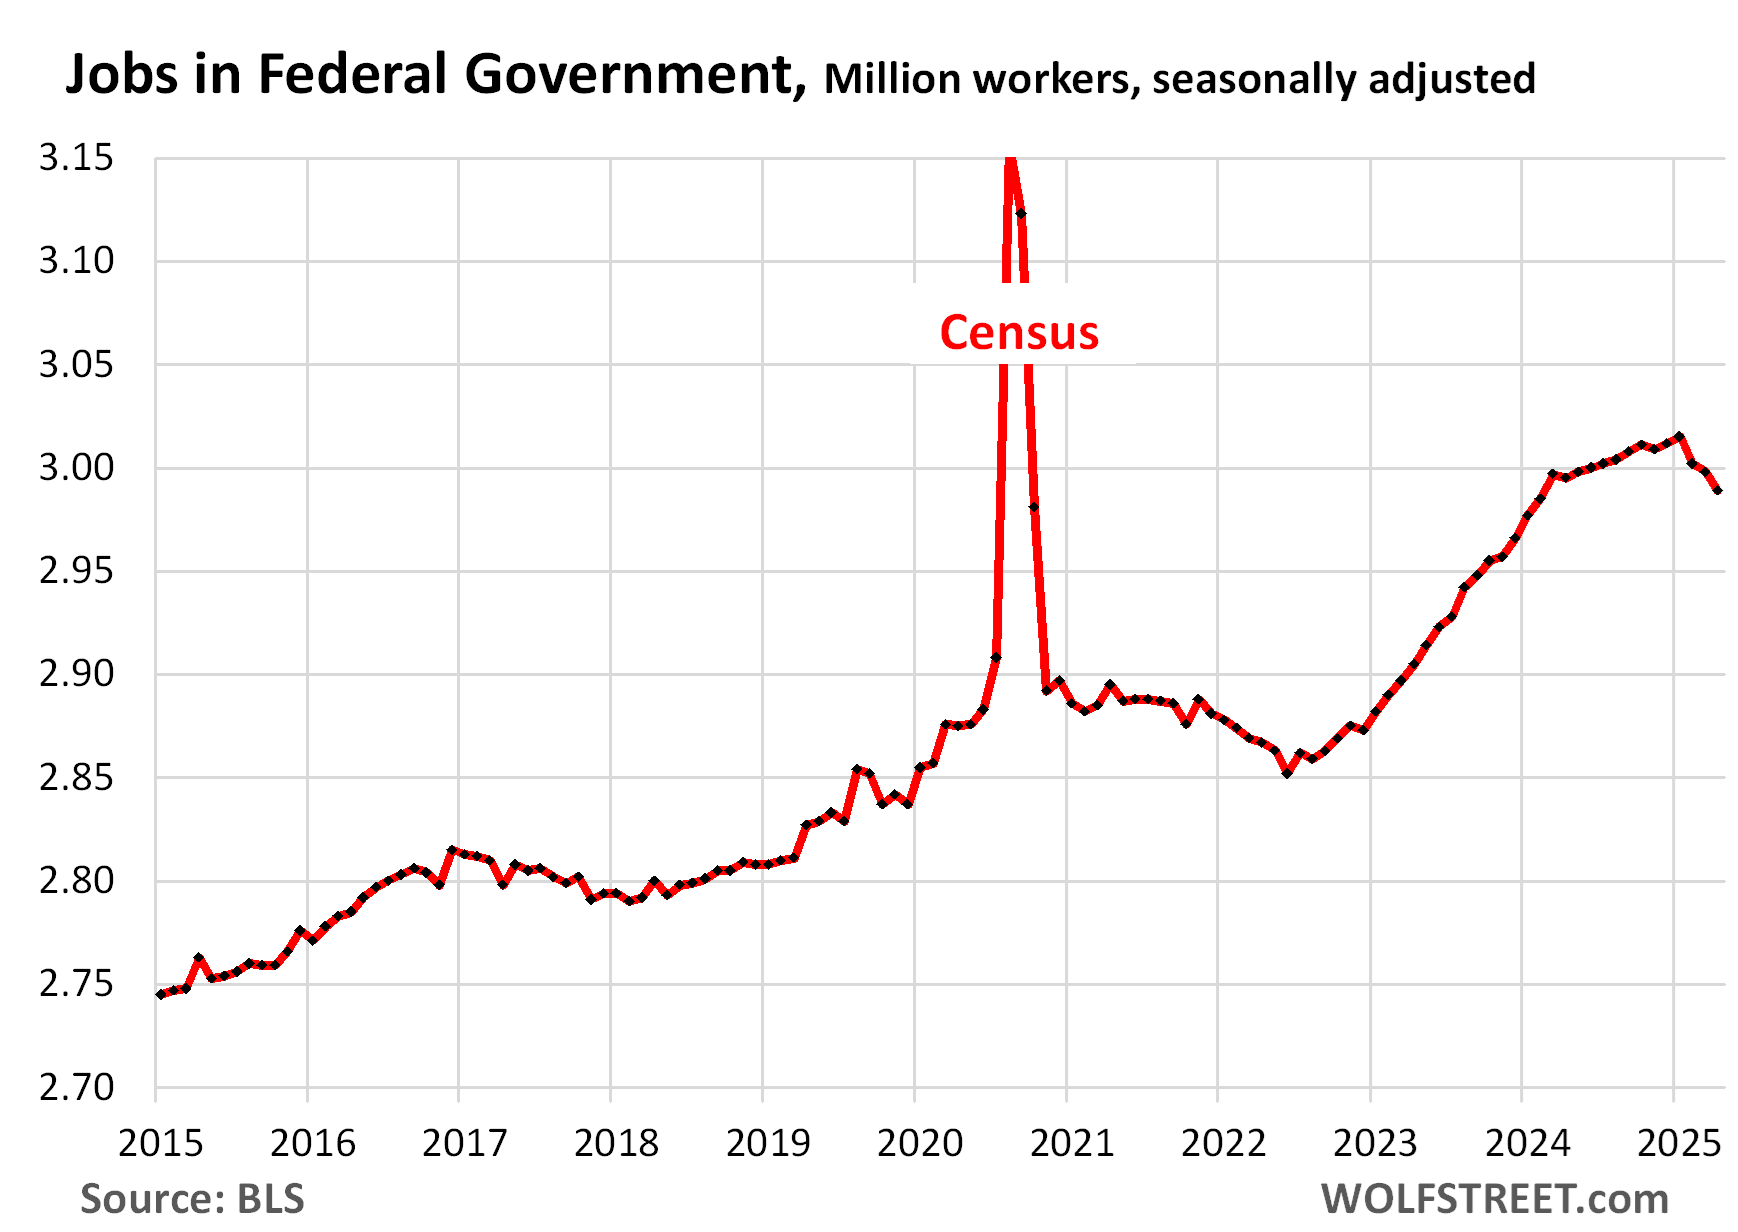
The weak spot: civilian employment at the federal government fell by 9,000 jobs in April from March, 2.99 million, the third month in a row of declines, bringing the three-month decline to 26,000. These job cuts have unwound Biden’s federal government hiring surge back to February 2024.
But the data still doesn’t capture the full effects of the job cuts so far: Workers on paid leave or receiving severance pay are counted as employed until they stop being paid, the BLS noted.
And it does not include employees working for companies that have contracts with the government and that are now getting laid off. These workers are counted in the various nongovernment categories, such as in the huge category of “Professional and business services,” where employment has actually increased over the past three months by 35,000, including by 17,000 in April, despite the layoffs at some government contractors.
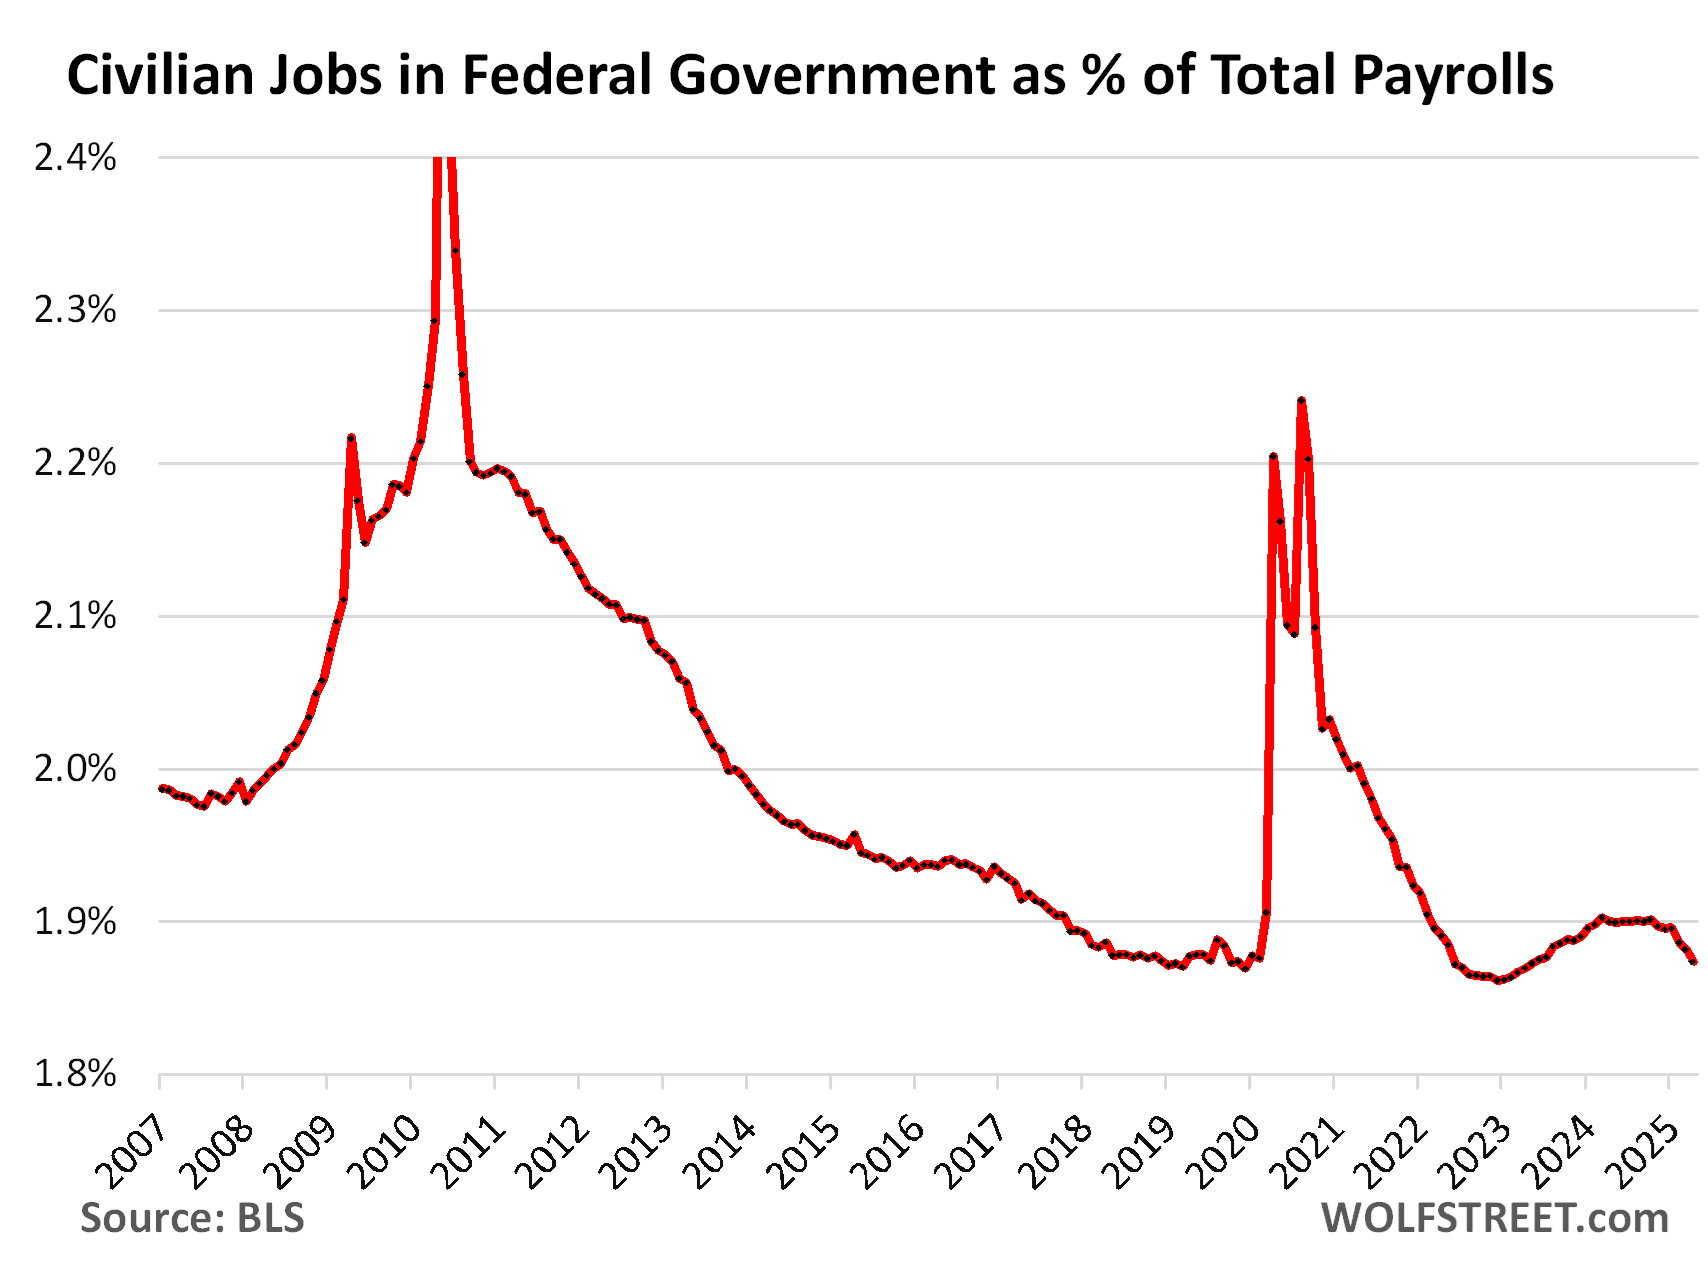
The share of civilian federal government employment in total nonfarm payrolls dipped to 1.87%, the lowest since May 2023. The ratio had stabilized in the second half of 2024 at 1.9%, as government jobs grew at the same pace as private-sector jobs. It started declining in November 2024, as government jobs grew more slowly than private-sector jobs. And this year, it has been heading south faster, on declining federal government jobs and rising private sector jobs.
This relatively low ratio of federal government payrolls (2.99 million) to total nonfarm payrolls (159.5 million) indicates that the job cuts at the federal government, once they’re implemented to the full extent, will not make a big-fat dent in overall employment.
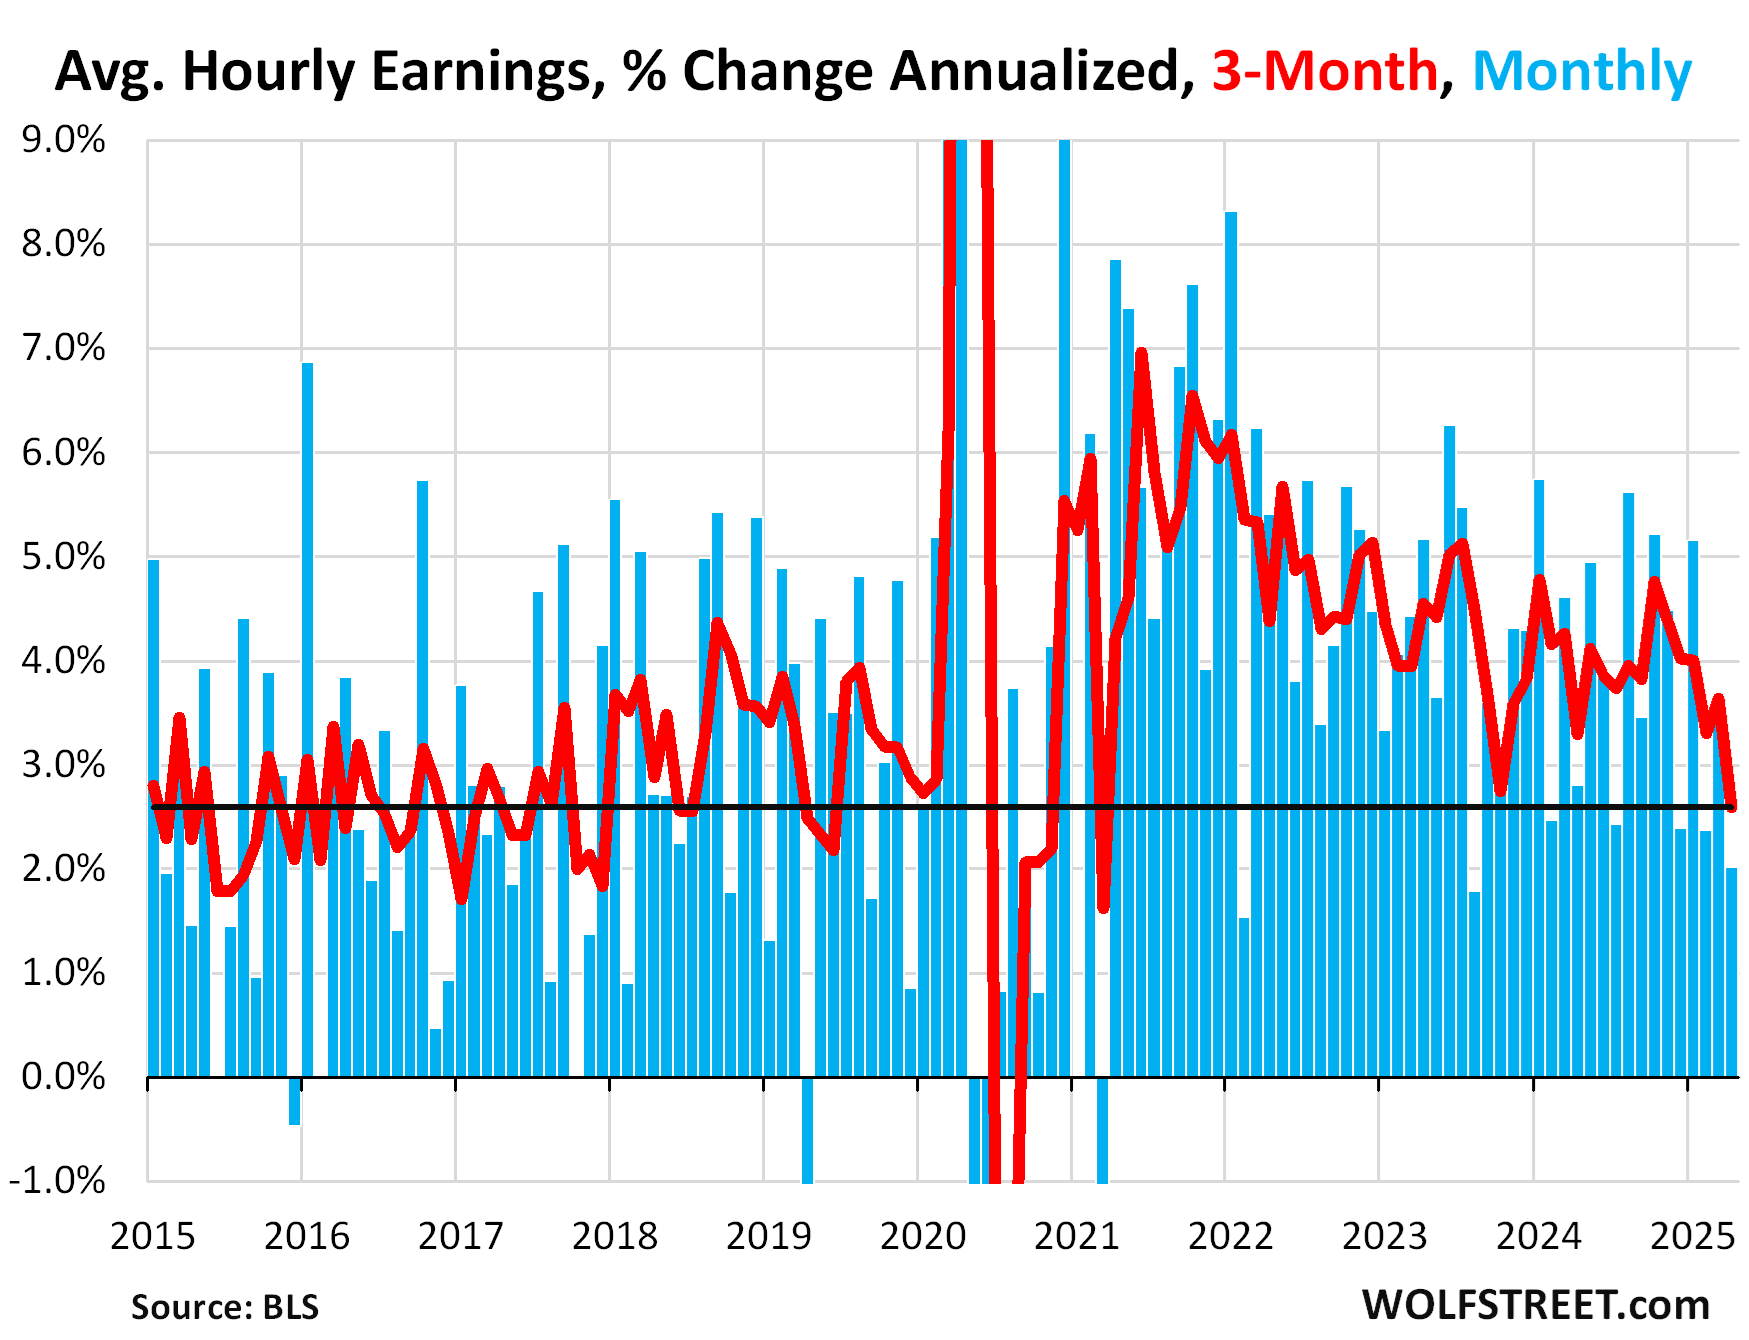
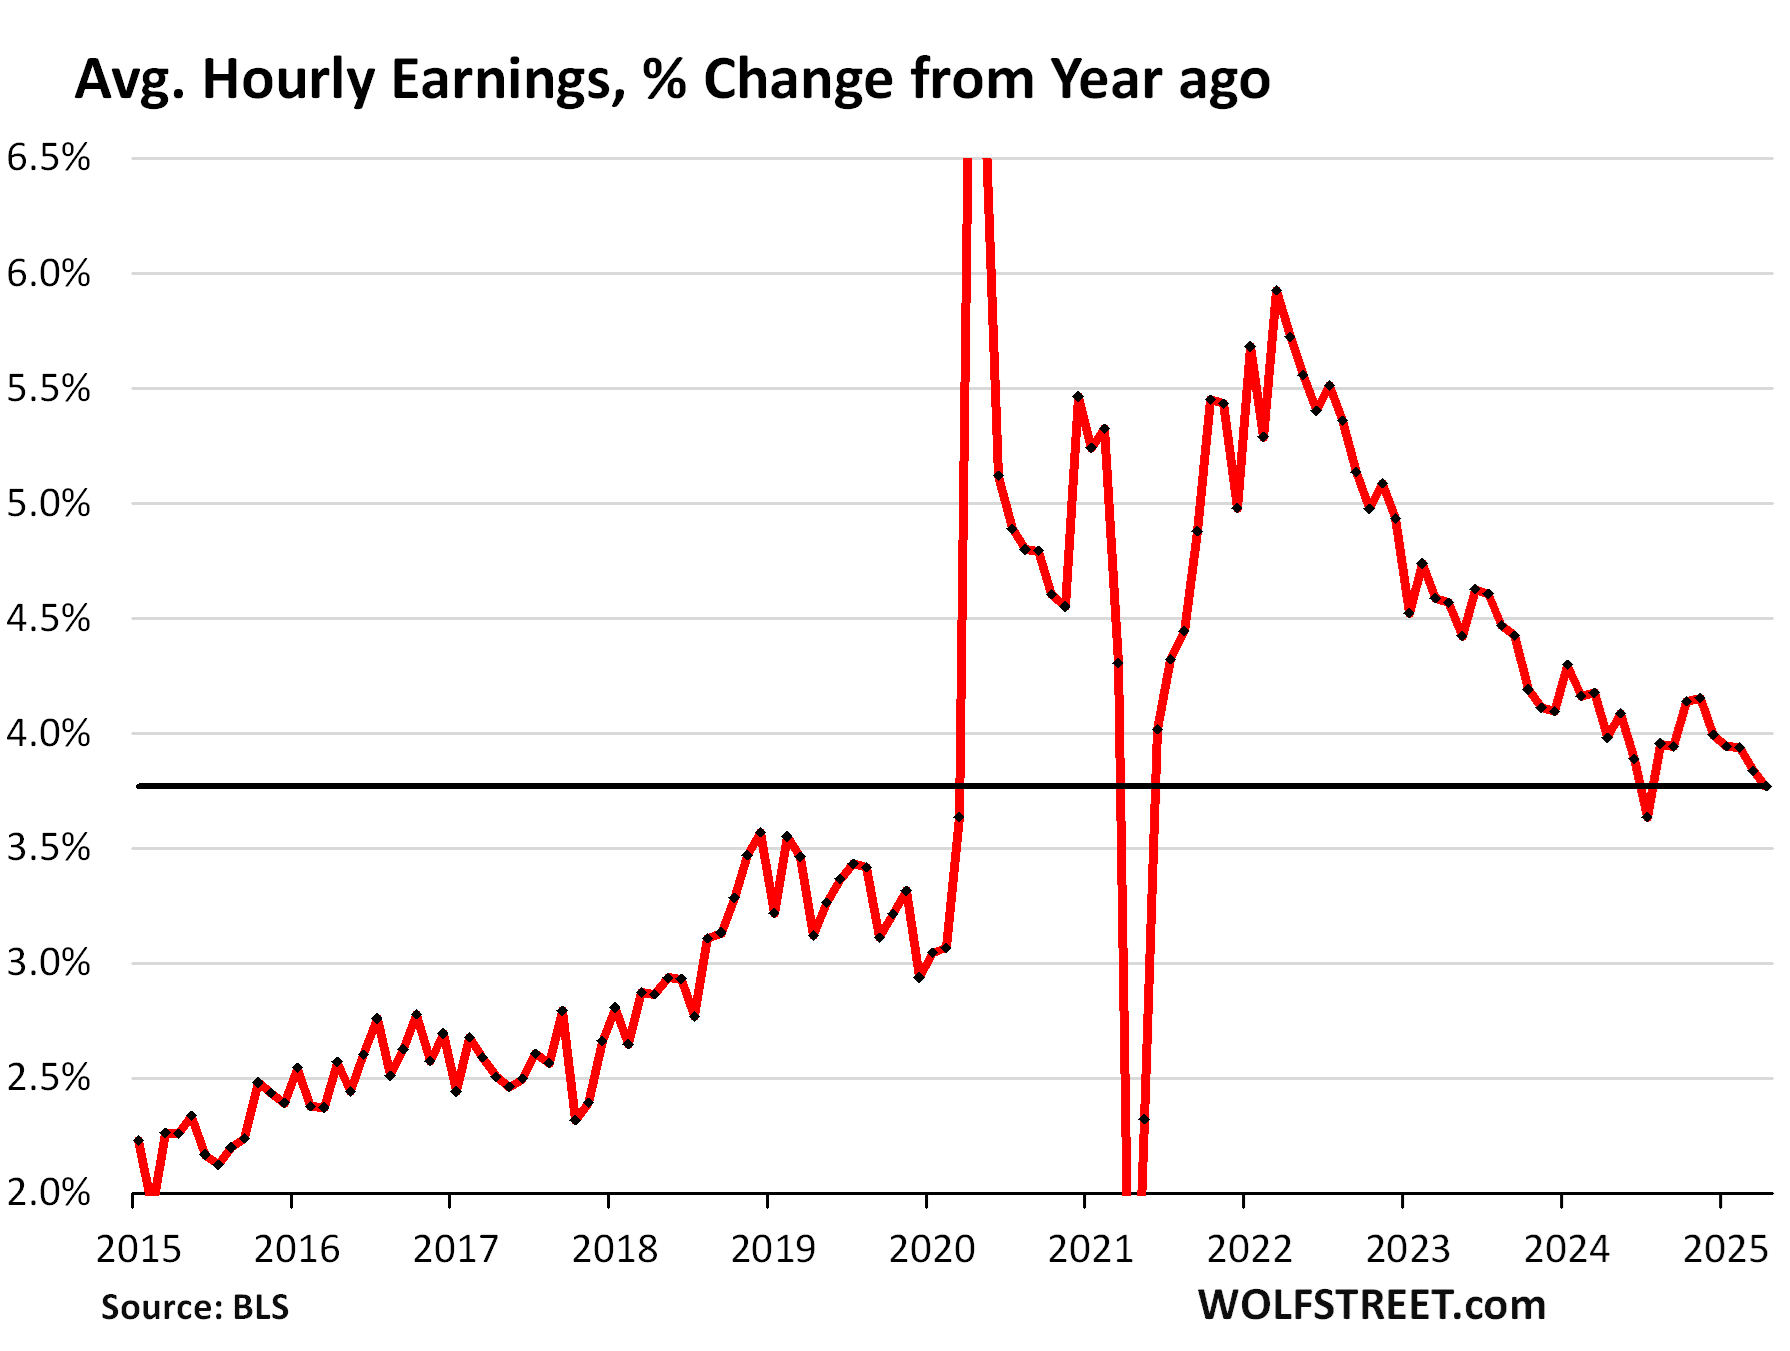
Average hourly earnings rose by only 0.17% in April from March (2.0% annualized), the slowest month-to-month growth since August 2023. March growth was revised up to 0.28% (+3.4% annualized).
The three-month average growth (red line) decelerated to +2.6% annualized, the slowest growth in average hourly earnings since before the pandemic. Clearly, the wage pressures have abated and are now back to prepandemic levels.
I’ll just say this here with an eye on the chart below: The Biden surge of millions of immigrants in 2021-2024 that is now finally getting picked up in the employment data – discussed further below – threw a sudden and vast supply of very cheap labor on the labor market that has squashed the big wage increases during the pandemic that workers at the lowest levels of the wage scale had obtained, and had filtered up from there, which is what we can now see in the average hourly wage data here. Powell has also pointed this out. Employers celebrate this, workers not so much:
Year-over-year, average hourly earnings rose by 3.8% in April, also showing the cooling trend, though it remains above the peak growth rates in the years before the pandemic.
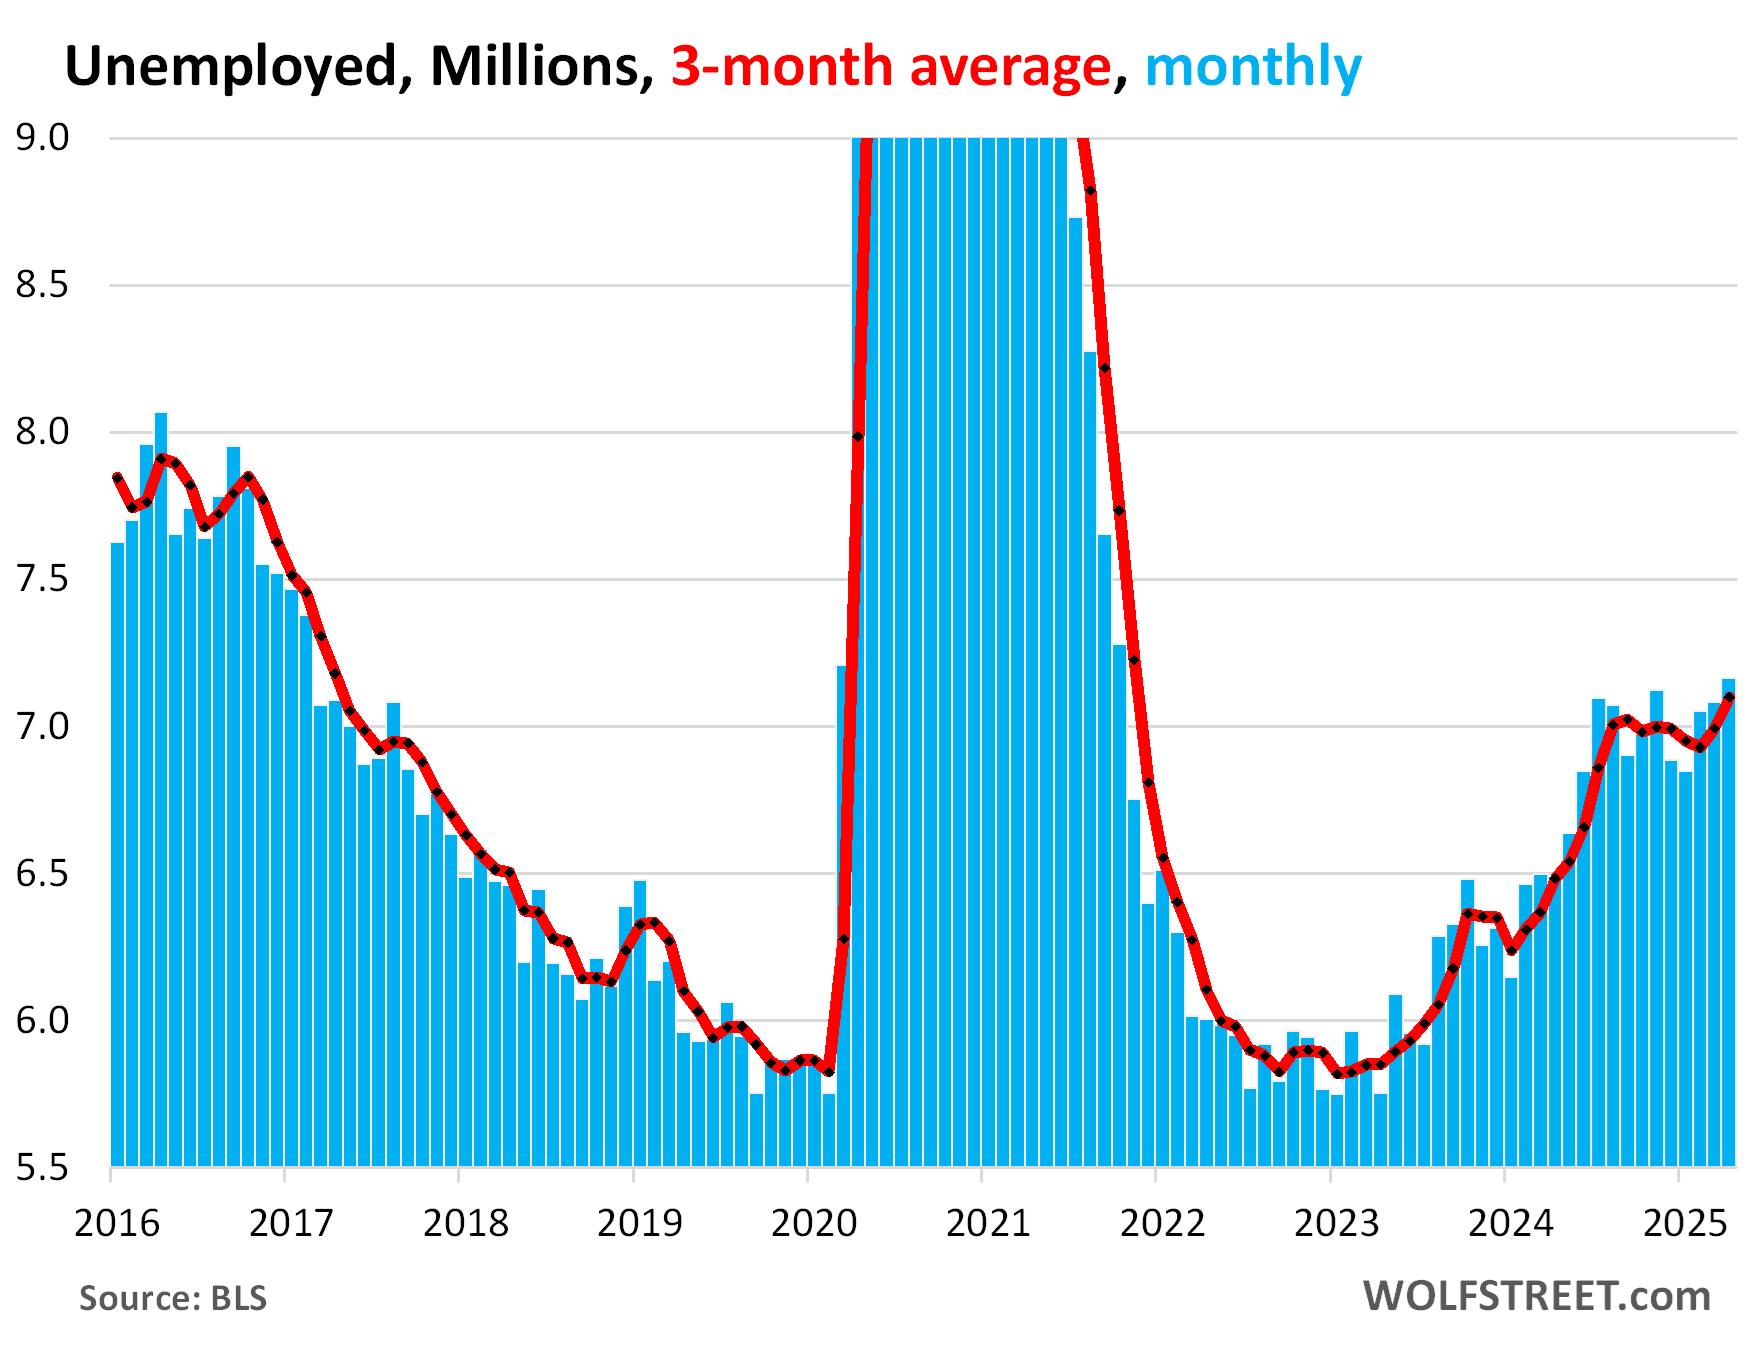
Unemployment rose by 82,000 to 7.16 million people who were actively looking for a job during the survey period, according to the BLS household survey data today, on the continued spike in the labor force data that finally this year started picking up the millions of 2021-2024 immigrants.
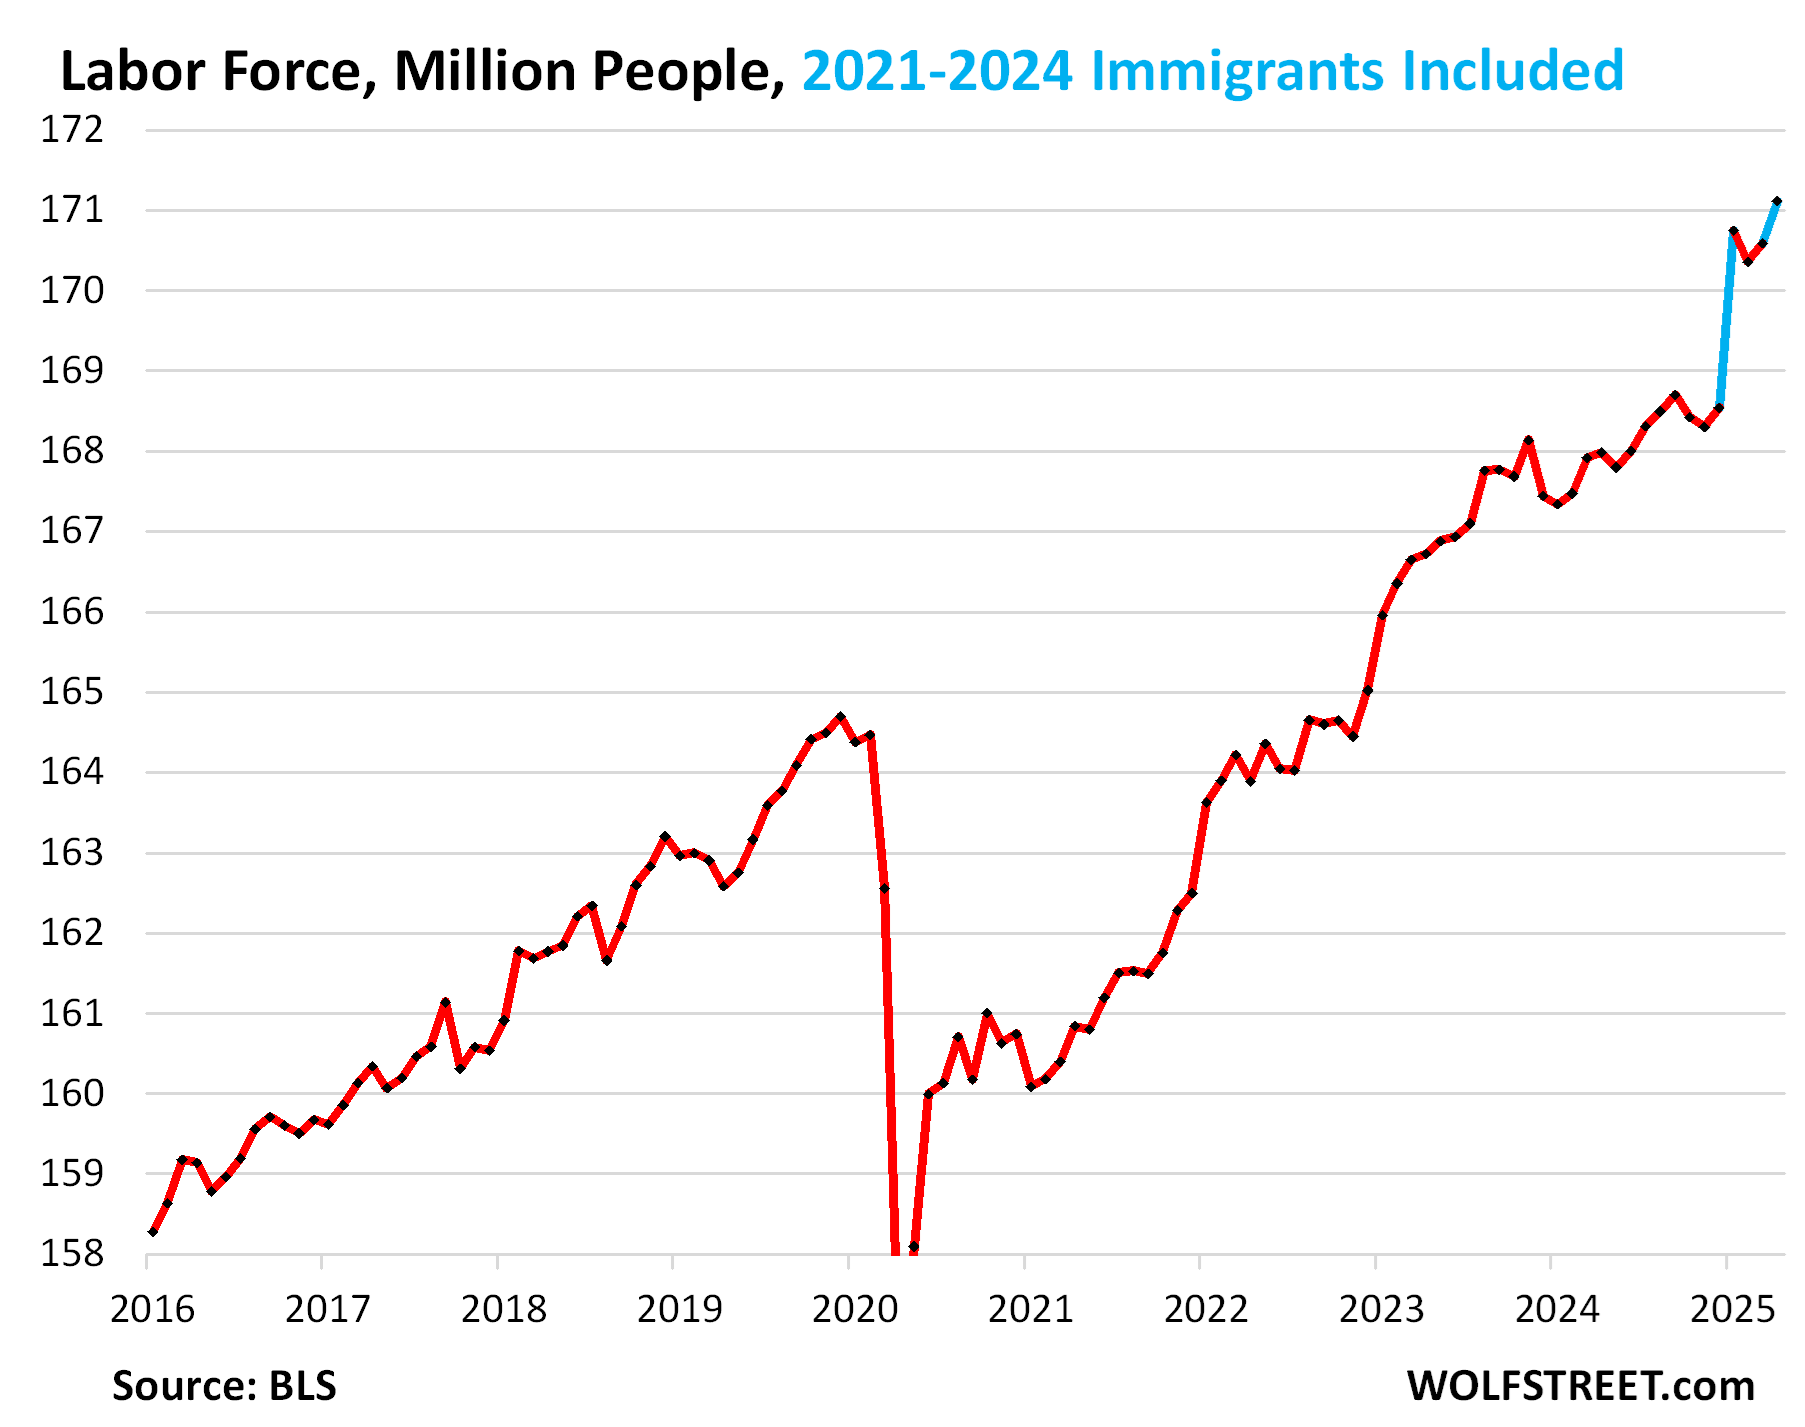
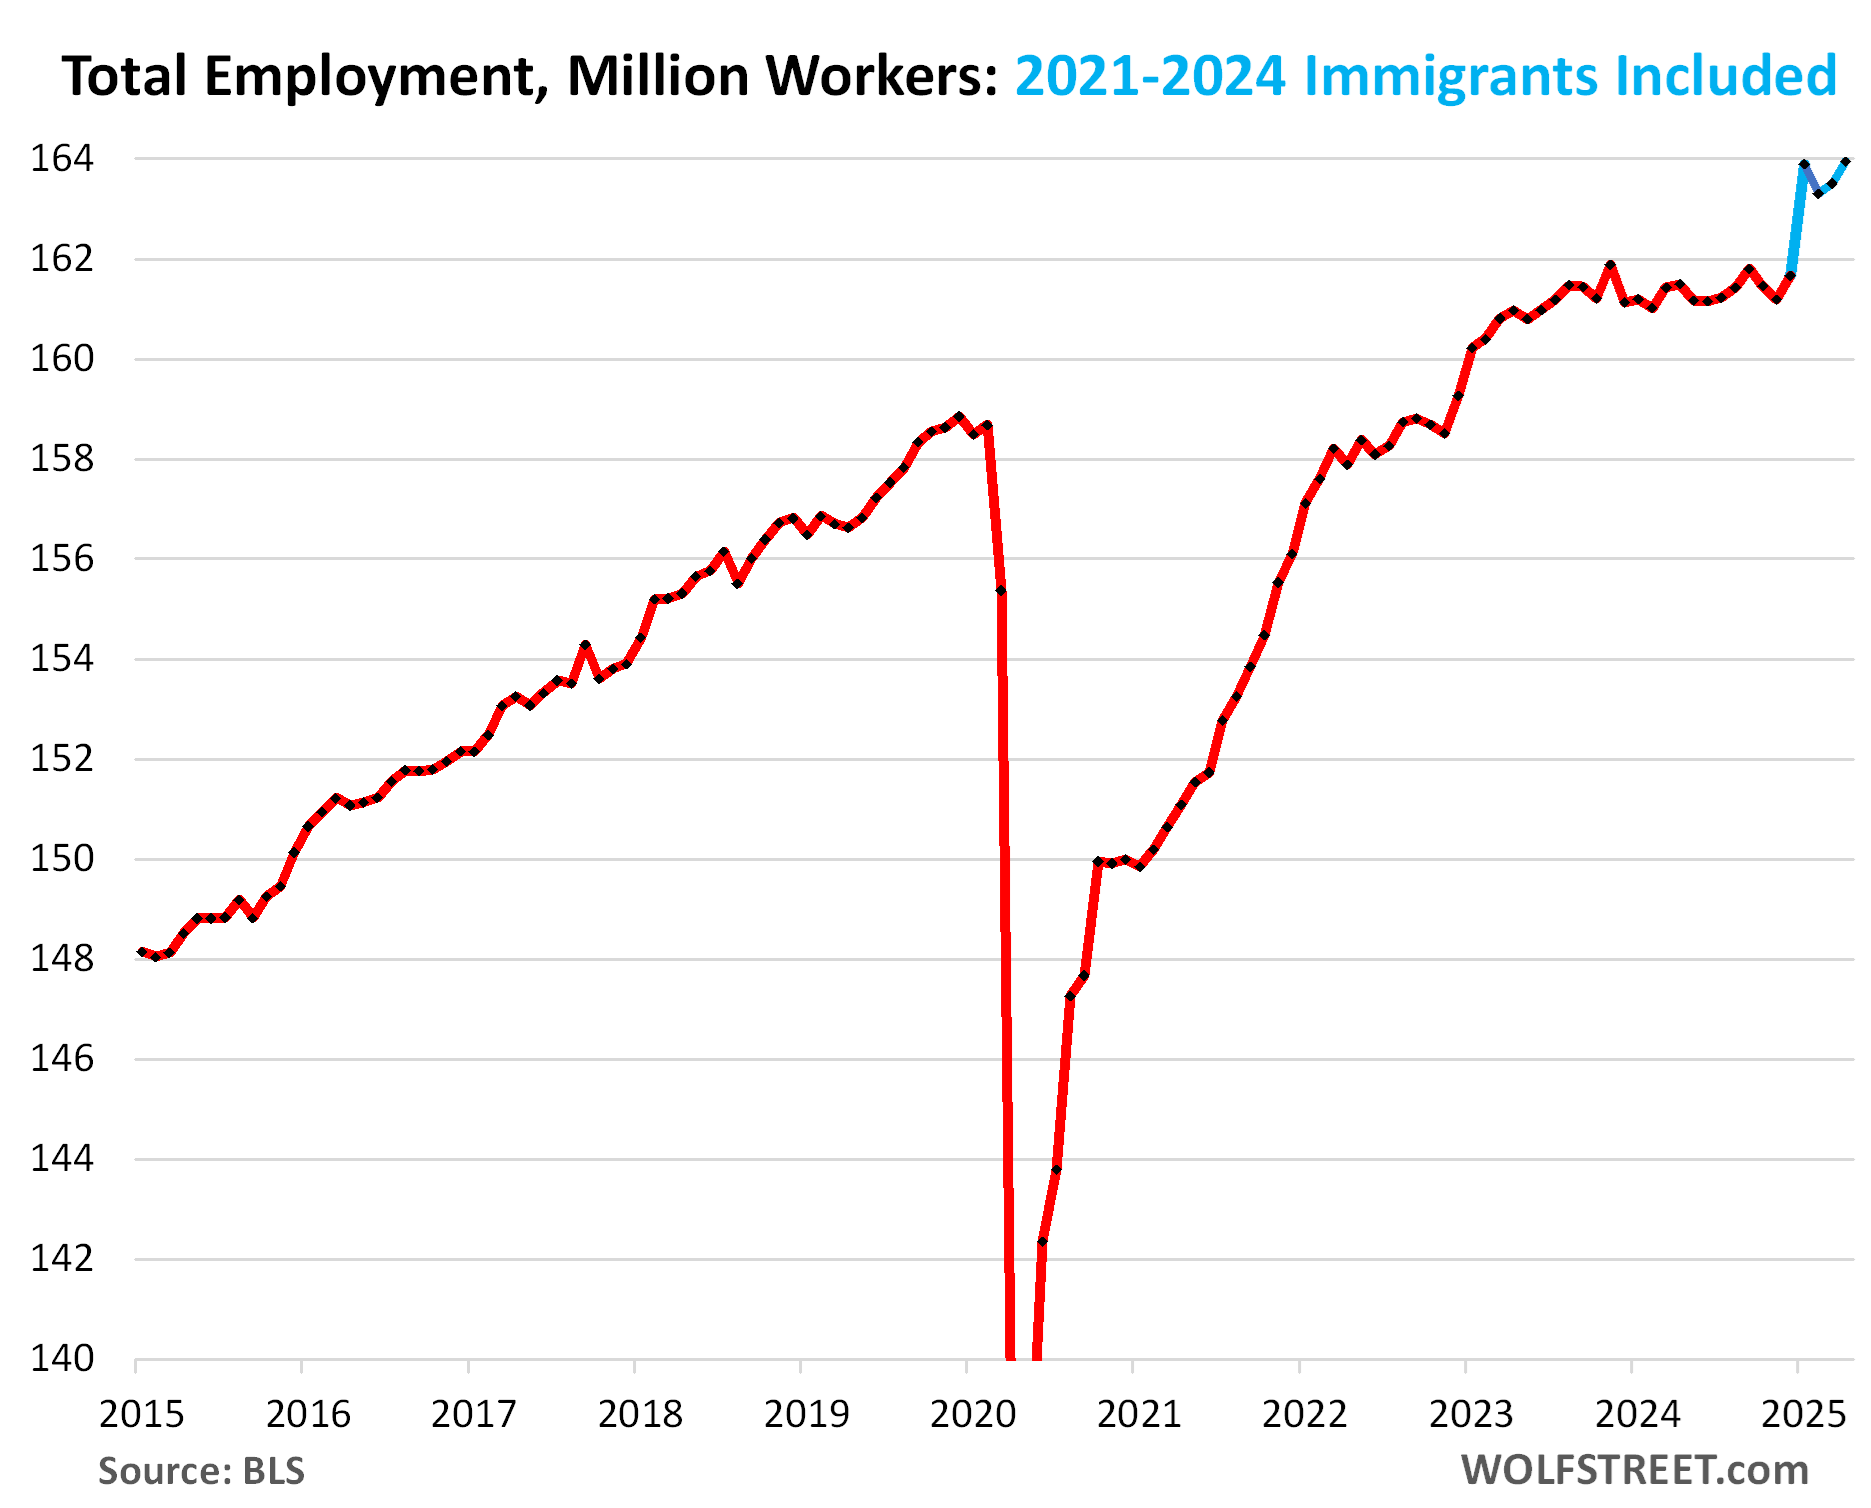
The inclusion in the household employment data this year of the surge in immigrants in 2021-2024 has caused the labor force to spike by 2.56 million so far this year, has caused total employment to spike by 2.28 million so far this year, and has pushed up the number of unemployed.
I discussed in detail this sudden inclusion of millions of immigrants in the data this year back when the January data was released: Huge Upward Adjustment to Employment & Labor Force as Wave of Immigrants is Finally Included: The Annual Revisions Are Here
So these are the dynamics we’re seeing here.
The labor force jumped by 518,000 in April from March. So far this year, it has spiked by 2.56 million people, to 171.1 million people, who are either working or are looking for work.
The millions of immigrants that came into the US between 2021 and 2024 were not picked up in the Census population data until late 2024. So in January, as it does every year, the BLS adjusted its household employment data to the new Census population data – hence the spike in the labor force, the spike in total employment, and the increase in the number of unemployed.
Total employment, including farm workers and independent workers, jumped by 436,000 in April from March, having now spiked by 2.28 million so far this year, as the data were adjusted for the immigrants that had arrived in 2021-2024:
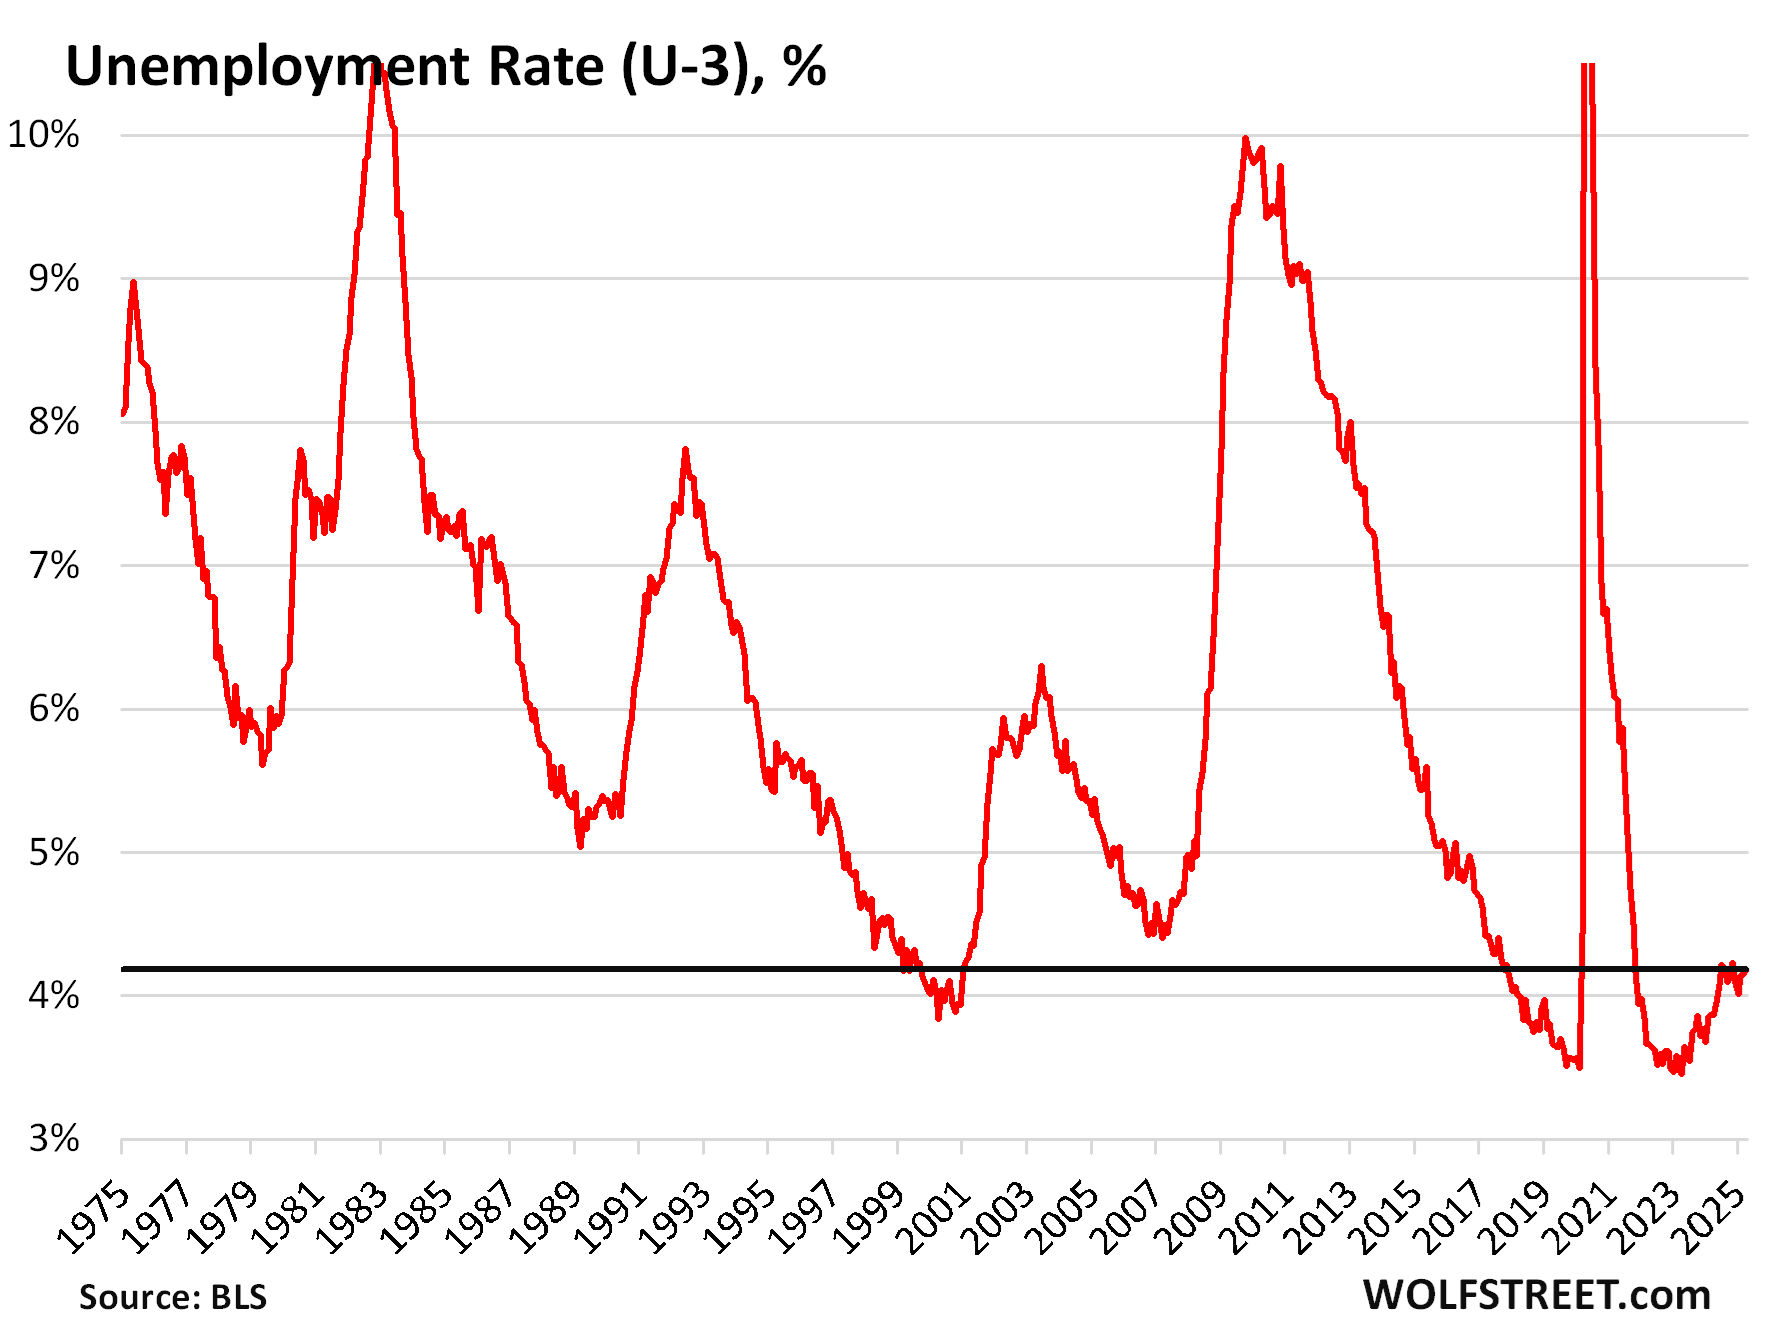
The headline unemployment rate (U-3) remained at 4.2% in April. Since June 2024, the unemployment rate has stabilized at the historically low range of 4.0% to 4.2%.
The unemployment rate = number of unemployed people who are actively looking for a job (7.16 million, see chart above) divided by the labor force (171.1 million, see chart above).
An unemployment rate of 4.2% is a sign of a solid balanced labor market, despite the huge influx in just three years of millions of immigrants, and below the Fed’s median projection at the March meeting of 4.4% for the end of 2025:
Enjoy reading WOLF STREET and want to support it? You can donate. I appreciate it immensely. Click on the mug to find out how:

![]()
Energy News Beat