
By Wolf Richter for WOLF STREET.
Retail sales in March jumped majestically, and January and February were revised higher, and it wasn’t just motor vehicle sales and tariff-frontrunning, or whatever, but also sales in restaurants and bars where sales jumped, a sign that consumers are splurging, not frontrunning. They’re in a foul mood in sentiment surveys because they hate high prices and inflation, but they’re out there having fun and spending money. The recession is going to have to get back in line and wait.
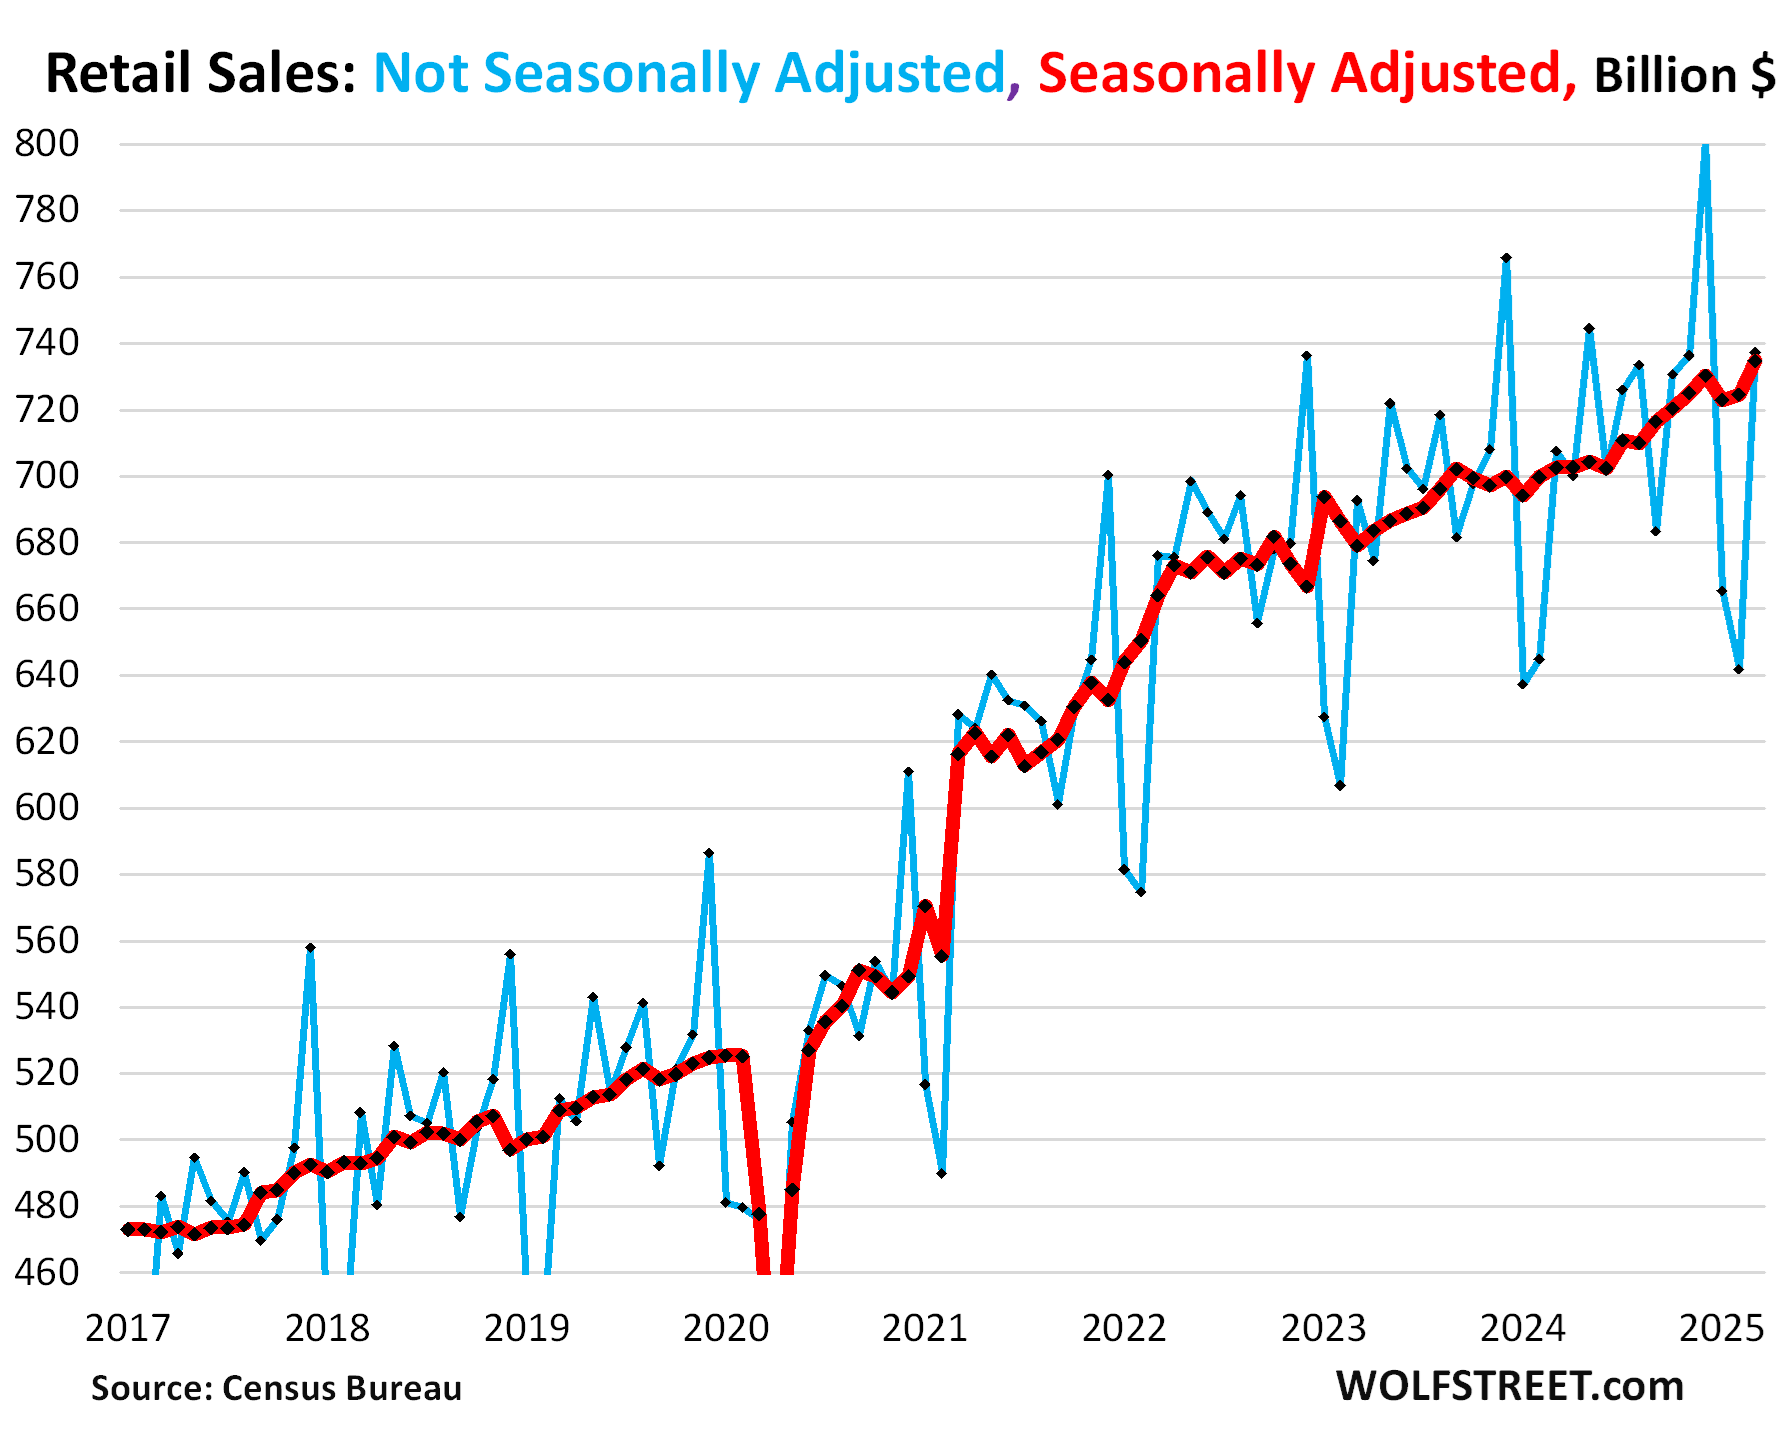
Retail sales jumped by 1.4% seasonally adjusted in March from upwardly revised February sales, and January was upwardly revised as well, to a record $735 billion, up by 4.8% year-over-year (red in the chart below).
Not seasonally adjusted, January and February are the worst months of the year in retail sales. December is by far the best month of the year (blue in the chart below). Massive seasonal adjustments attempt to iron this out by slashing December sales and by raising January and February sales. But if these huge seasonal adjustments go awry even a little, the seasonally adjusted results can trigger recession calls, then March comes along with almost no seasonal adjustments, and everything is fine again. This is a drama that gets rerun in Q1 in many years.
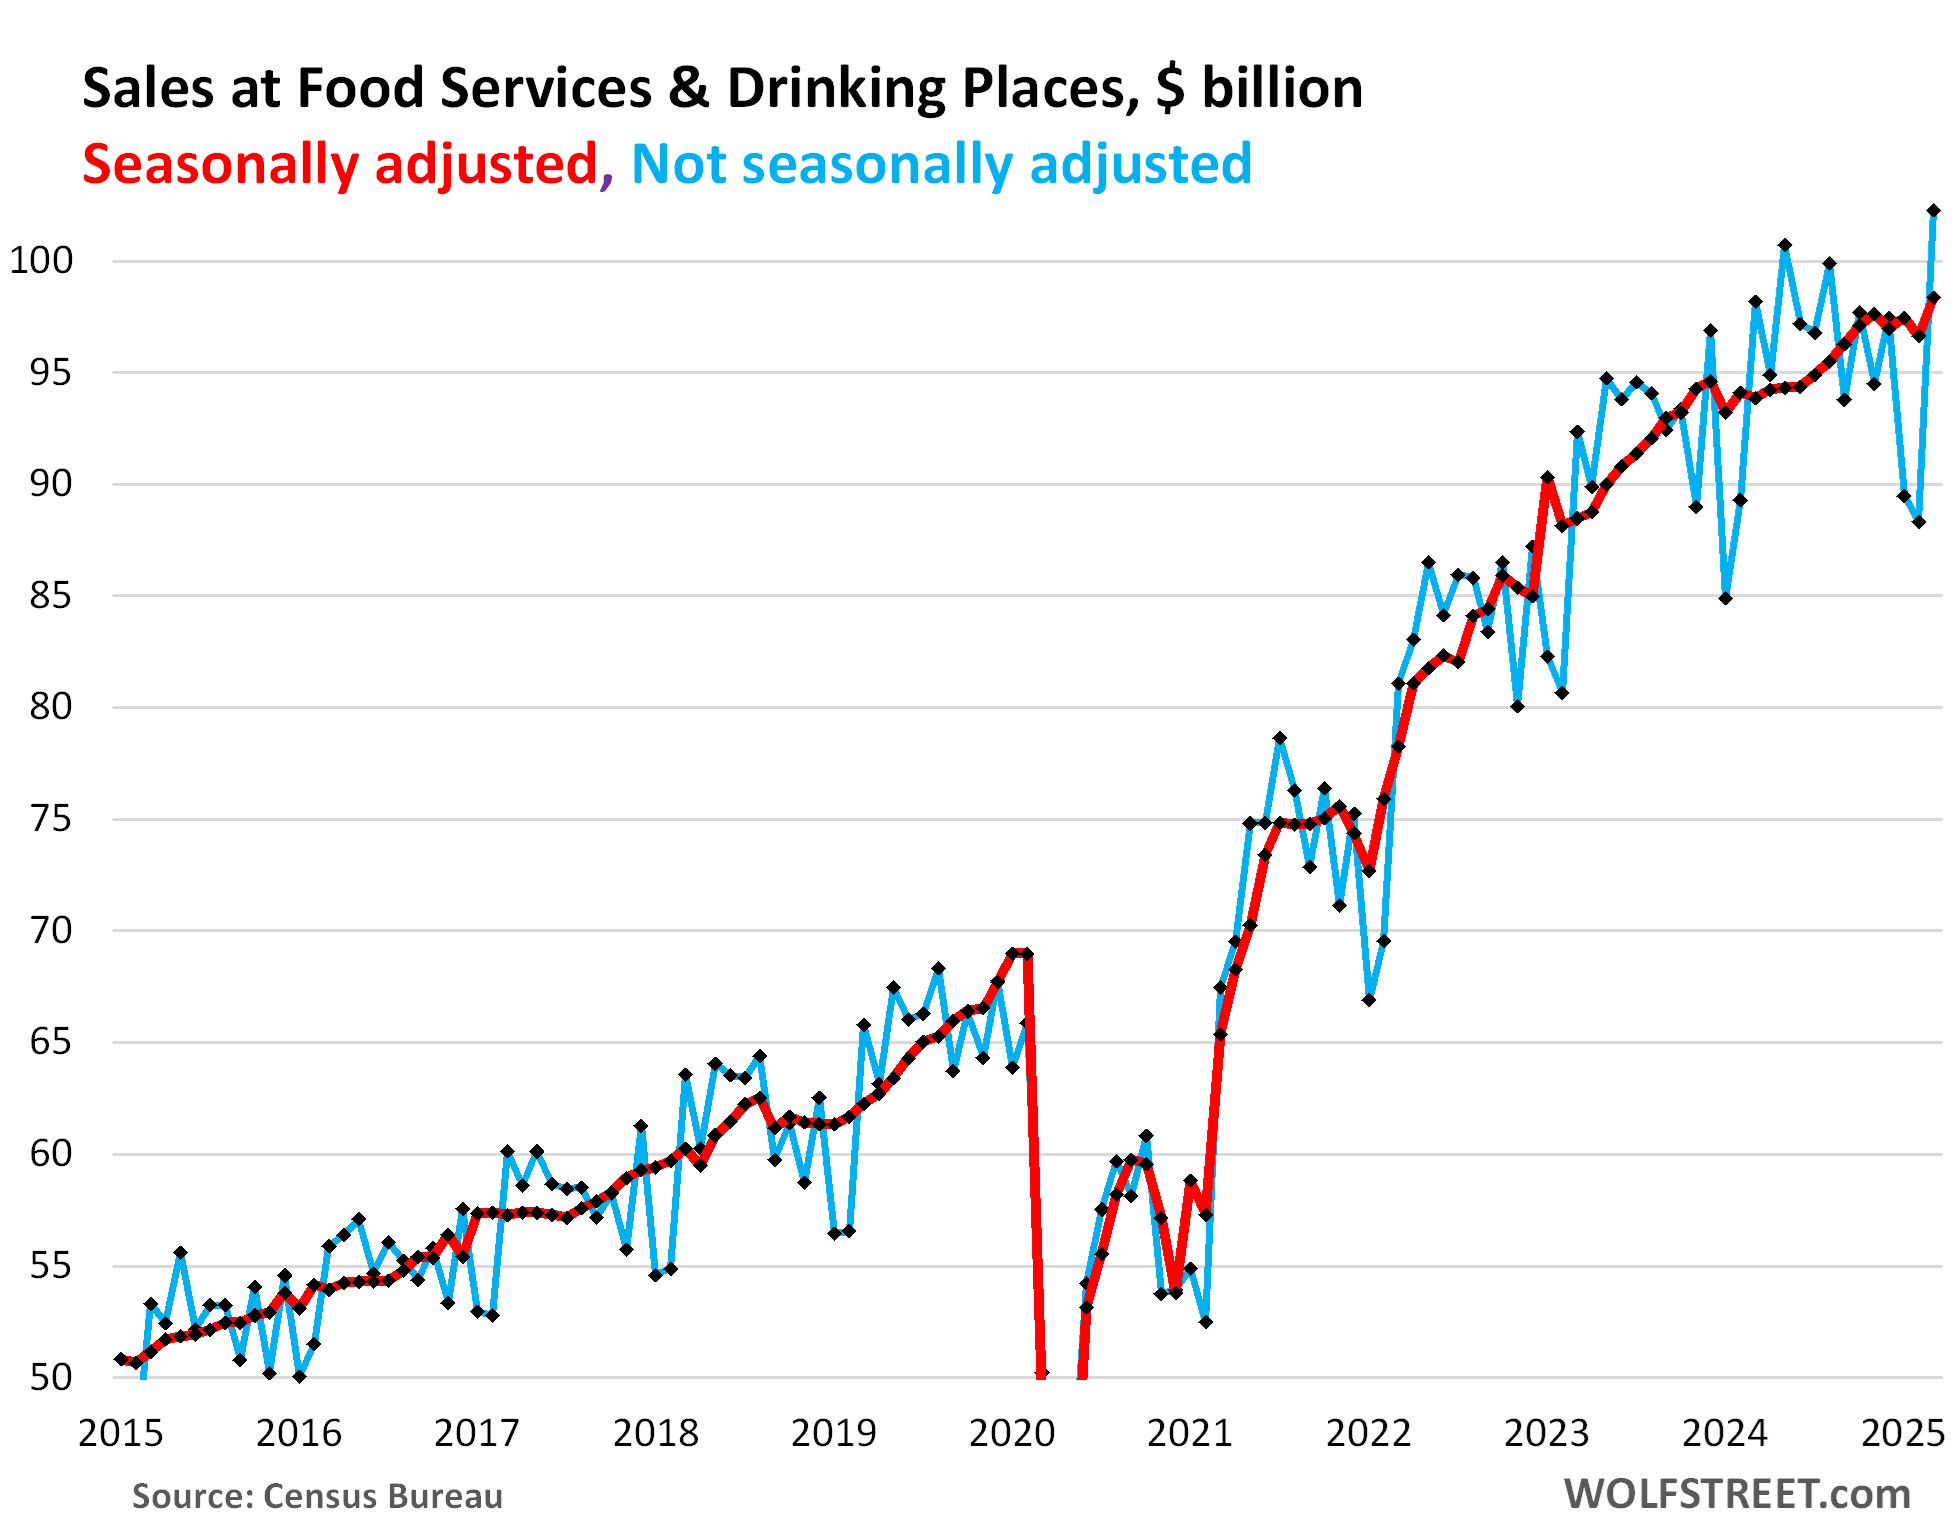
Non-frontrunning splurge: Sales at restaurants and bars. Food services and drinking places include everything from cafeterias to restaurants and bars. It’s the third largest category of retailers behind auto & parts dealers and nonstore retailers (mostly ecommerce). It accounts for 13% of total retail sales.
Most of this is discretionary spending, money that consumers want to spend, but don’t have to spend. And it’s unrelated to tariffs and any efforts to frontrun the tariffs.
Not seasonally adjusted, sales at these establishments spiked by 15.8% in March from February, to a record $102 billion.
Seasonally adjusted, they jumped by 1.8% for the month to $98 billion, and were up 4.8% year-over-year.
Our Drunken Sailors, as we’ve come to call them facetiously and lovingly, are back on track. Maybe widespread bad weather kept them at home in January and February, but they splurged when the sun came out in March. And it had nothing to do with frontrunning tariffs:
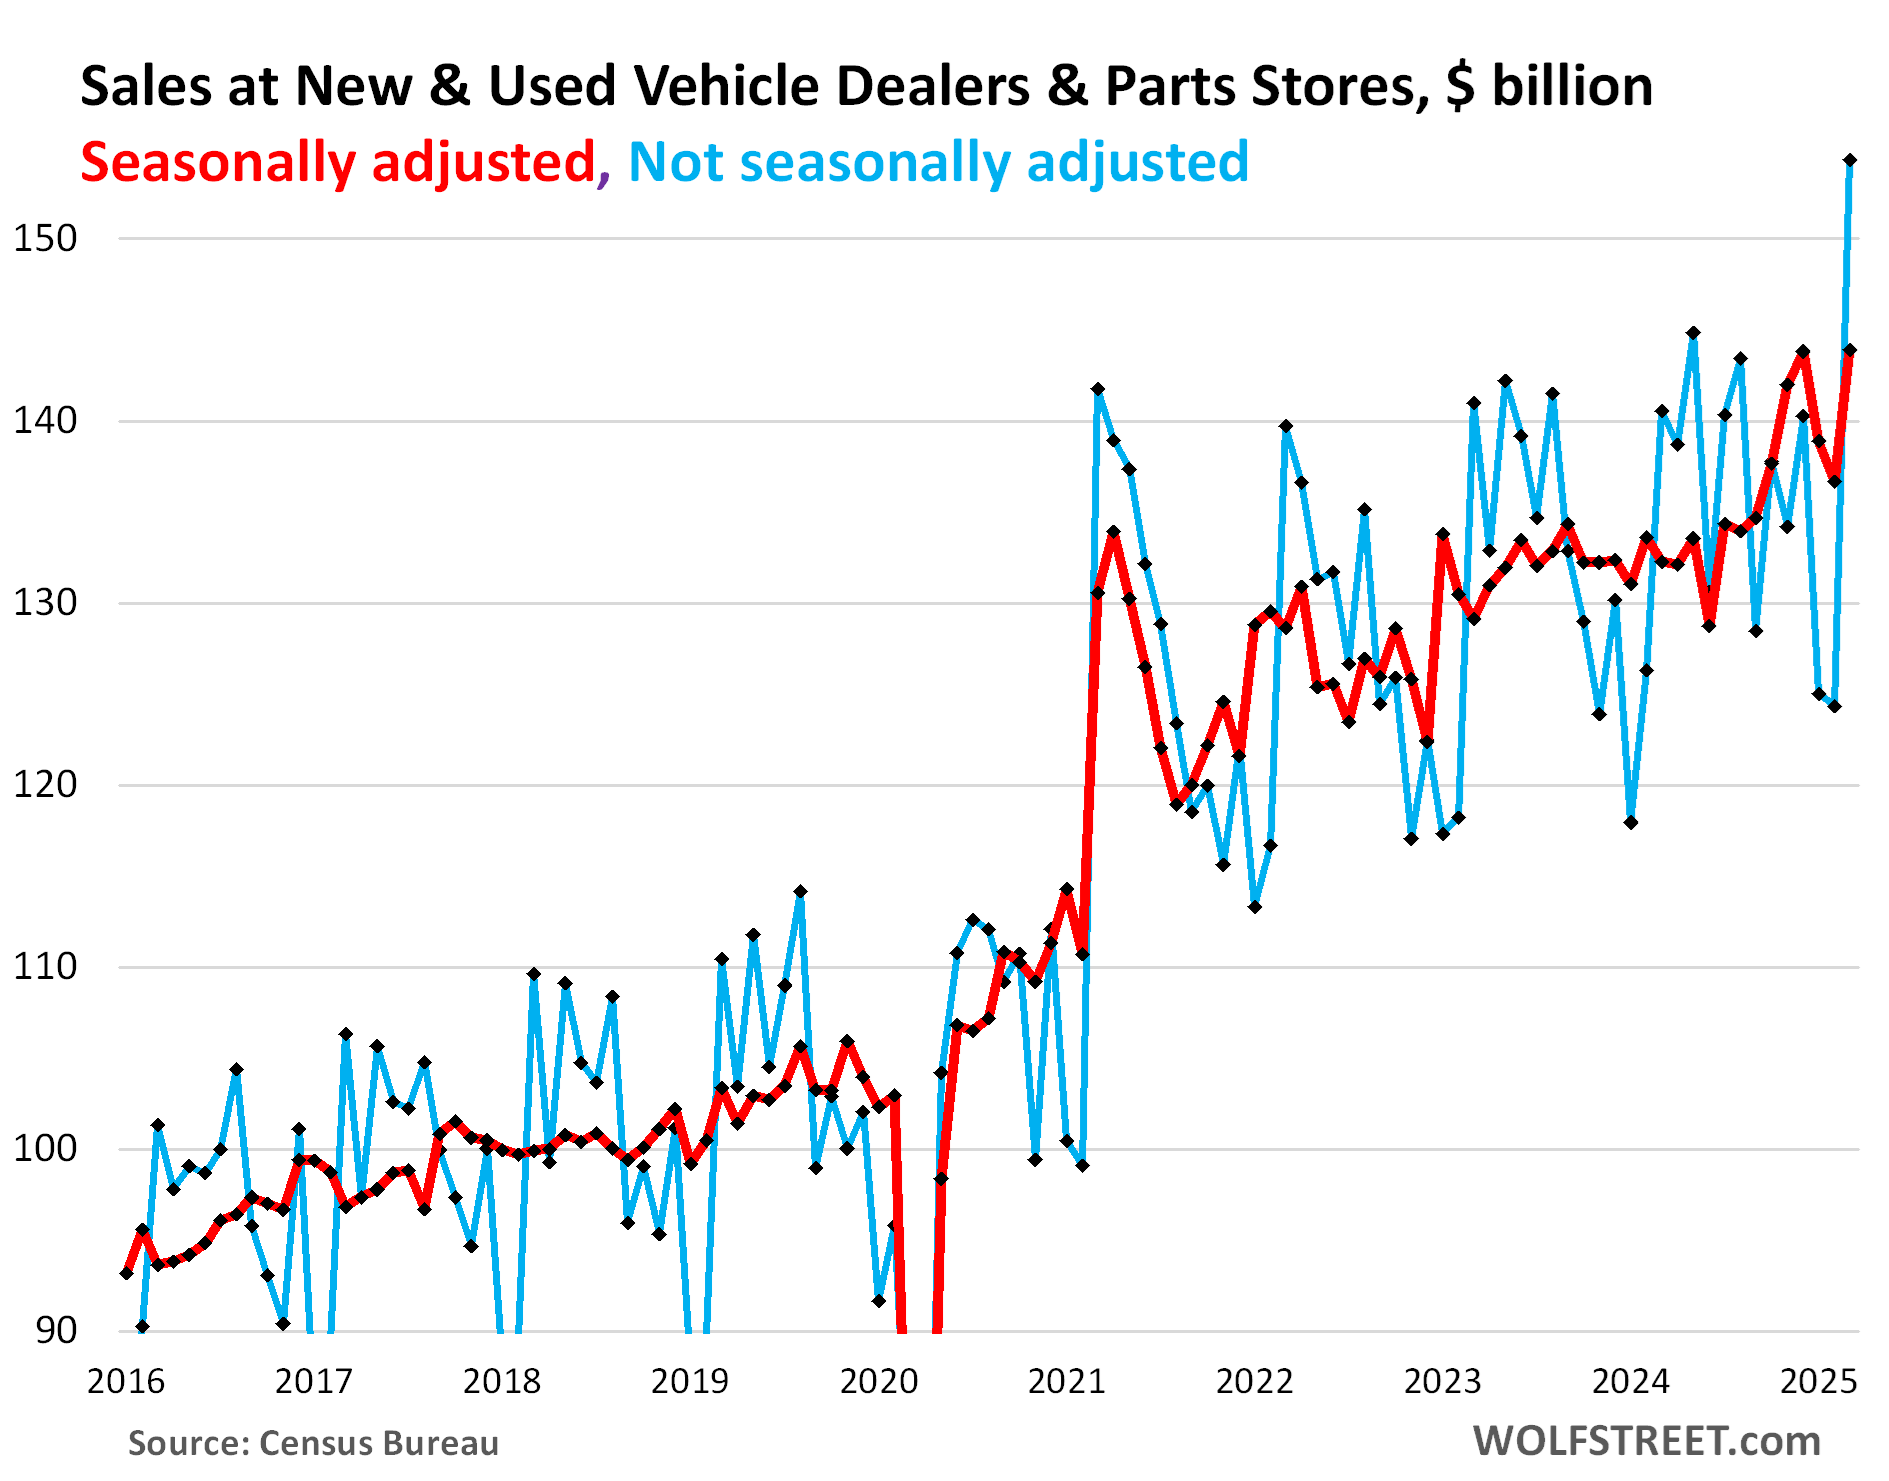
Tax-refunds & frontrunning surge: New and used vehicle dealers and parts stores, the largest retailer category with 19% of total retail sales, had a big month.
Not seasonally adjusted, sales spiked by 24% in March from February, to a record $154 billion. March is often the best month of the year; February and January are by far the worst months of the year. Year-over-year, sales spiked by 9.8% (blue in the chart below).
Seasonally adjusted, sales surged by 5.3% in March from February and by 8.8% year-over-year. Seasonal adjustments also adjust for the difference in “selling days” (red).
We knew this surge would be happening: New-vehicle sales, in terms of the number of vehicles sold, had shown decent growth in January and February and had spiked 13% year-over-year in March for the best Q1 since 2019. And sales of used vehicles also spiked 13% year-over-year in March, after solid growth in January and February.
As I pointed out, this was driven by several factors, among them:
- Big “tax-refund season”: Surging tax refunds ($208 billion through March), well ahead of a year ago, like stimulus checks for downpayments;
- Tariff-fears frontrunning;
- Urge to buy a nicer set of wheels – very ingrained in our Drunken Sailors.
And the sun came out, and they bought.
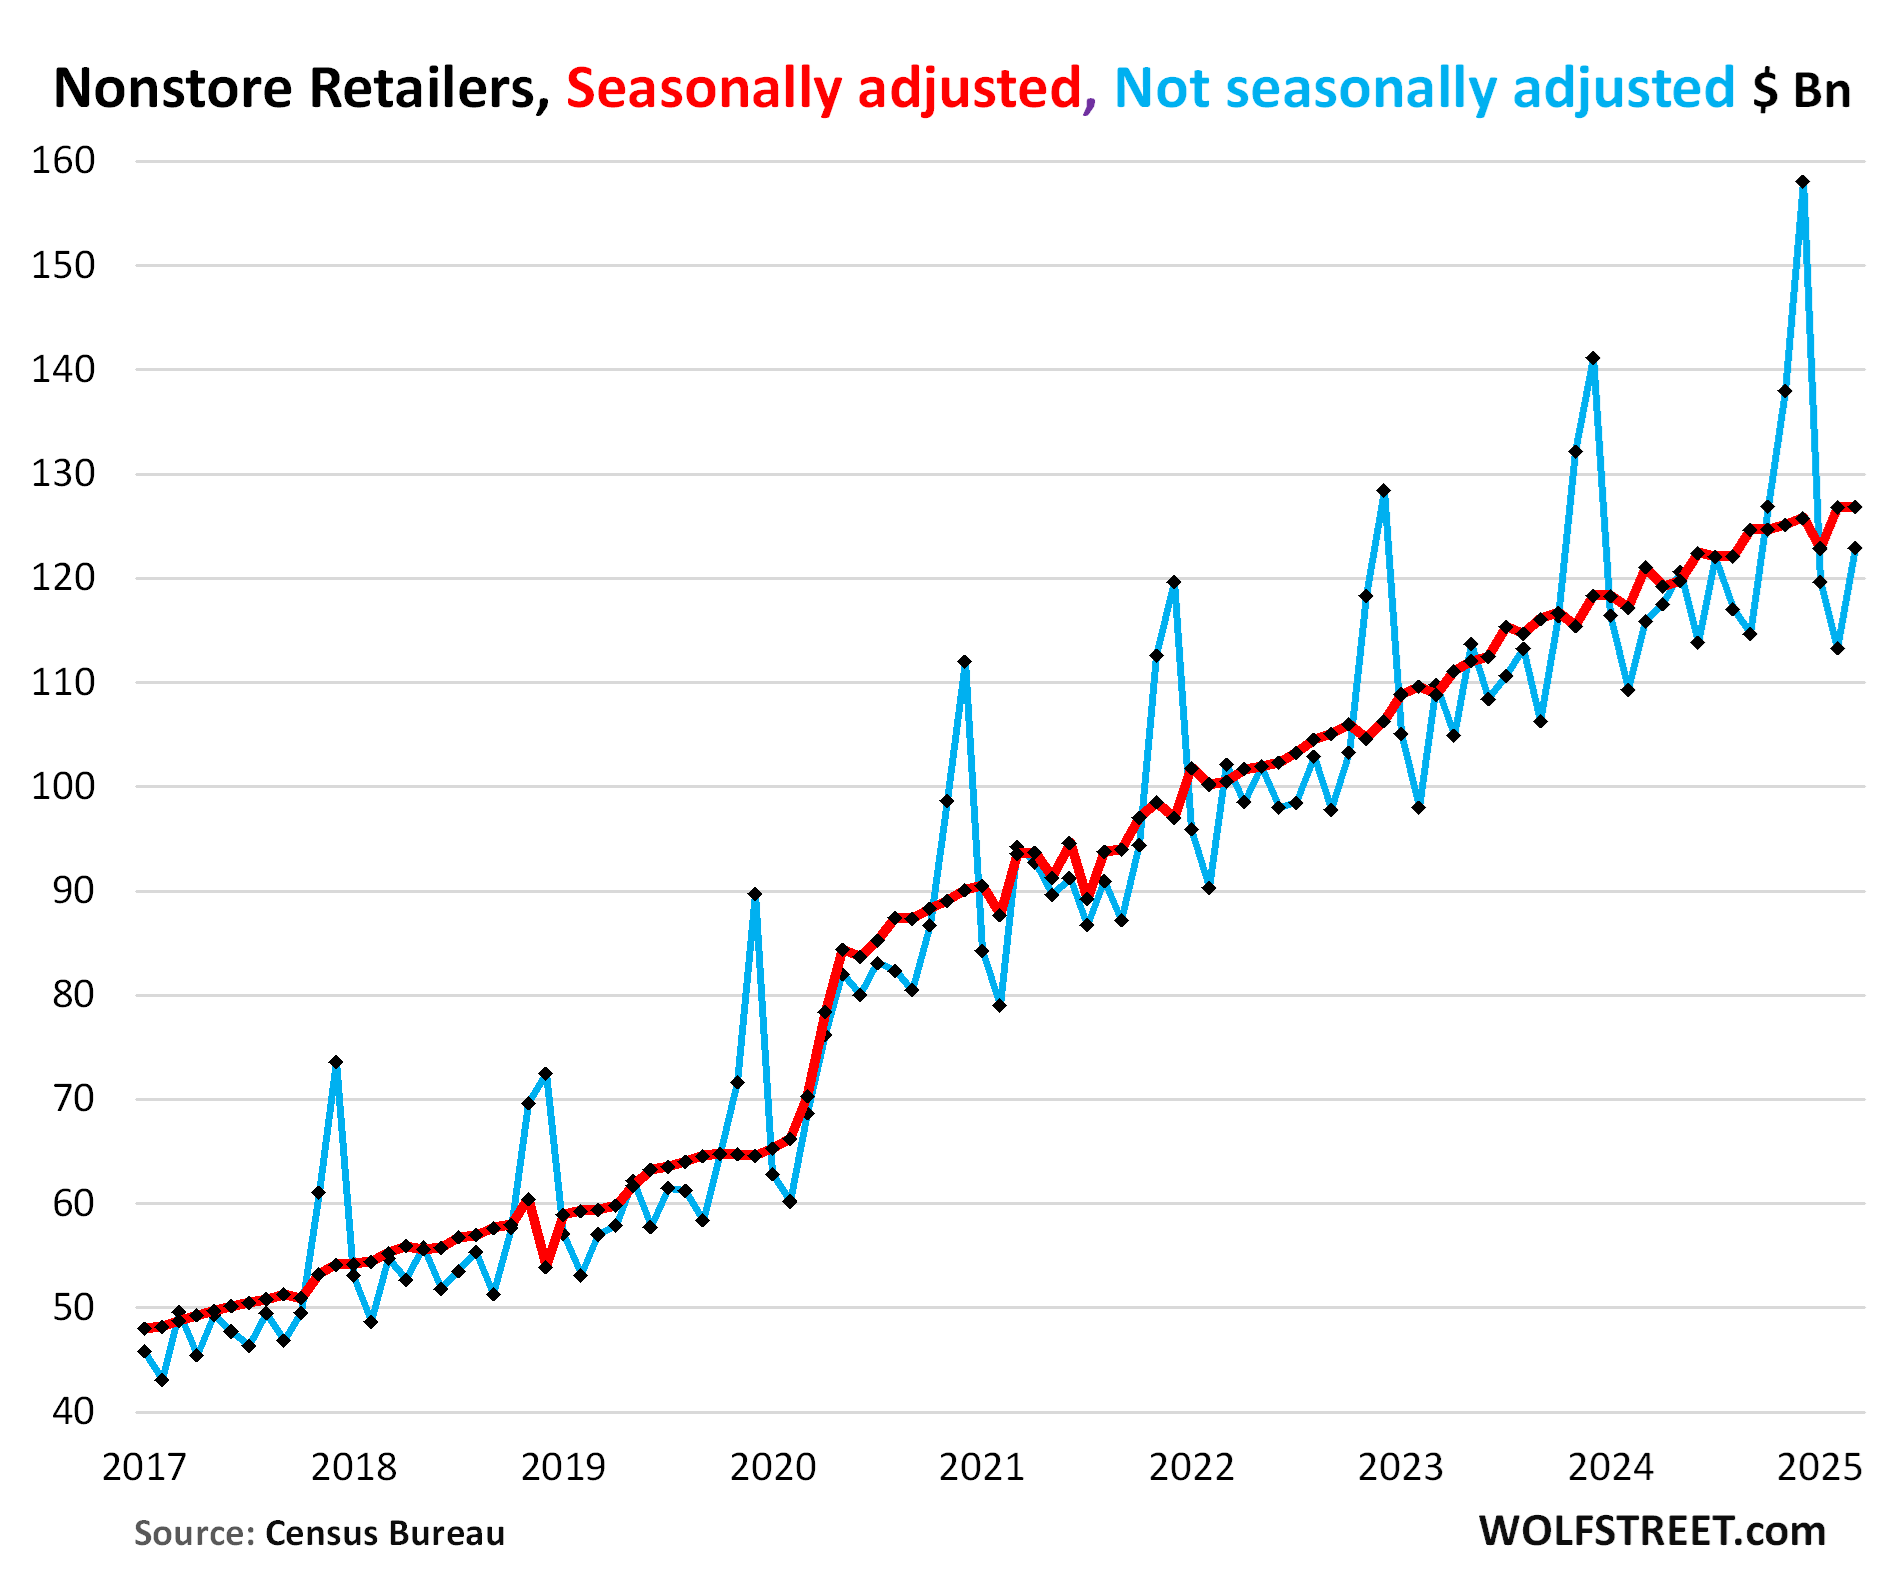
Ecommerce and other “nonstore retailers” (ecommerce retailers, ecommerce operations of brick-and-mortar retailers, and stalls and markets, #2 category), only saw modest growth.
Not seasonally adjusted, sales rose by 8.5% in March from February, and by 6.1% year-over-year, to $123 billion.
Seasonally adjusted, sales inched up 0.1% in March, and rose by 4.8% year-over-year, to $127 billion.
What, no tariff frontrunning, suddenly? Ecommerce is where tariff-frontrunning should have also taken place, but apparently it didn’t. This slow growth (for ecommerce) and the splurge at restaurants, which has nothing to do with tariffs, sprinkle doubt on just how much of a factor tariff-frontrunning really was. Maybe people were just in a mood to eat and drink out and buy vehicles? That’s what American consumers are known to do.
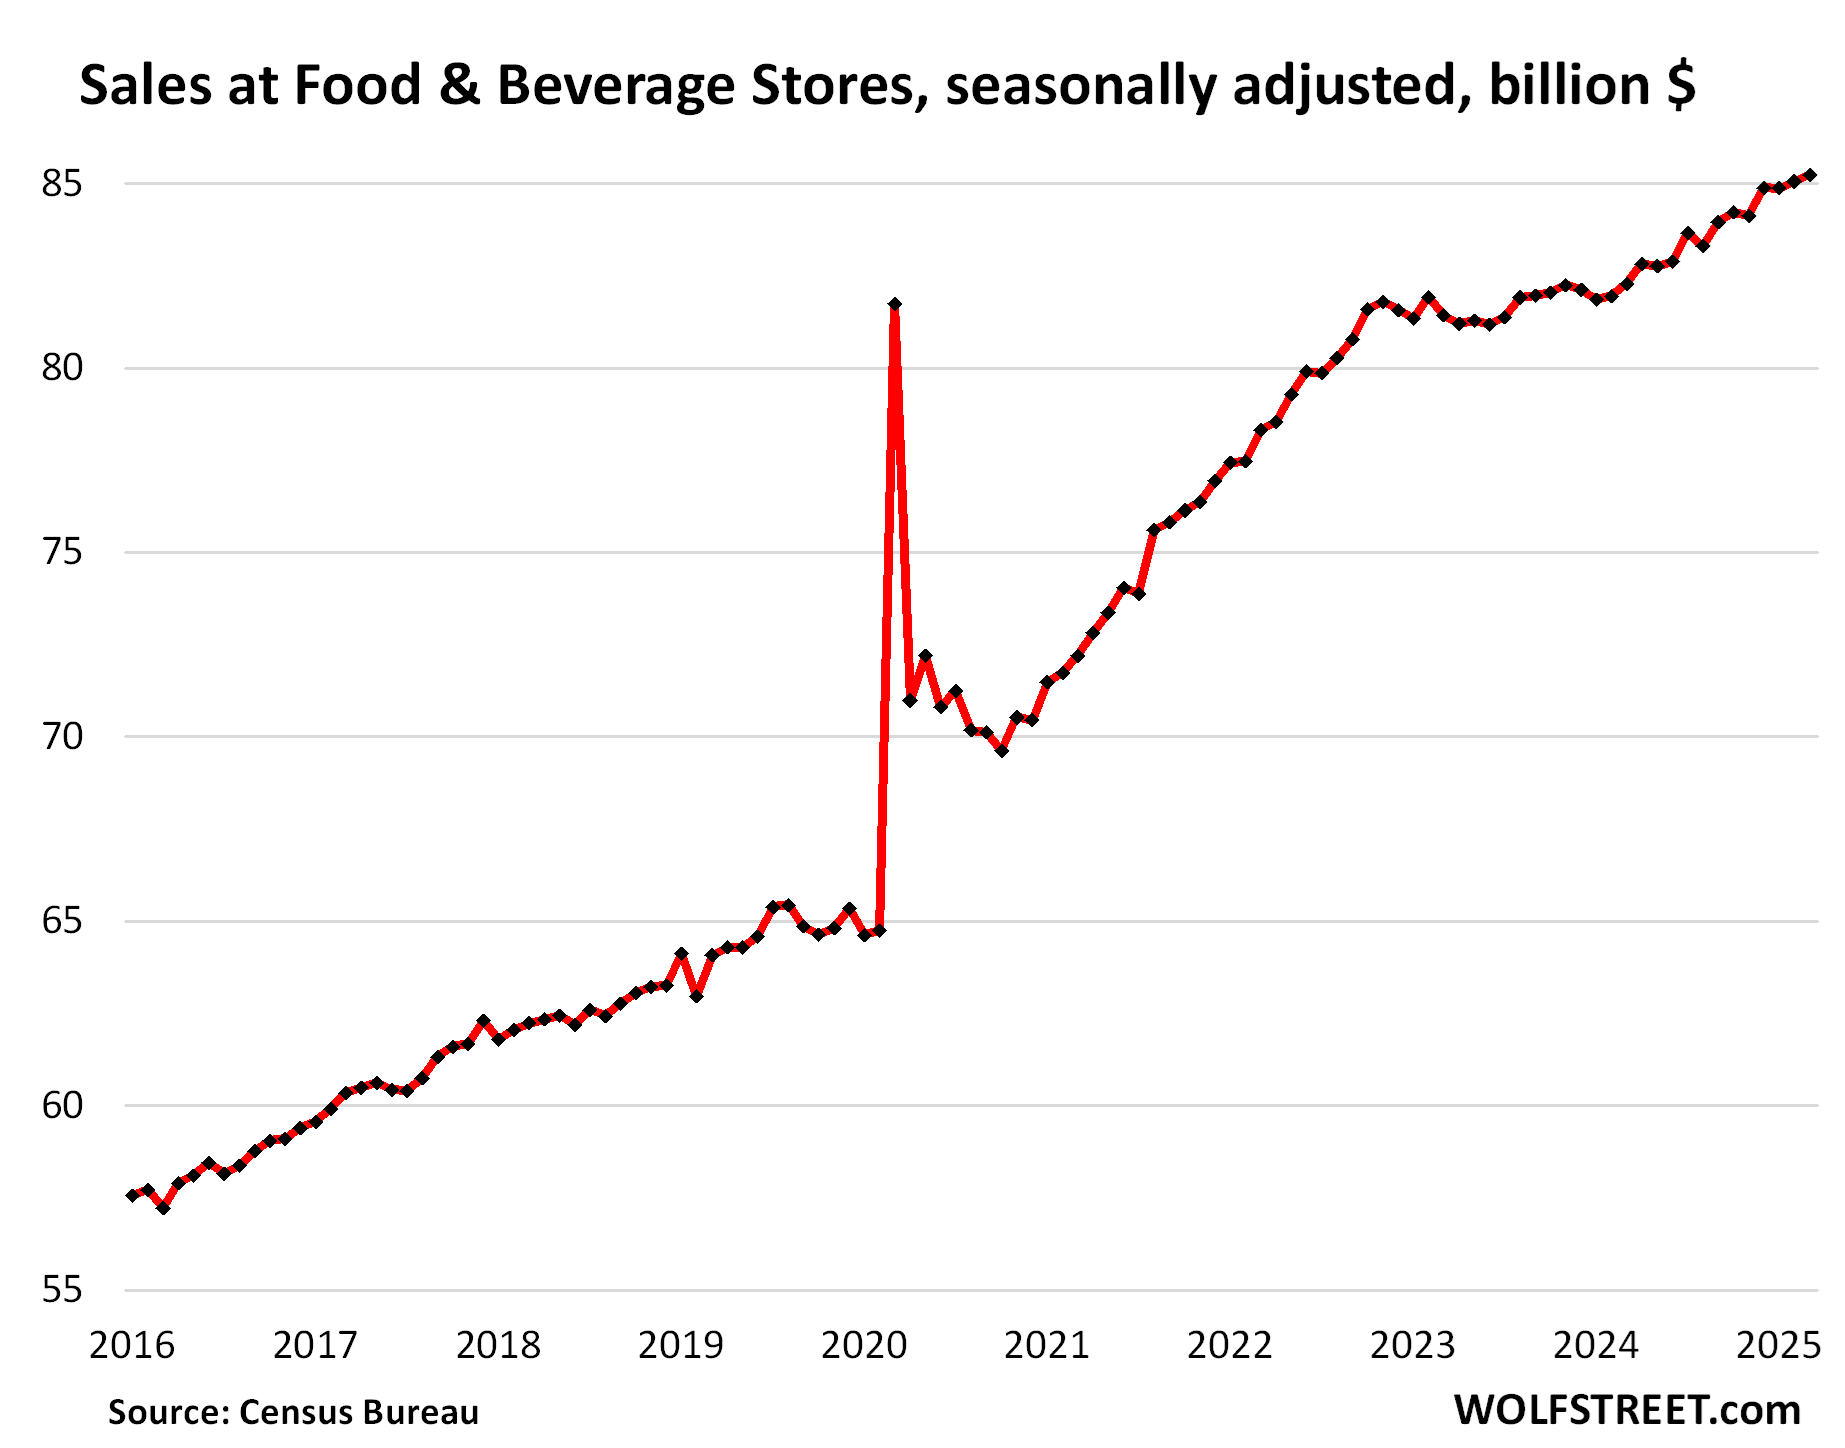
Food and Beverage Stores, #4 category of retailer, 12% of retail sales:
- Sales: $85 billion
- From prior month: +0.2%
- Year-over-year: +3.6%
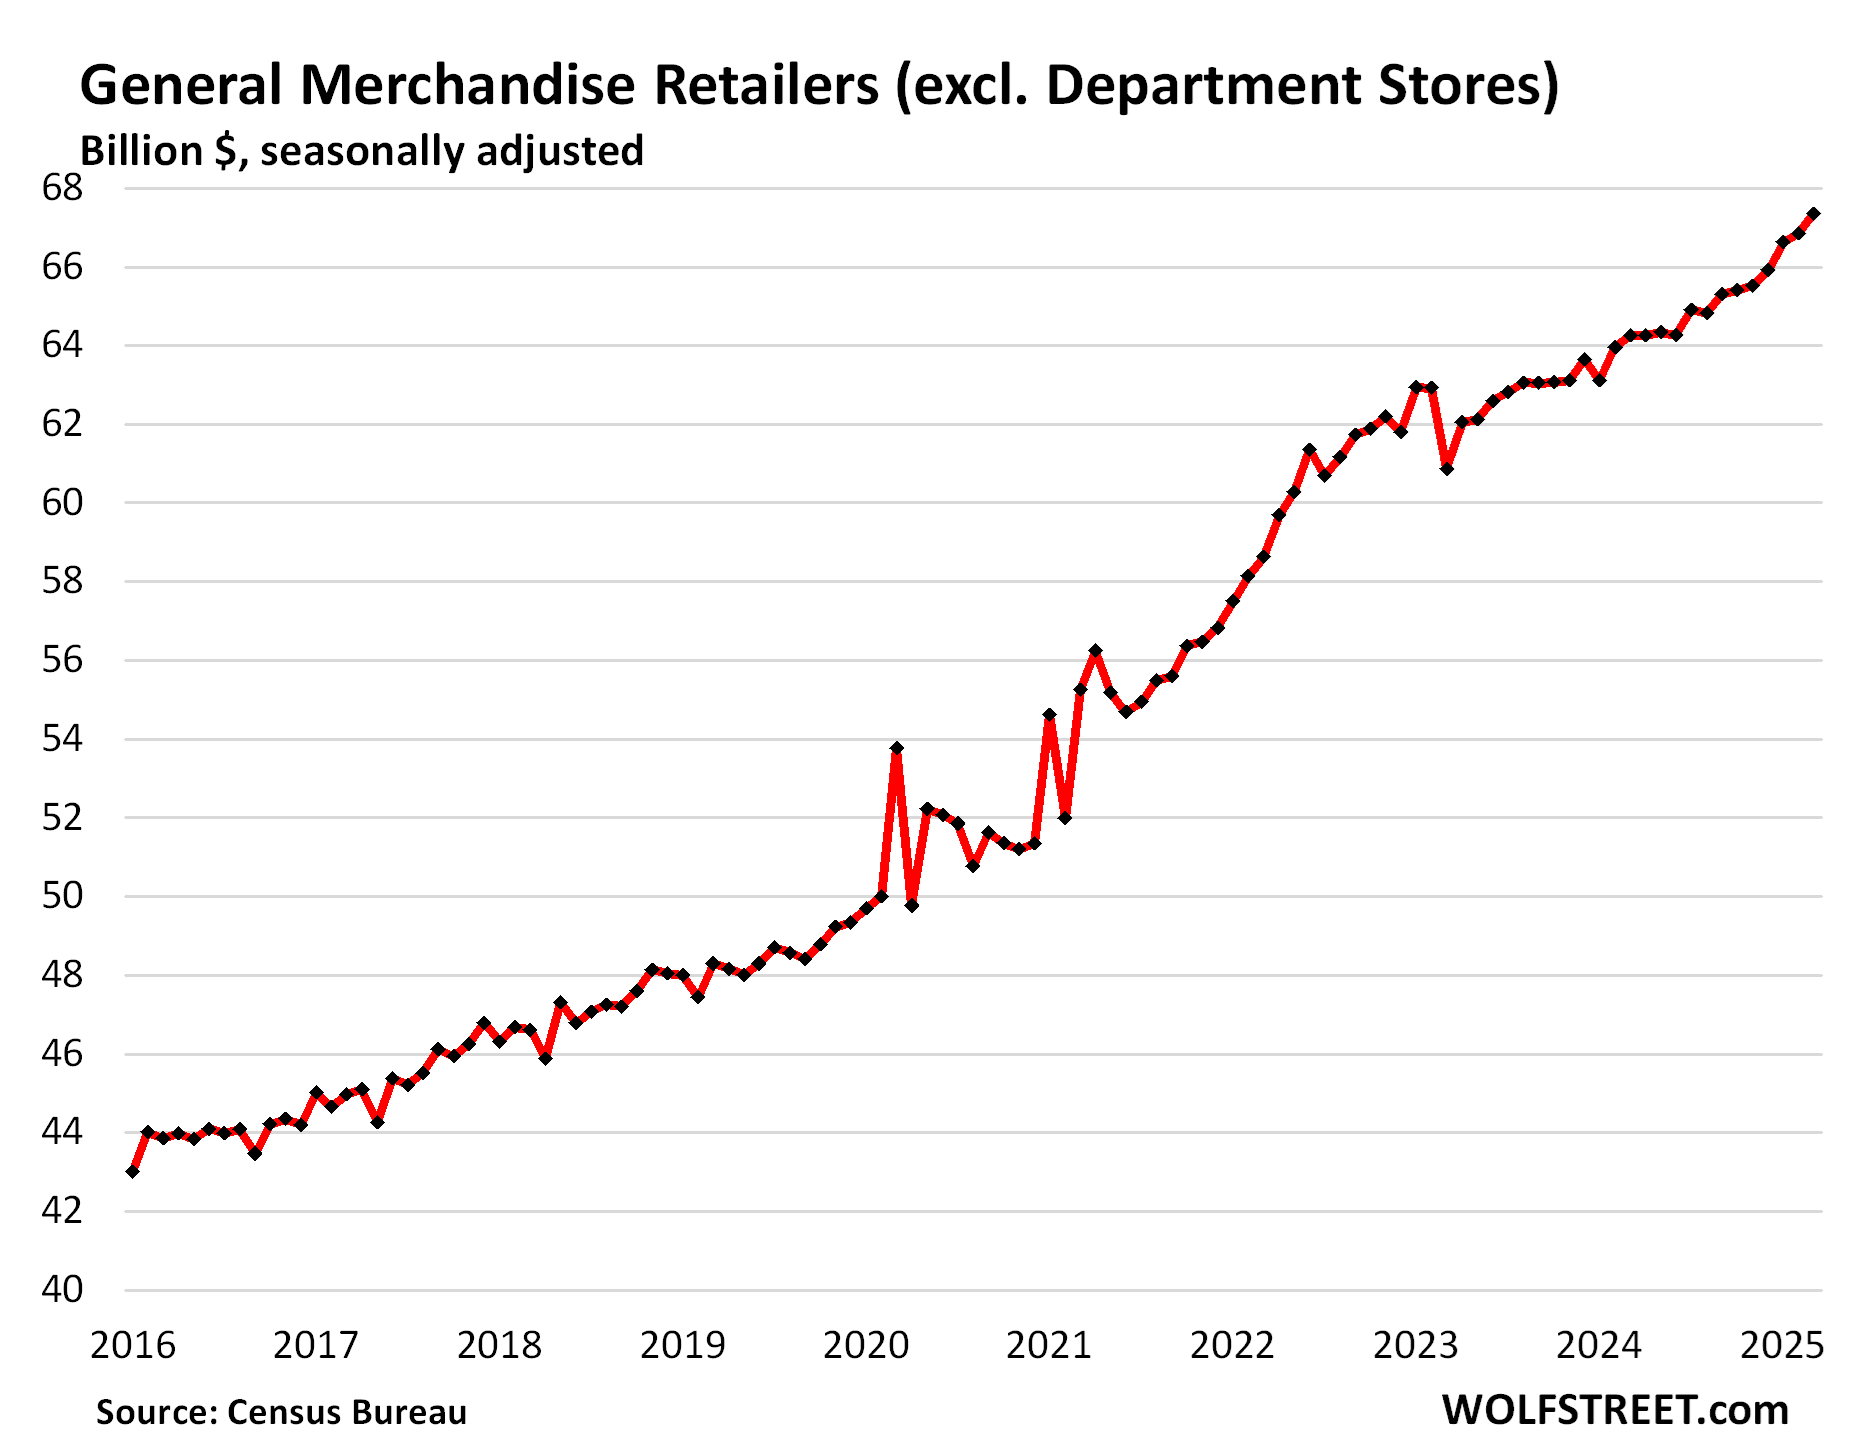
General merchandise stores, minus department stores (#5 category, 9% of retail sales), including retailers such as Walmart, which is also the largest grocer in the US.
- Sales: $67 billion
- From prior month: +0.8%
- Year-over-year: +4.8%
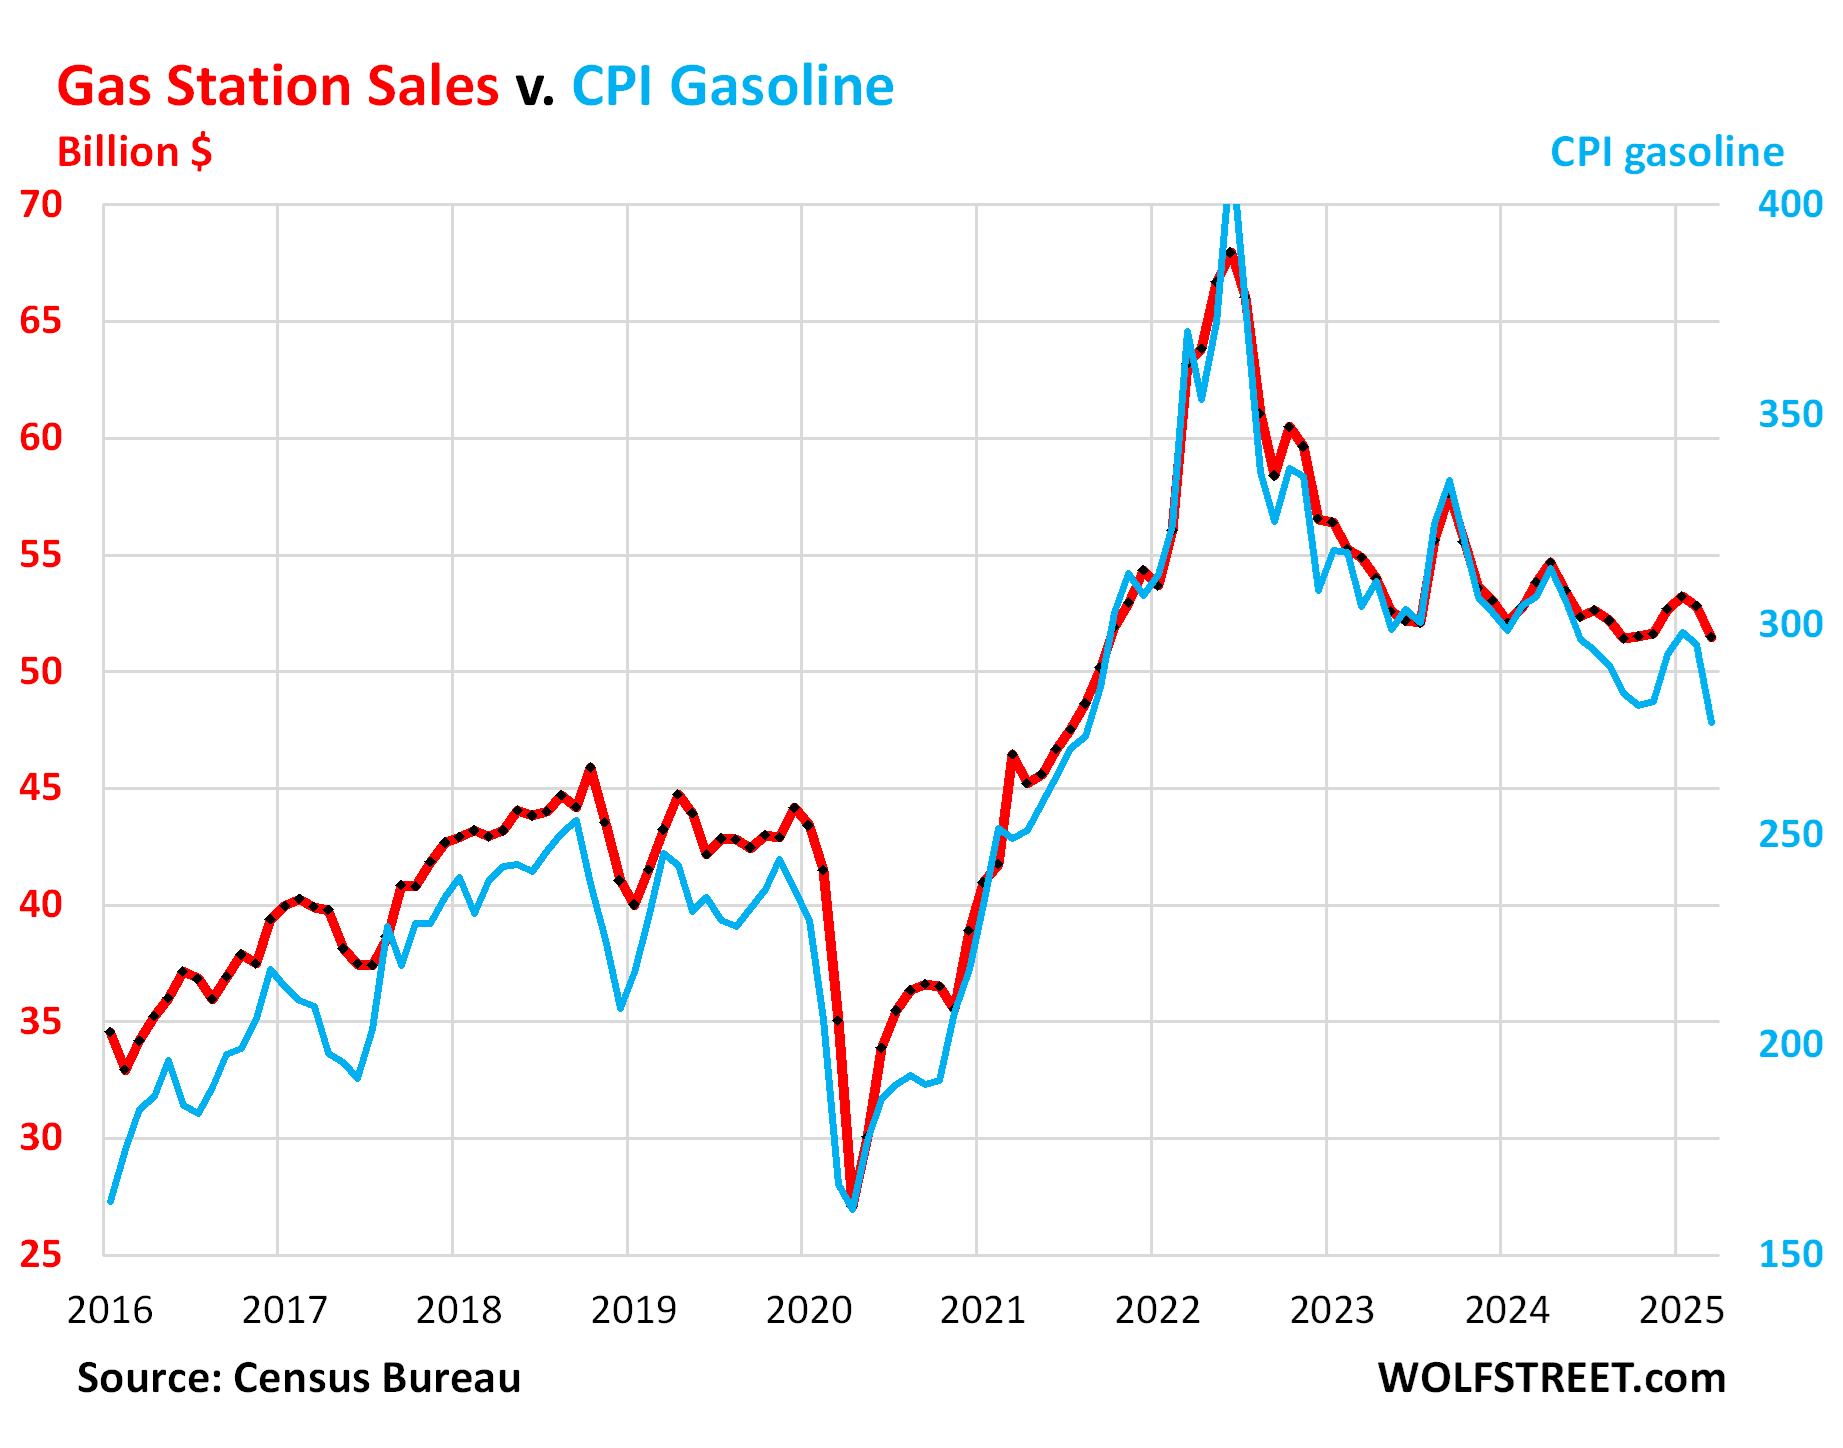
Gas stations (#6 category, 7% of retail sales). Dollar-sales at gas stations move in near-lockstep with the price of gasoline. The price of gasoline started zigzagging lower in mid-2022. These price declines pushed down dollar-sales at gas stations. Sales at gas stations also include all the other merchandise gas stations sell:
- Sales: $51 billion
- From prior month: -2.5%
- Year-over-year: -4.3%
Sales in billions of dollars at gas stations (red, left axis); and the CPI for gasoline (blue, right axis):
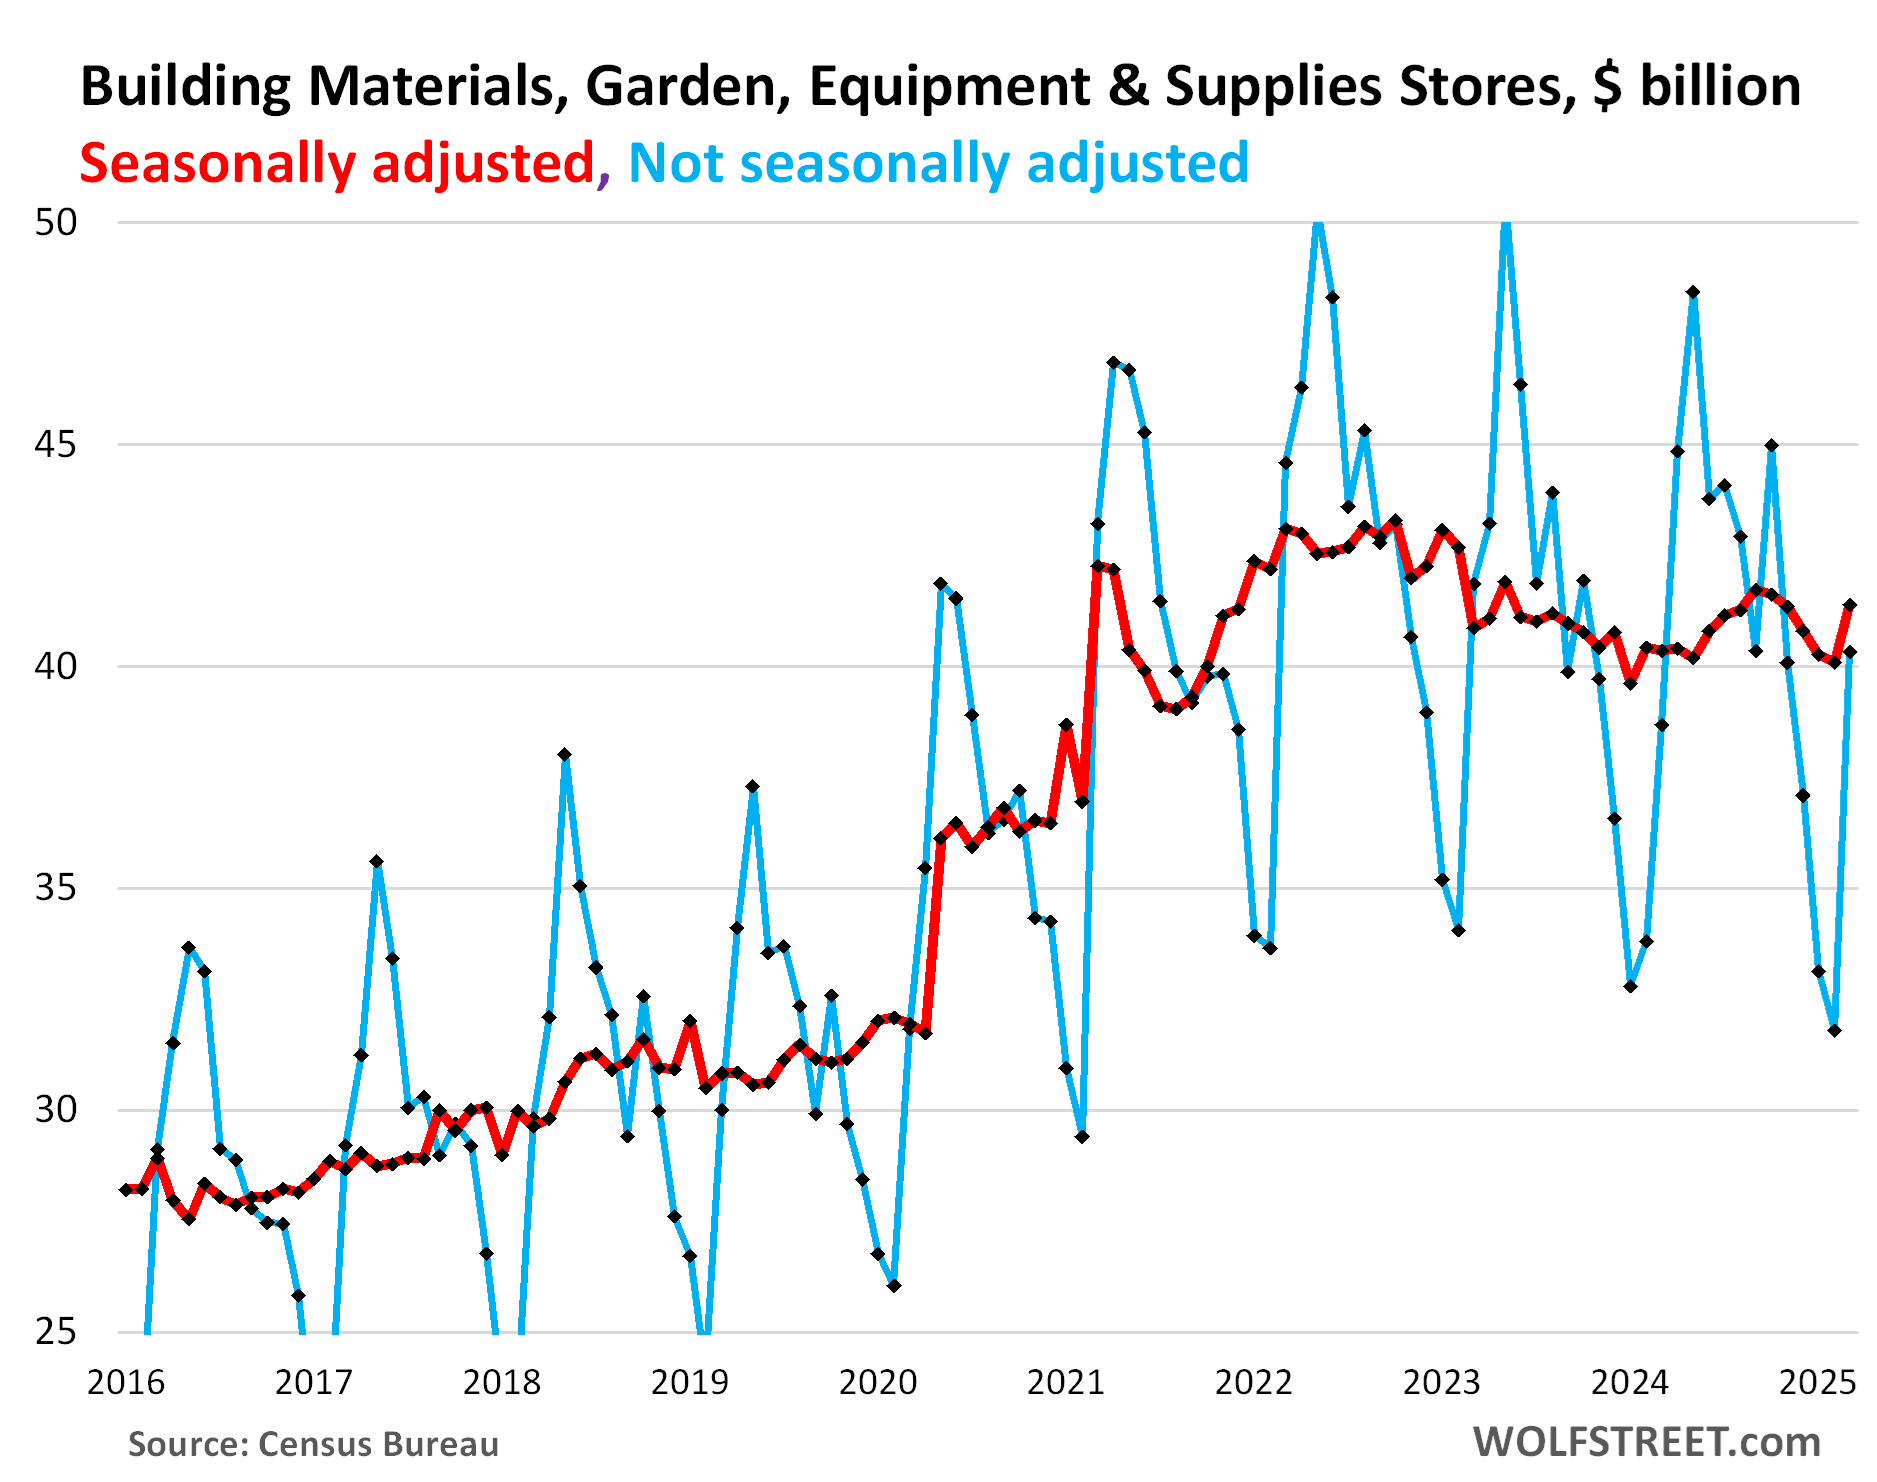
Building materials, garden supply and equipment stores (#7 category, 6% of total retail). The remodeling boom during the pandemic fizzled in late 2022, and sales fell for a while. But in March, sales spiked, even seasonally adjusted. May is usually the best month:
- Sales: $41 billion
- From prior month: +3.3%
- Year-over-year: +2.6%
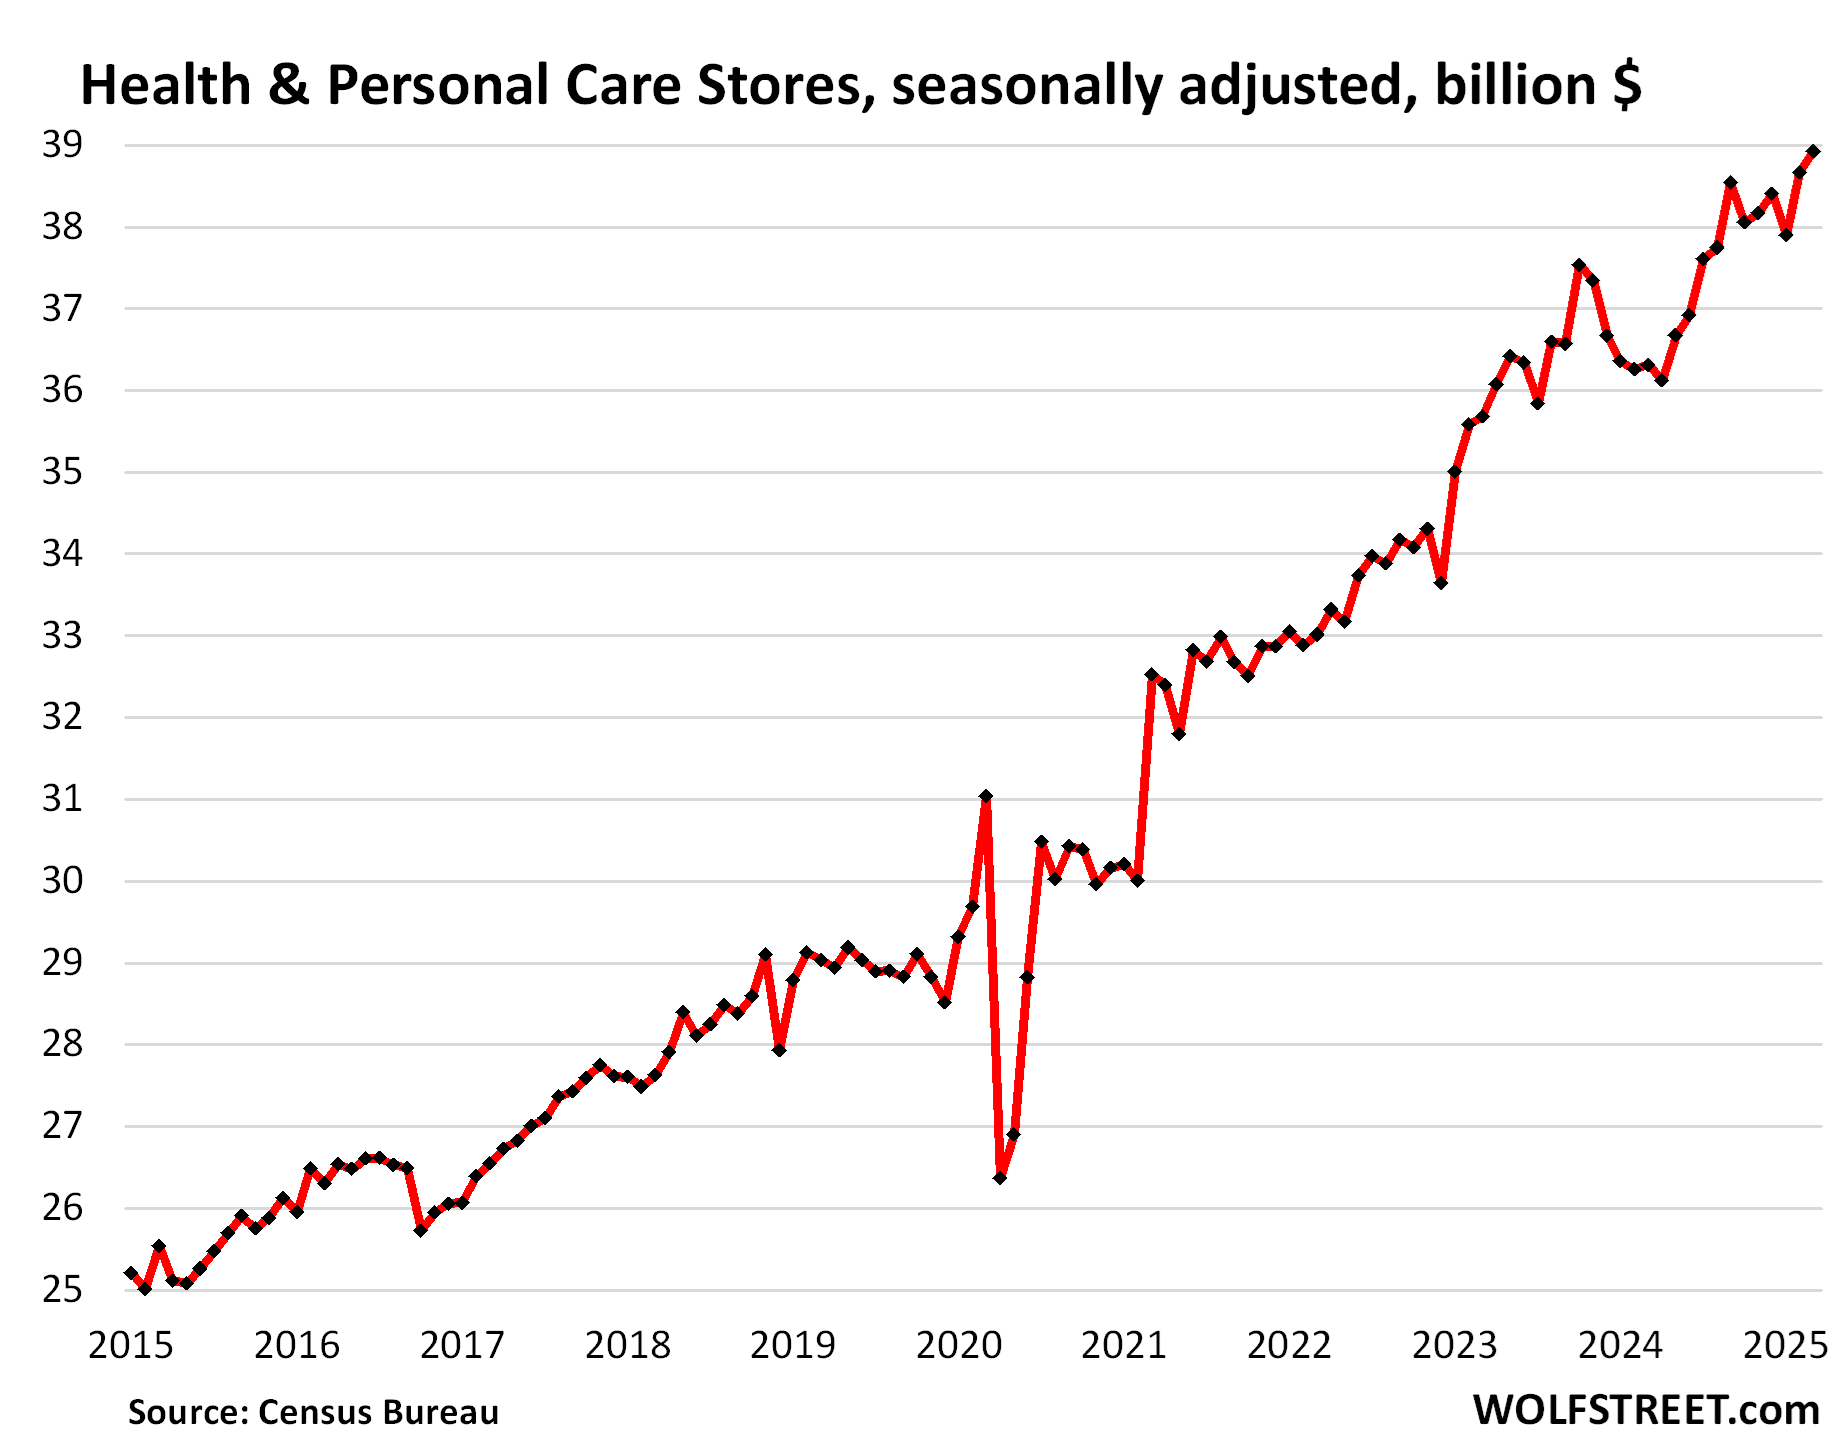
Health and personal care stores (#8 category, 5% of total retail:
- Sales: $39 billion
- From prior month: +0.7%
- Year-over-year: +7.2%
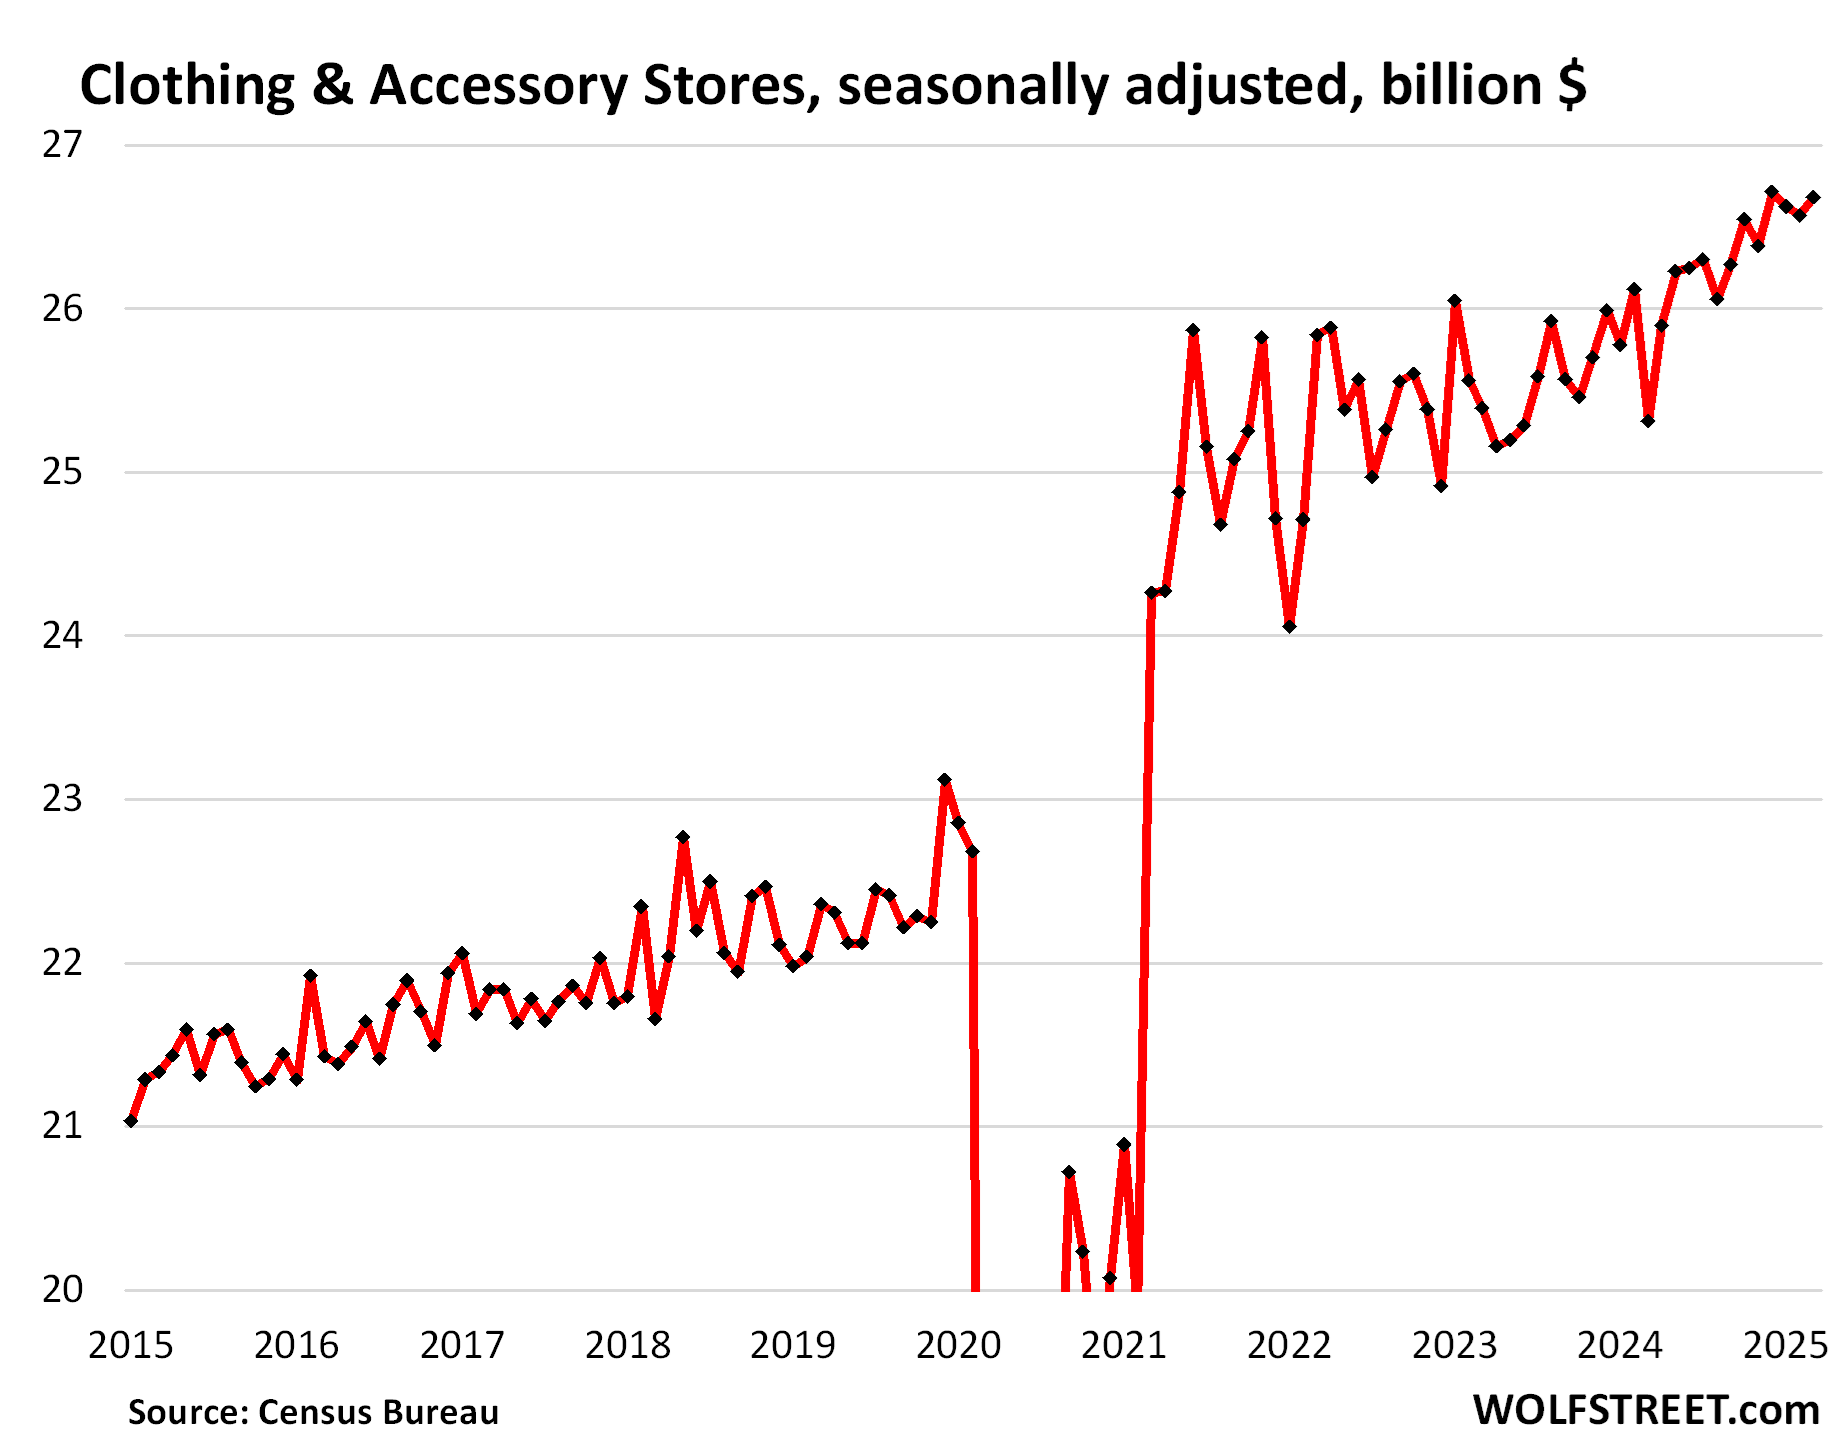
Clothing and accessory stores (#9 category, 3.7% of retail):
- Sales: $27 billion
- From prior month: +0.4%
- Year-over-year: +5.4%
Enjoy reading WOLF STREET and want to support it? You can donate. I appreciate it immensely. Click on the mug to find out how:

![]()
Energy News Beat