
January was up-revised to worst increase since August 2023, PPI inflation doubling in 12 months. February unchanged, waiting for up-revision.
By Wolf Richter for WOLF STREET.
It happened again. We’ve been discussing this issue here for many months: It’s the up-revisions of the prior months that are largely driving the PPI higher, and that was the case today too.
Today’s Producer Price Index for February once again included up-revisions of the data for the prior month, driven by a big up-revision for the services PPI that doubled the month-to-month increase, which flipped the previously reported year-over-year “cooling” in January to “continued heating” in January.
Overall PPI up-revisions: The month-to-month increase of the PPI for January was revised up by 21 basis points, to +0.61% (+7.6% annualized), the biggest increase since August 2023, from the previously reported +0.40% (+4.9% annualized).
The year-over-year increase of the PPI for January was revised up by 19 basis points, to +3.70%, the biggest increase since February 2023, from the previously reported +3.51%.
Core PPI up-revisions: The month-to-month increase of the “core” PPI for January was revised up by 23 basis points, to +0.51% (+6.3% annualized), the biggest increase since June 2024, from the previously reported +0.28% (+3.4% annualized).
The year-over-year increase of the core PPI for January was revised up by 22 basis points, to +3.83%, the biggest increase since February 2023, from the previously reported +3.61%. This up-revision to +3.83% flipped the January data point from being lower (cooling) than December (3.72%) to being higher (re-heating) than December.
Services PPI up-revisions: The month-to-month increase of the services PPI for January was revised up by 29 basis points, nearly doubling it, to +0.61% (+7.6% annualized), the biggest increase since June 2024, from the previously reported +0.32% (+3.9% annualized).
Services account for 67.5% of the overall PPI. It’s these big up-revisions in services that trigger the up-revisions in the core PPI and the overall PPI.
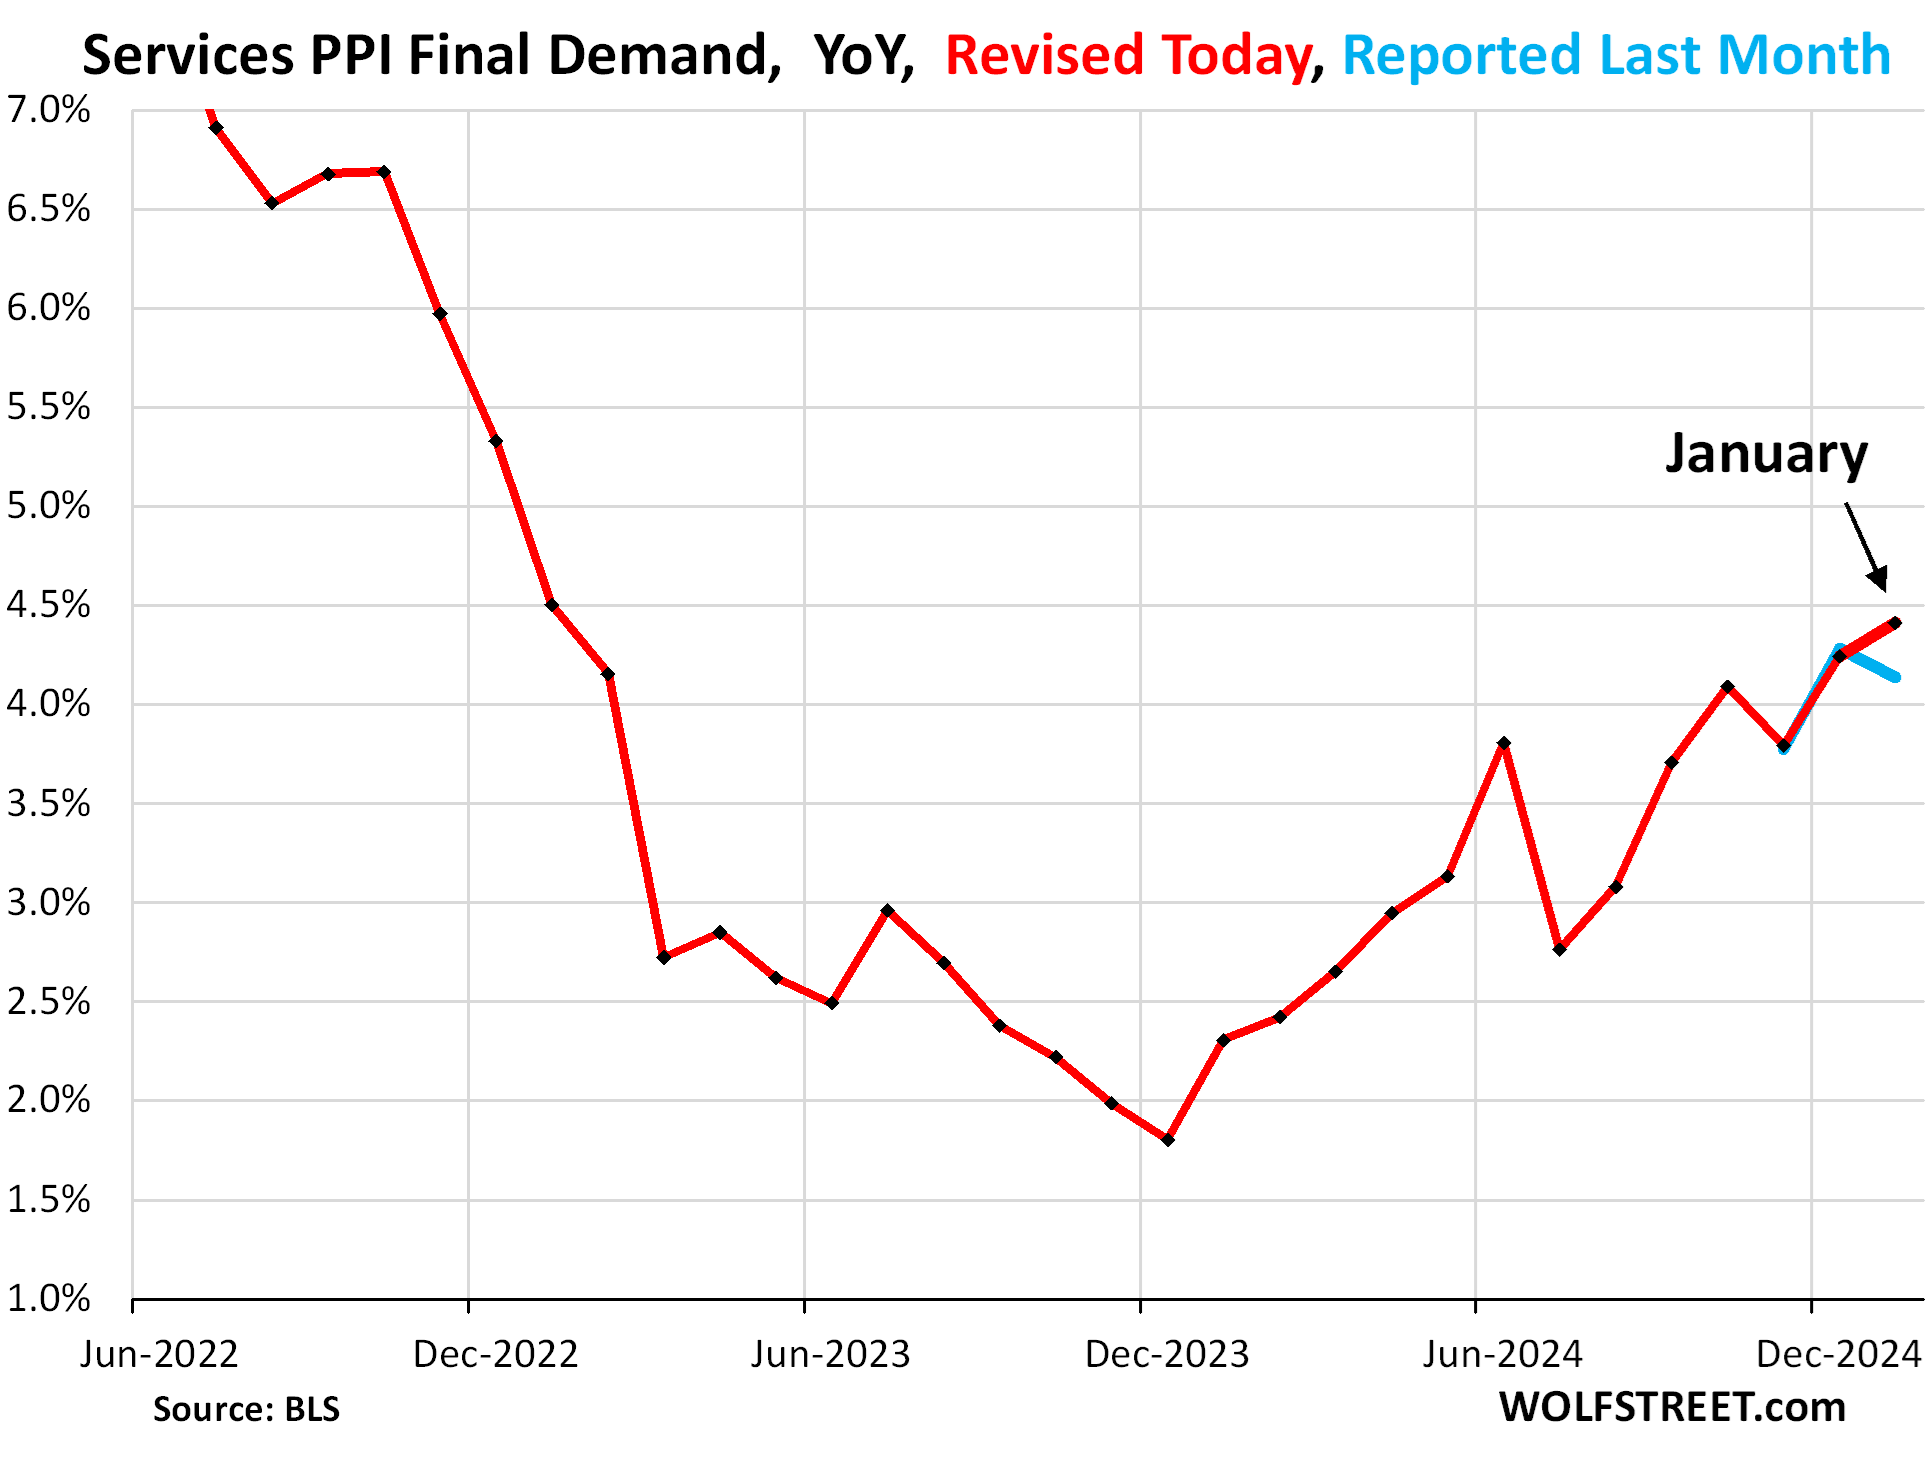
The year-over-year increase of the services PPI for January was revised up by 27 basis points, to +4.41%, the worst increase in two years, from the previously reported +4.14%. This up-revision to +4.41% flipped the January data point from being lower than December (+4.24%) to being higher than December.
To illustrate the impact of the revisions, here is the chart of the year-over-year services PPI through January with the revised data as reported today (red) and originally reported data (blue). January flipped from cooling (blue) to heating (red). Since these types of up-revisions have been happing nearly every month since PPI inflation began reheating last summer, we see a good chance that today’s February data (more in a moment) will be up-revised too.
These up-revisions are a substantial part of what drives the PPI higher, but they don’t show up in the headlines reporting on the month-to-month data.
The PPI for February.
The overall PPI for February (to be upwardly revised next month?) was essentially unchanged from the upwardly revised January, which had been the biggest increase since August 2023.
This unchanged February caused the year-over-year increase to decelerate to +3.2% from the upwardly revised increase in January of 3.7%.
So far, powered by the up-revisions, it’s a trend of zig-zagging higher from the low point of near 0% in June 2023.
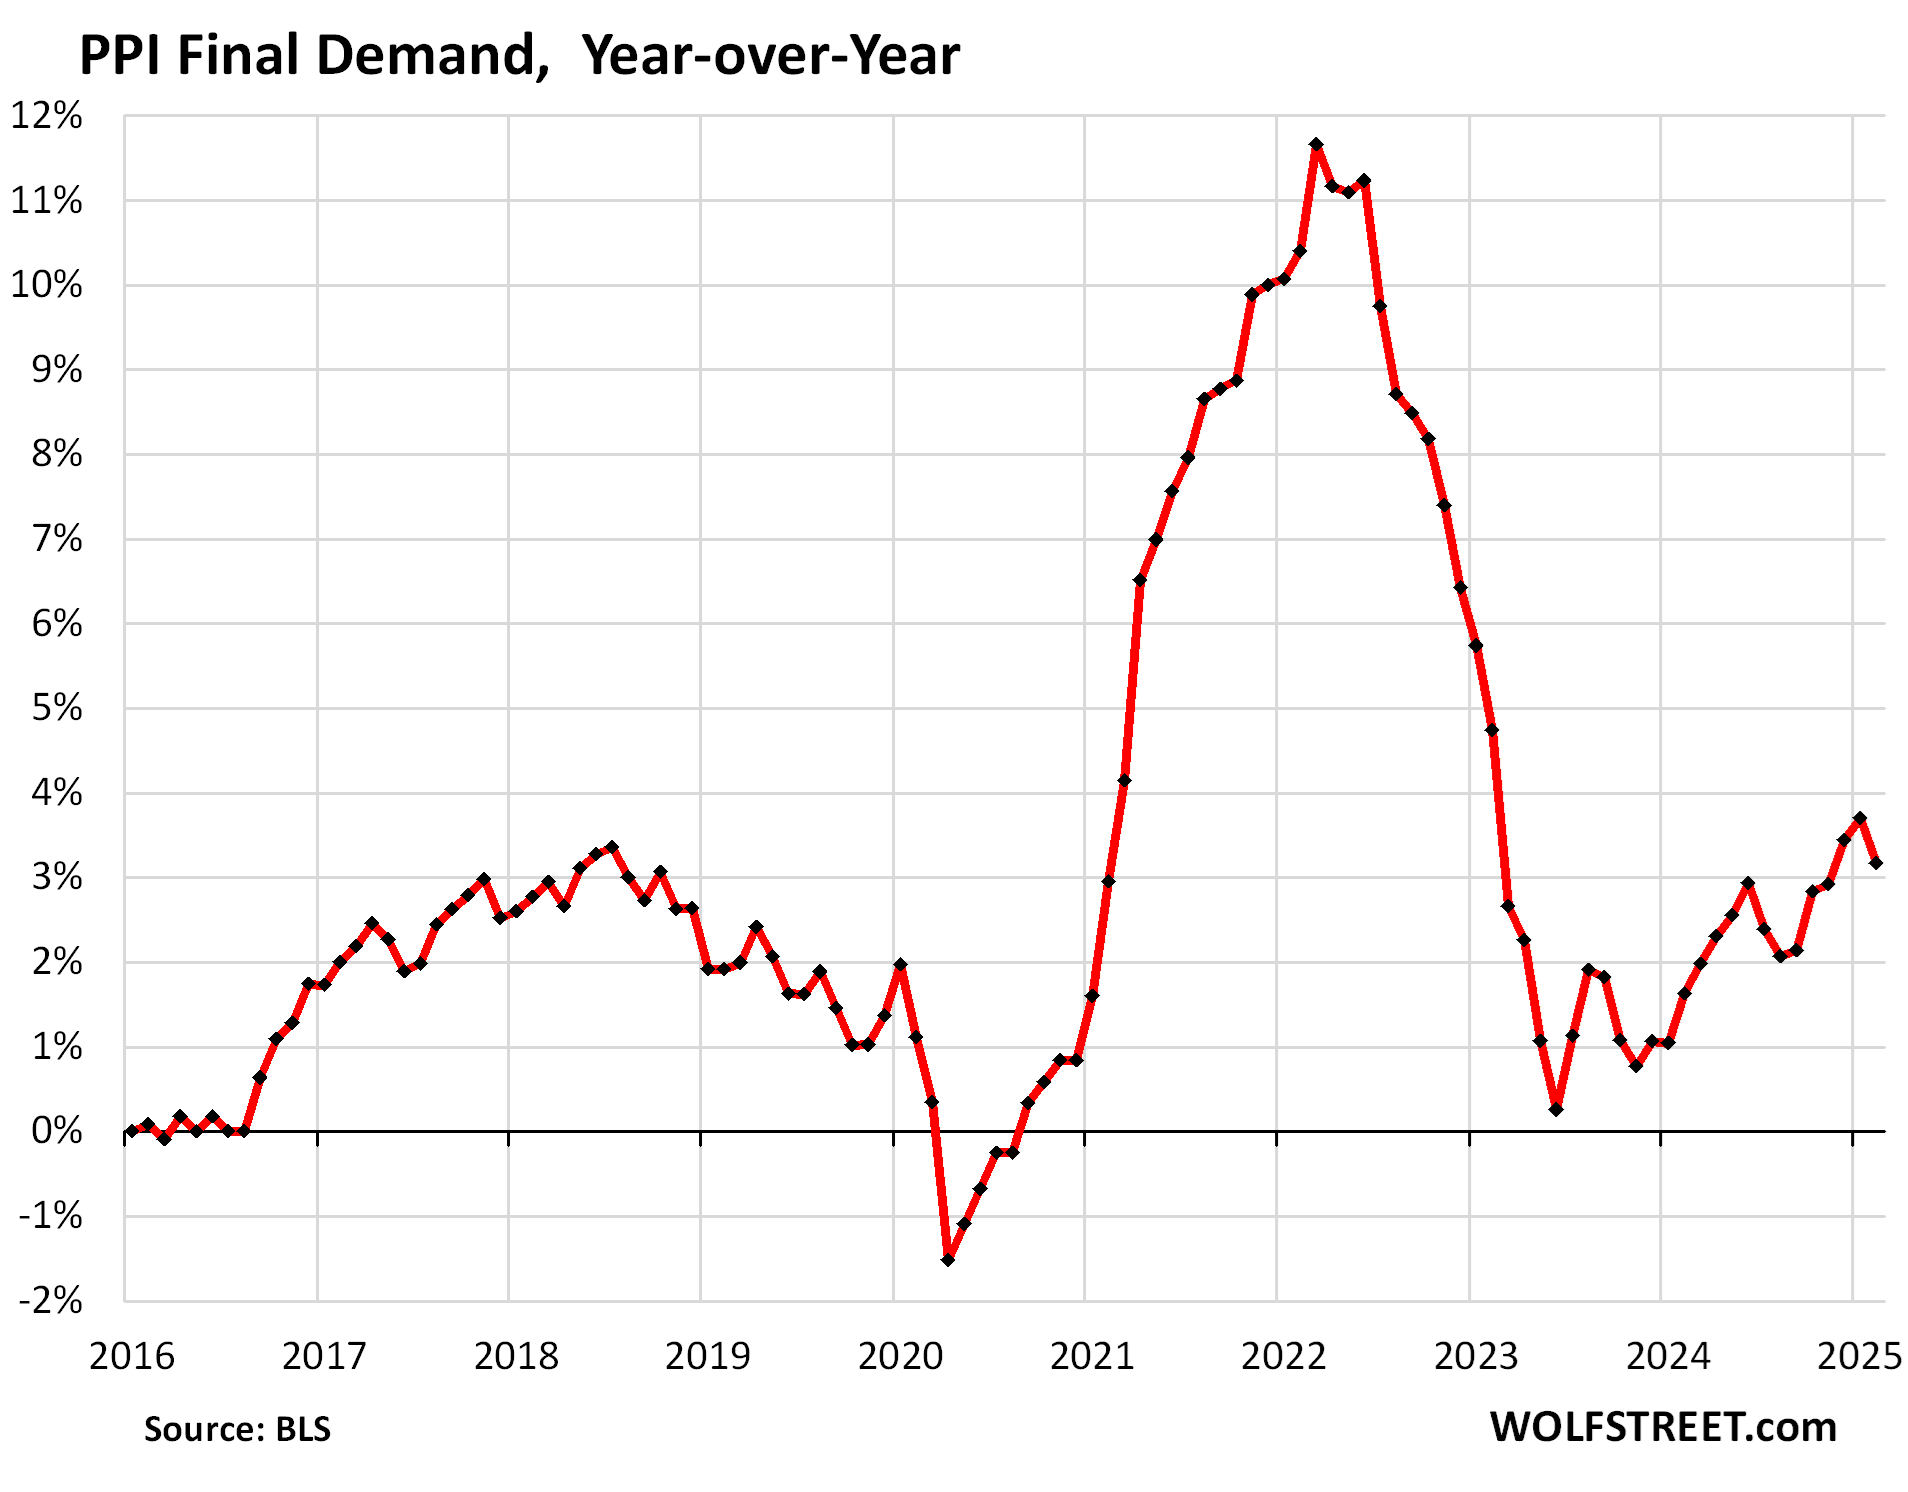
The PPI tracks inflation in goods and services that companies buy and whose higher costs they ultimately try to pass on to their customers.
Energy prices dropped in February (-1.2% month-to-month), after several month-to-month increases. Gasoline prices dropped by 4.7% at the wholesale level. Year-over-year the energy PPI fell by 3.7%.
Food prices jumped by 1.7% in February from January, after the 1.0% jump in January. The avian flu’s impact on egg production played a role, as egg prices jumped 54%. Year-over-year, food prices at the wholesale level increased by 5.9%.
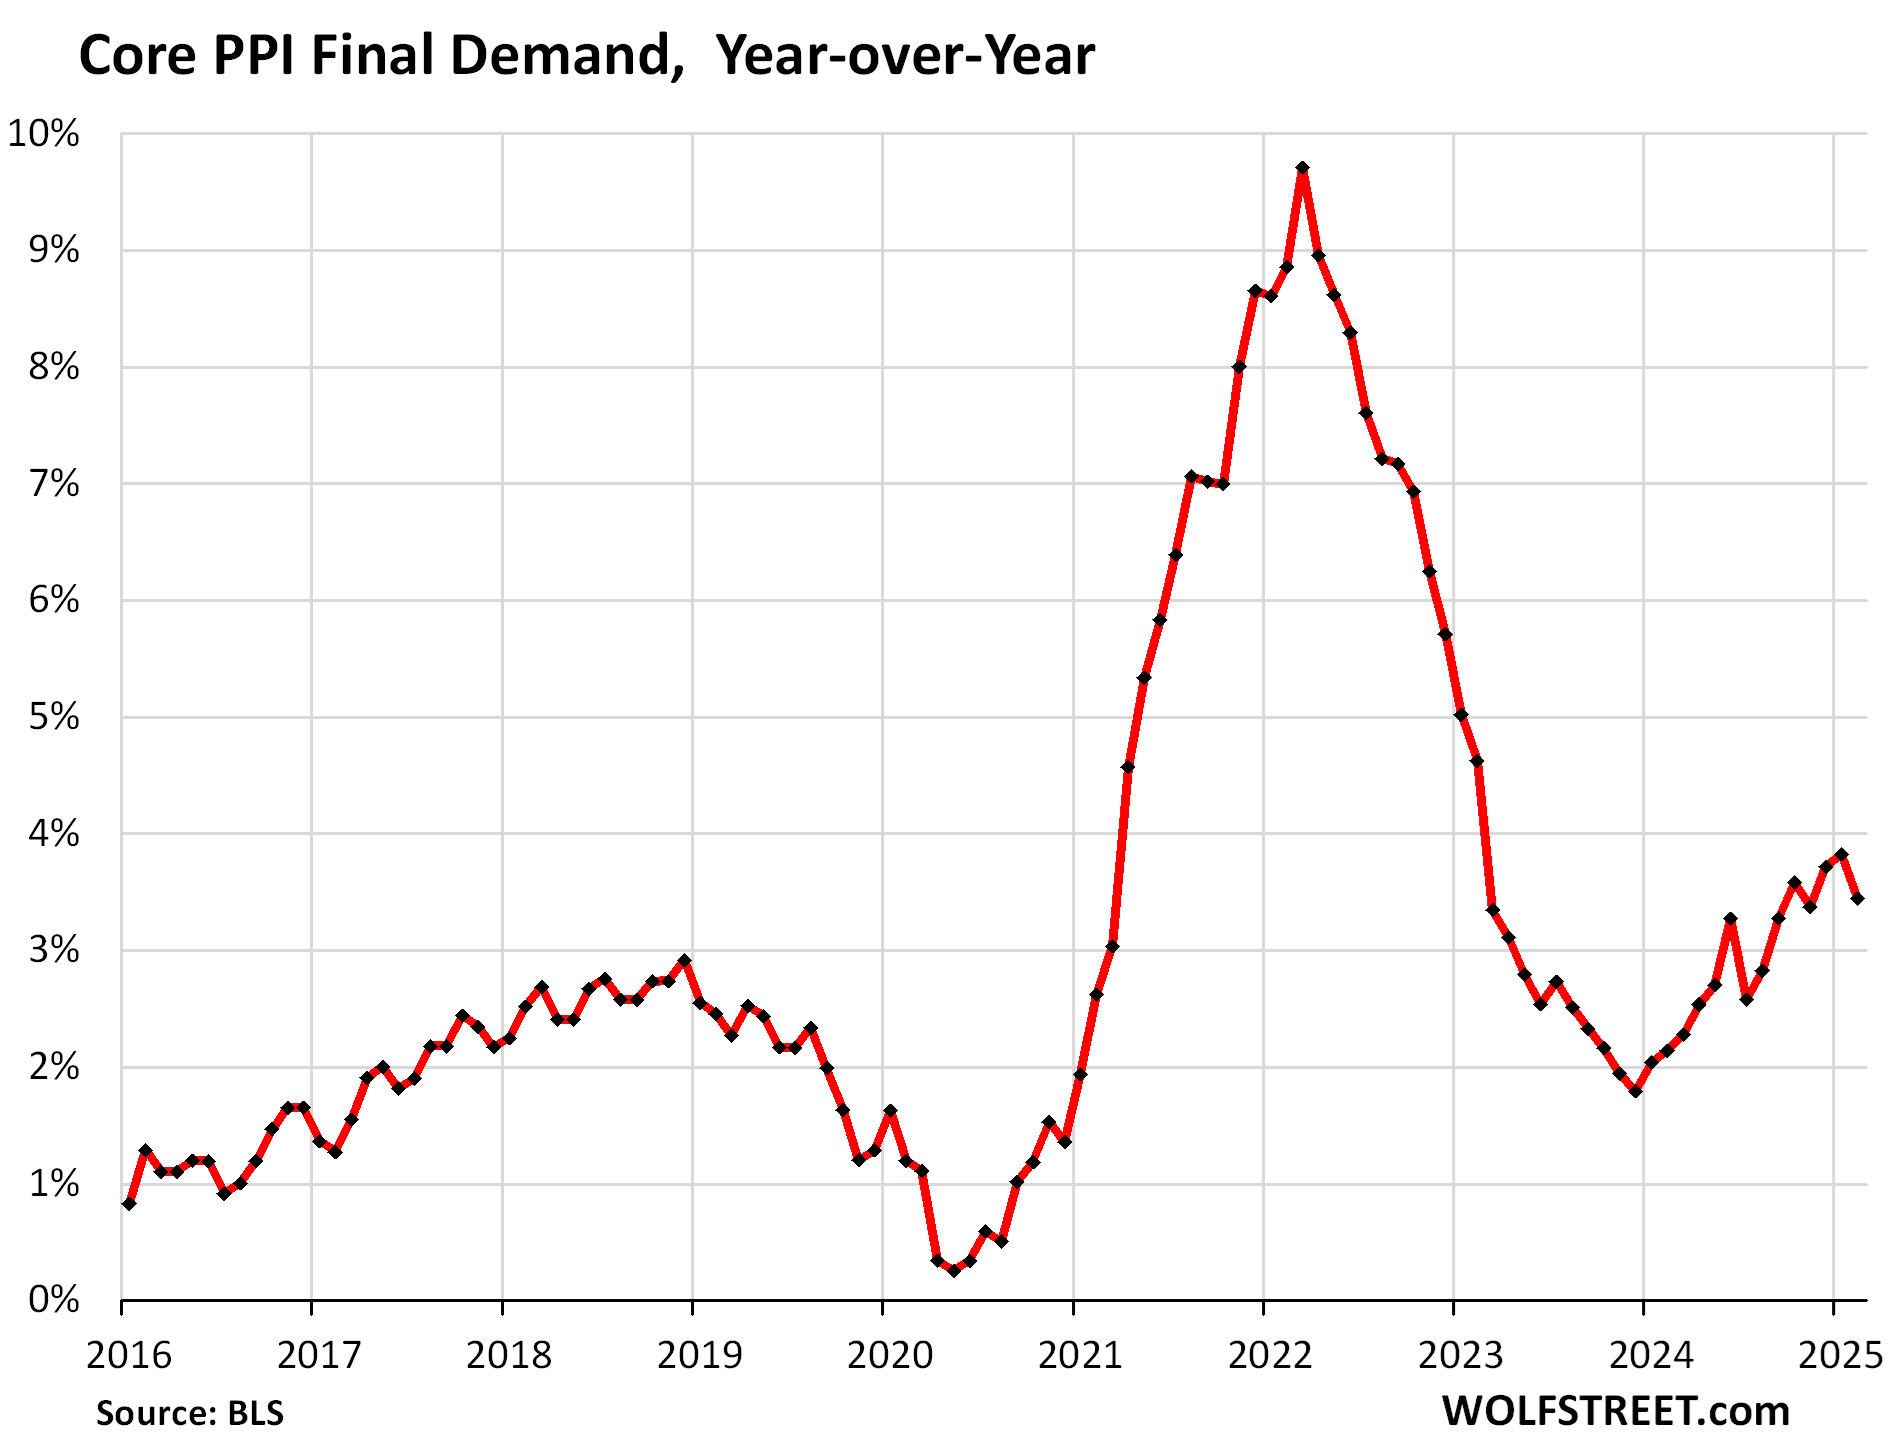
Without food & energy: “Core” PPI for February (to be upwardly revised next month?) declined by 0.6% in February from the upwardly revised January, which had been the biggest increase since June 2024.
Year-over-year, core PPI rose by 3.45%, a deceleration from the upwardly revised January reading.
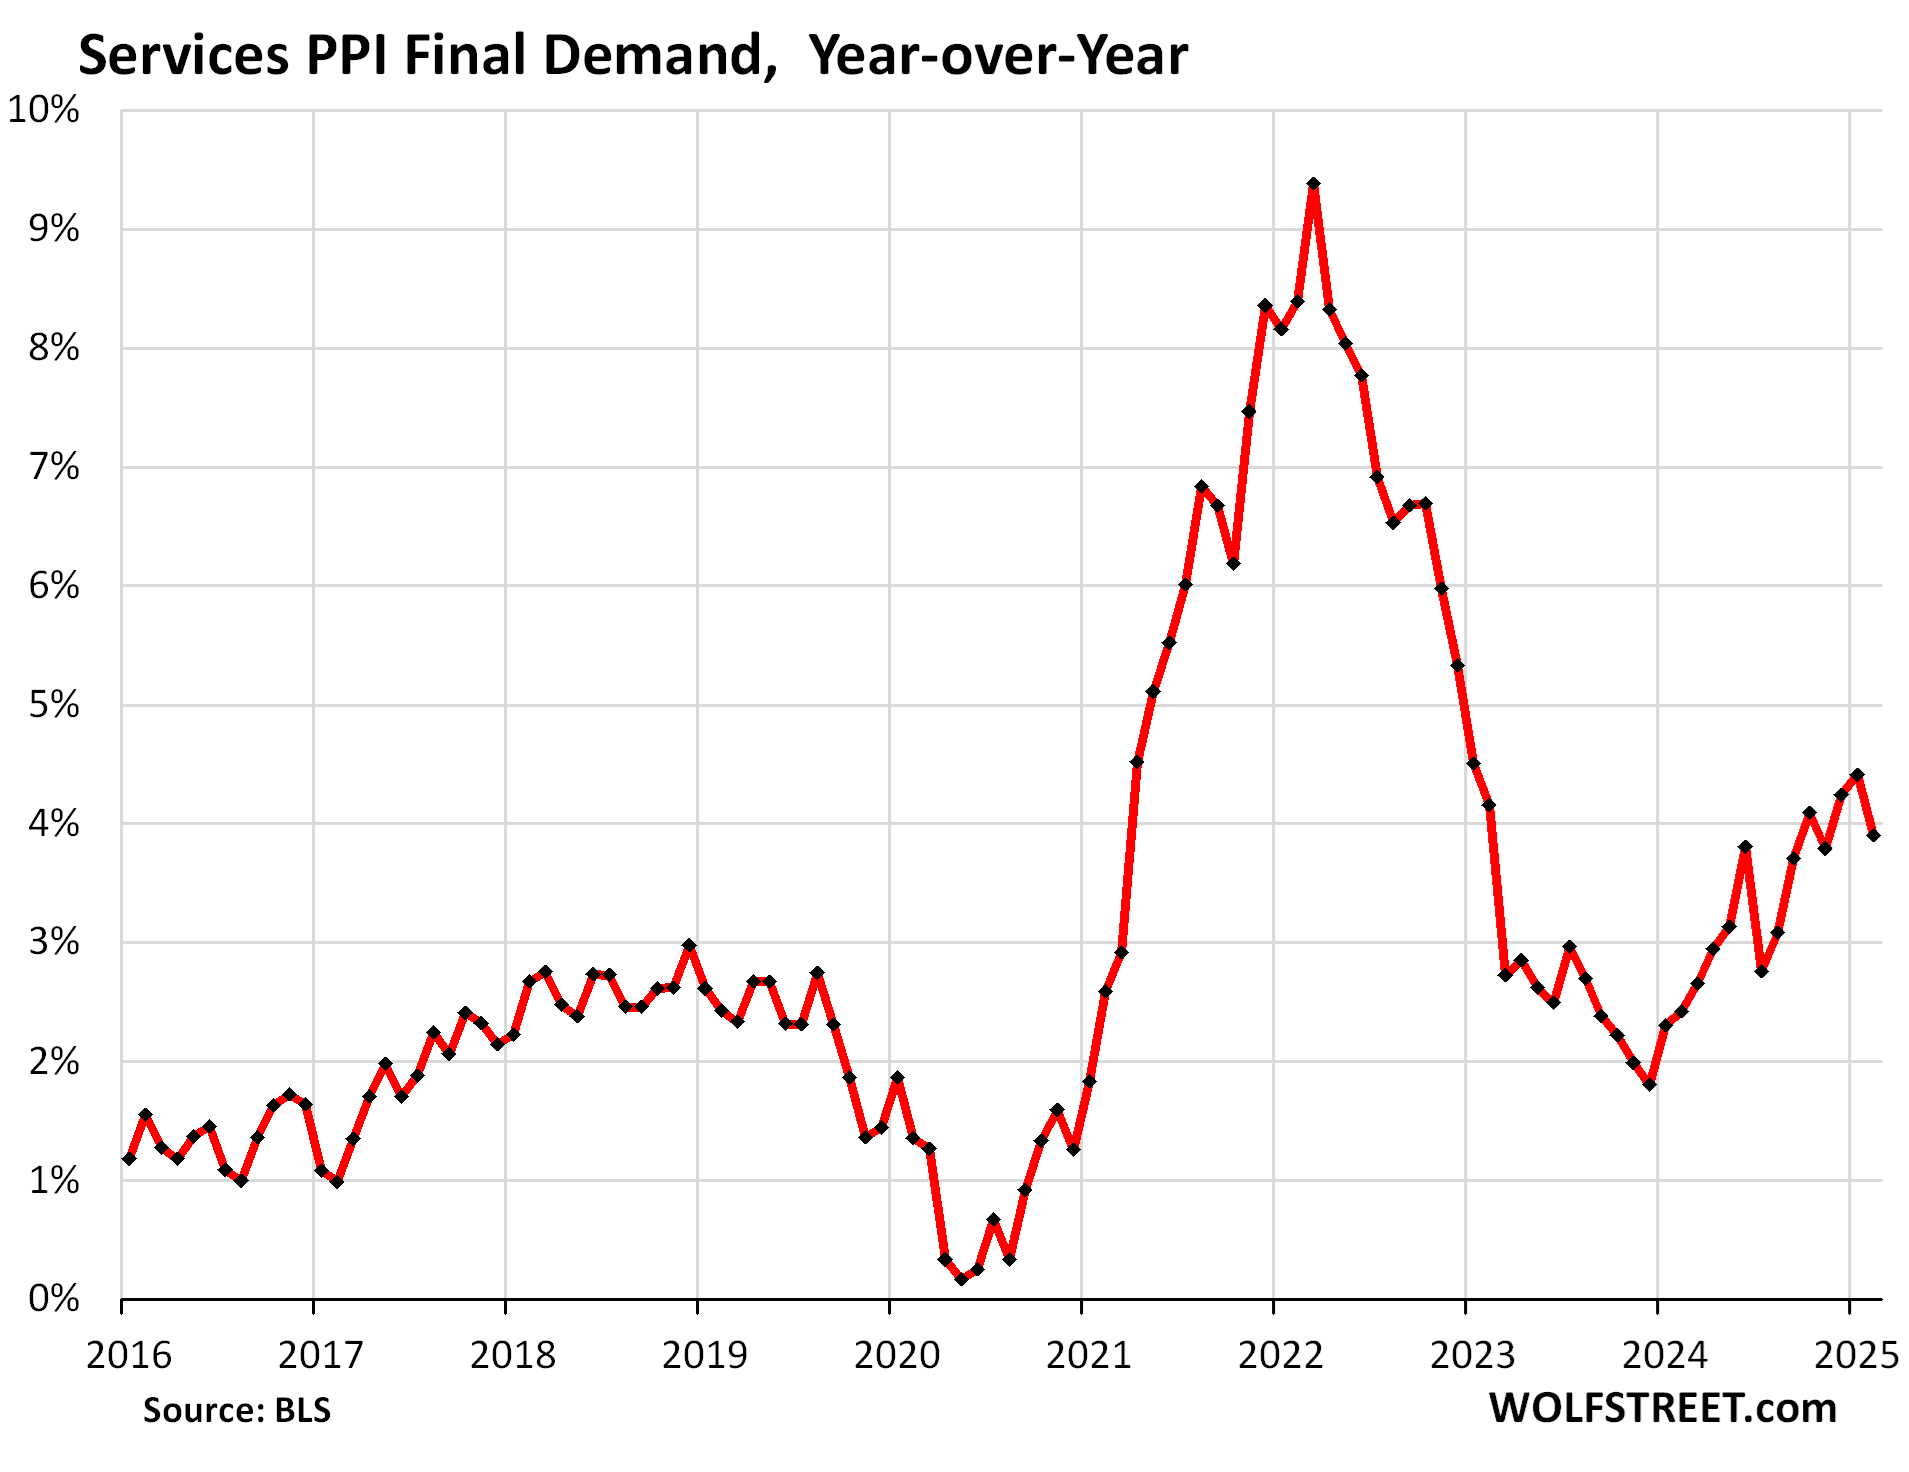
The services PPI, which accounts for 67.5% of the overall PPI but excludes energy services, declined by 0.16% in February from the upwardly revised January.
The month-to-month decline was driven by margins for trade services, which dropped by 1.0% (the trade PPI tracks changes in margins received by wholesalers and retailers). Without trade, transportation, and warehousing, services rose by 0.2% in February from January.
Year-over-year, services PPI rose by 3.9%, a deceleration from the upwardly revised January reading that flipped from the previously reported decline to the hottest increase since January 2023 (see first chart above with the blue and red lines):
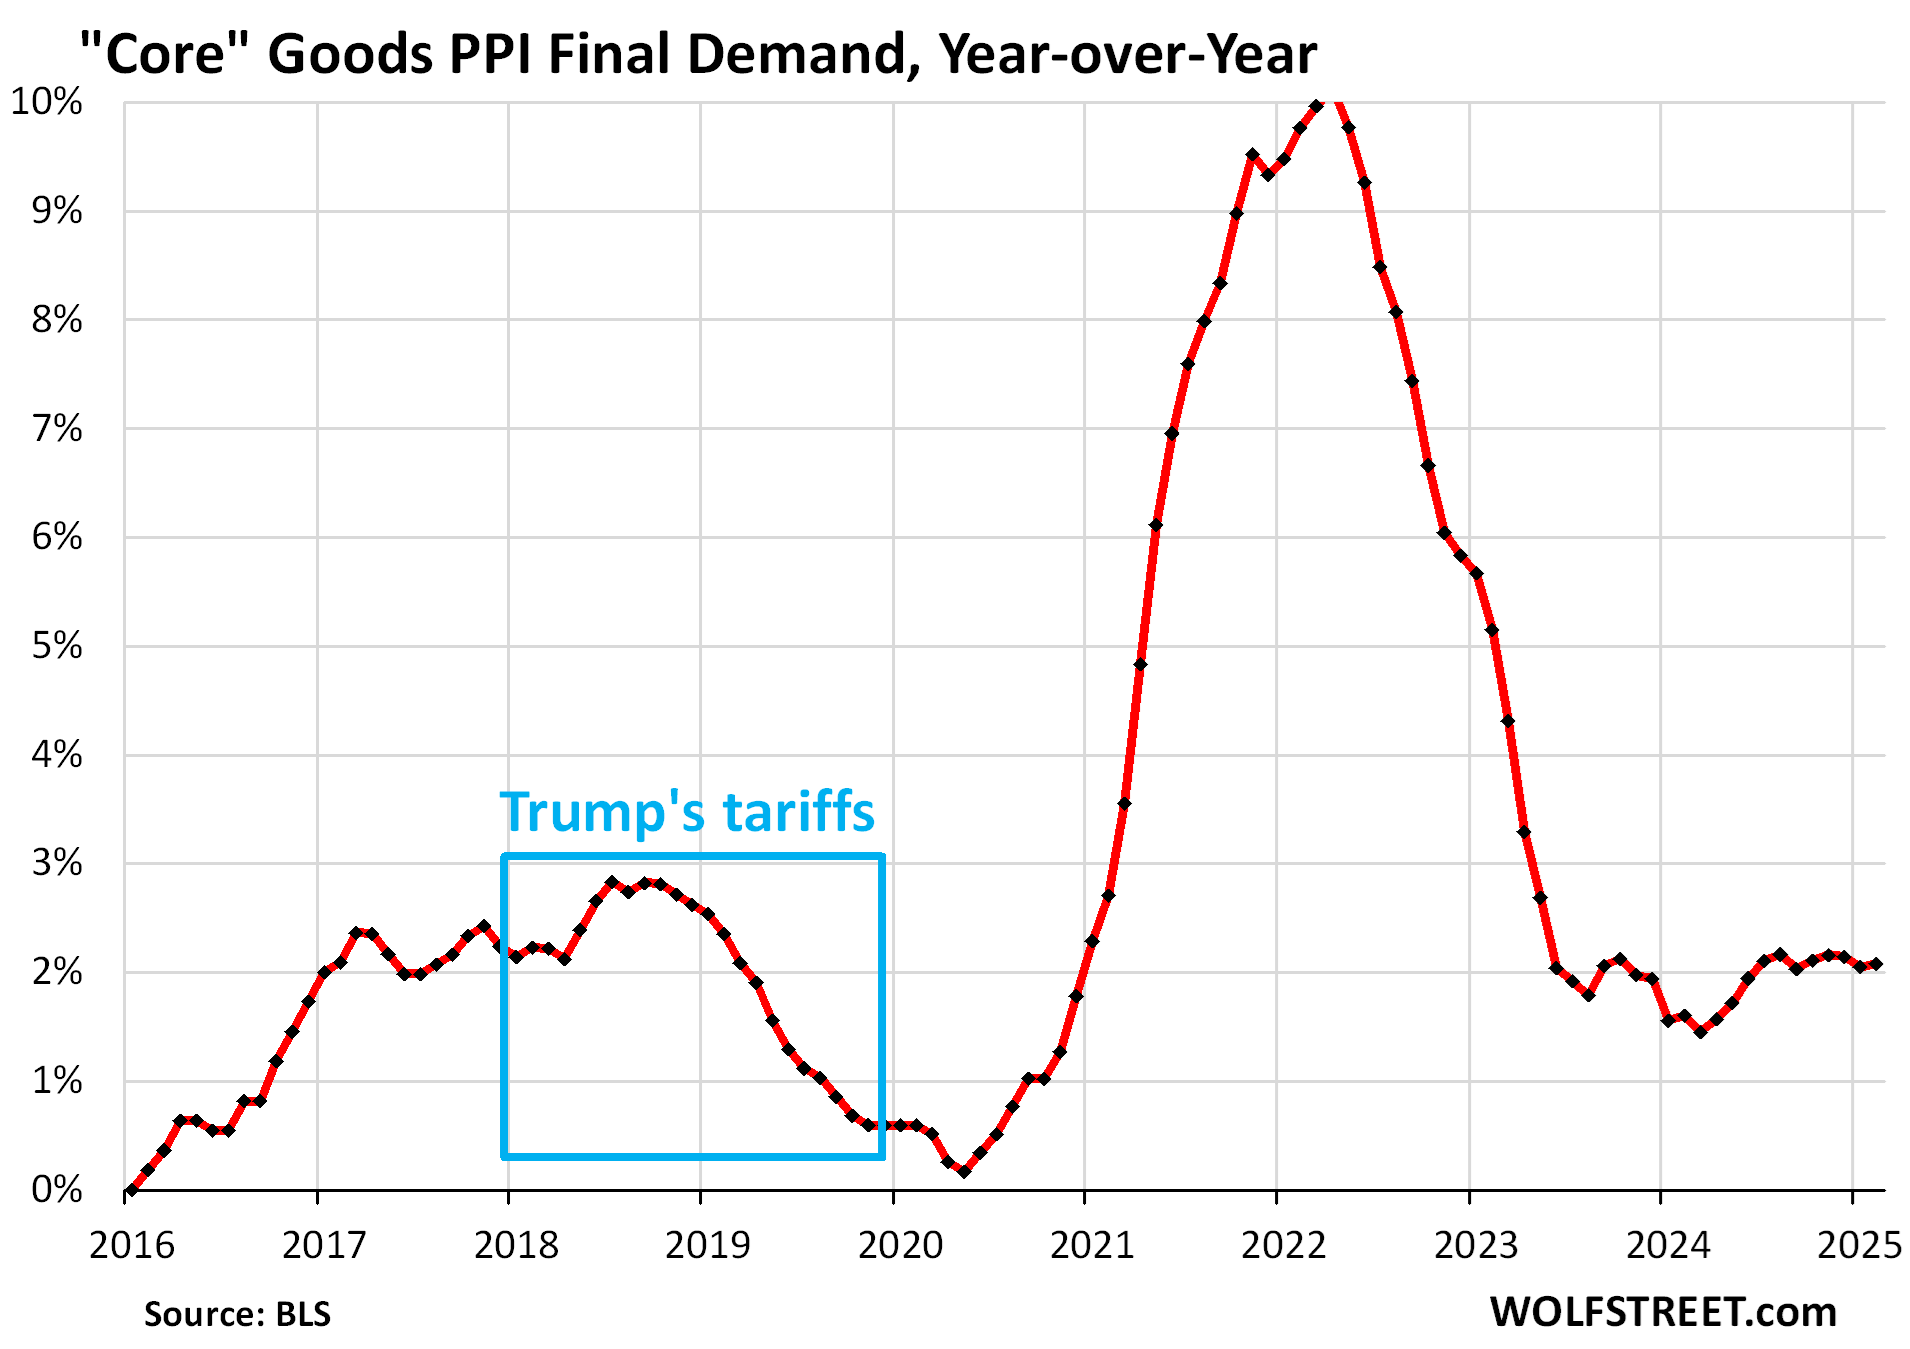
The “core goods” PPI was revised up by only 4 basis points for January (to +0.17% from +0.13%). But in February, it jumped by 0.35% (+4.3% annualized), the biggest increase since January 2023.
Year-over-year, it rose by 2.1%, in the same 2%-plus range of increases for the eighth month in a row. The PPI for “core goods” covers goods that companies buy but excludes food and energy products.
This is where tariffs would show up if they get passed on this far. Last time, there was a little bump in early to mid-2018, even though the final tariffs weren’t implemented until later in 2018 (blue box).
But companies could not pass on the price increases overall to consumers, and consumer price inflation for durable goods, where tariffs would have hit the most, remained negative (in deflation) throughout that time (PCE price index charts for durable goods and all goods, and article). This time, it’s different?
Enjoy reading WOLF STREET and want to support it? You can donate. I appreciate it immensely. Click on the mug to find out how:

![]()
Energy News Beat