
By Wolf Richter for WOLF STREET.
The reason we’re looking at the underlying dynamics of the labor market is to gauge the pressure within the Fed to cut interest rates to prevent the labor market from weakening. And in these underlying dynamics, there are no reasons for the Fed to cut interest rates further. The labor market is not weakening, it has been tightening just a little since September. Over the same period, inflation measures have accelerated some. And that combination has caused the Fed to move any rate cuts into the distance, and even Trump suddenly thought that this pivot to wait-and-see “was the right thing to do.”
Job openings, after two months of strong increases, gave up some of those increases in December and fell to 7.60 million, seasonally adjusted, in very squiggly month-to-month data. The low point was in September at 7.37 million openings (blue in the chart below).
The three-month average, which irons out those month-to-month squiggles and shows the trends of the underlying dynamics of the labor market, ticked up for the third month in a row from the low point in September, and even the September low point was still above the prior historic high point in late 2018 (red).
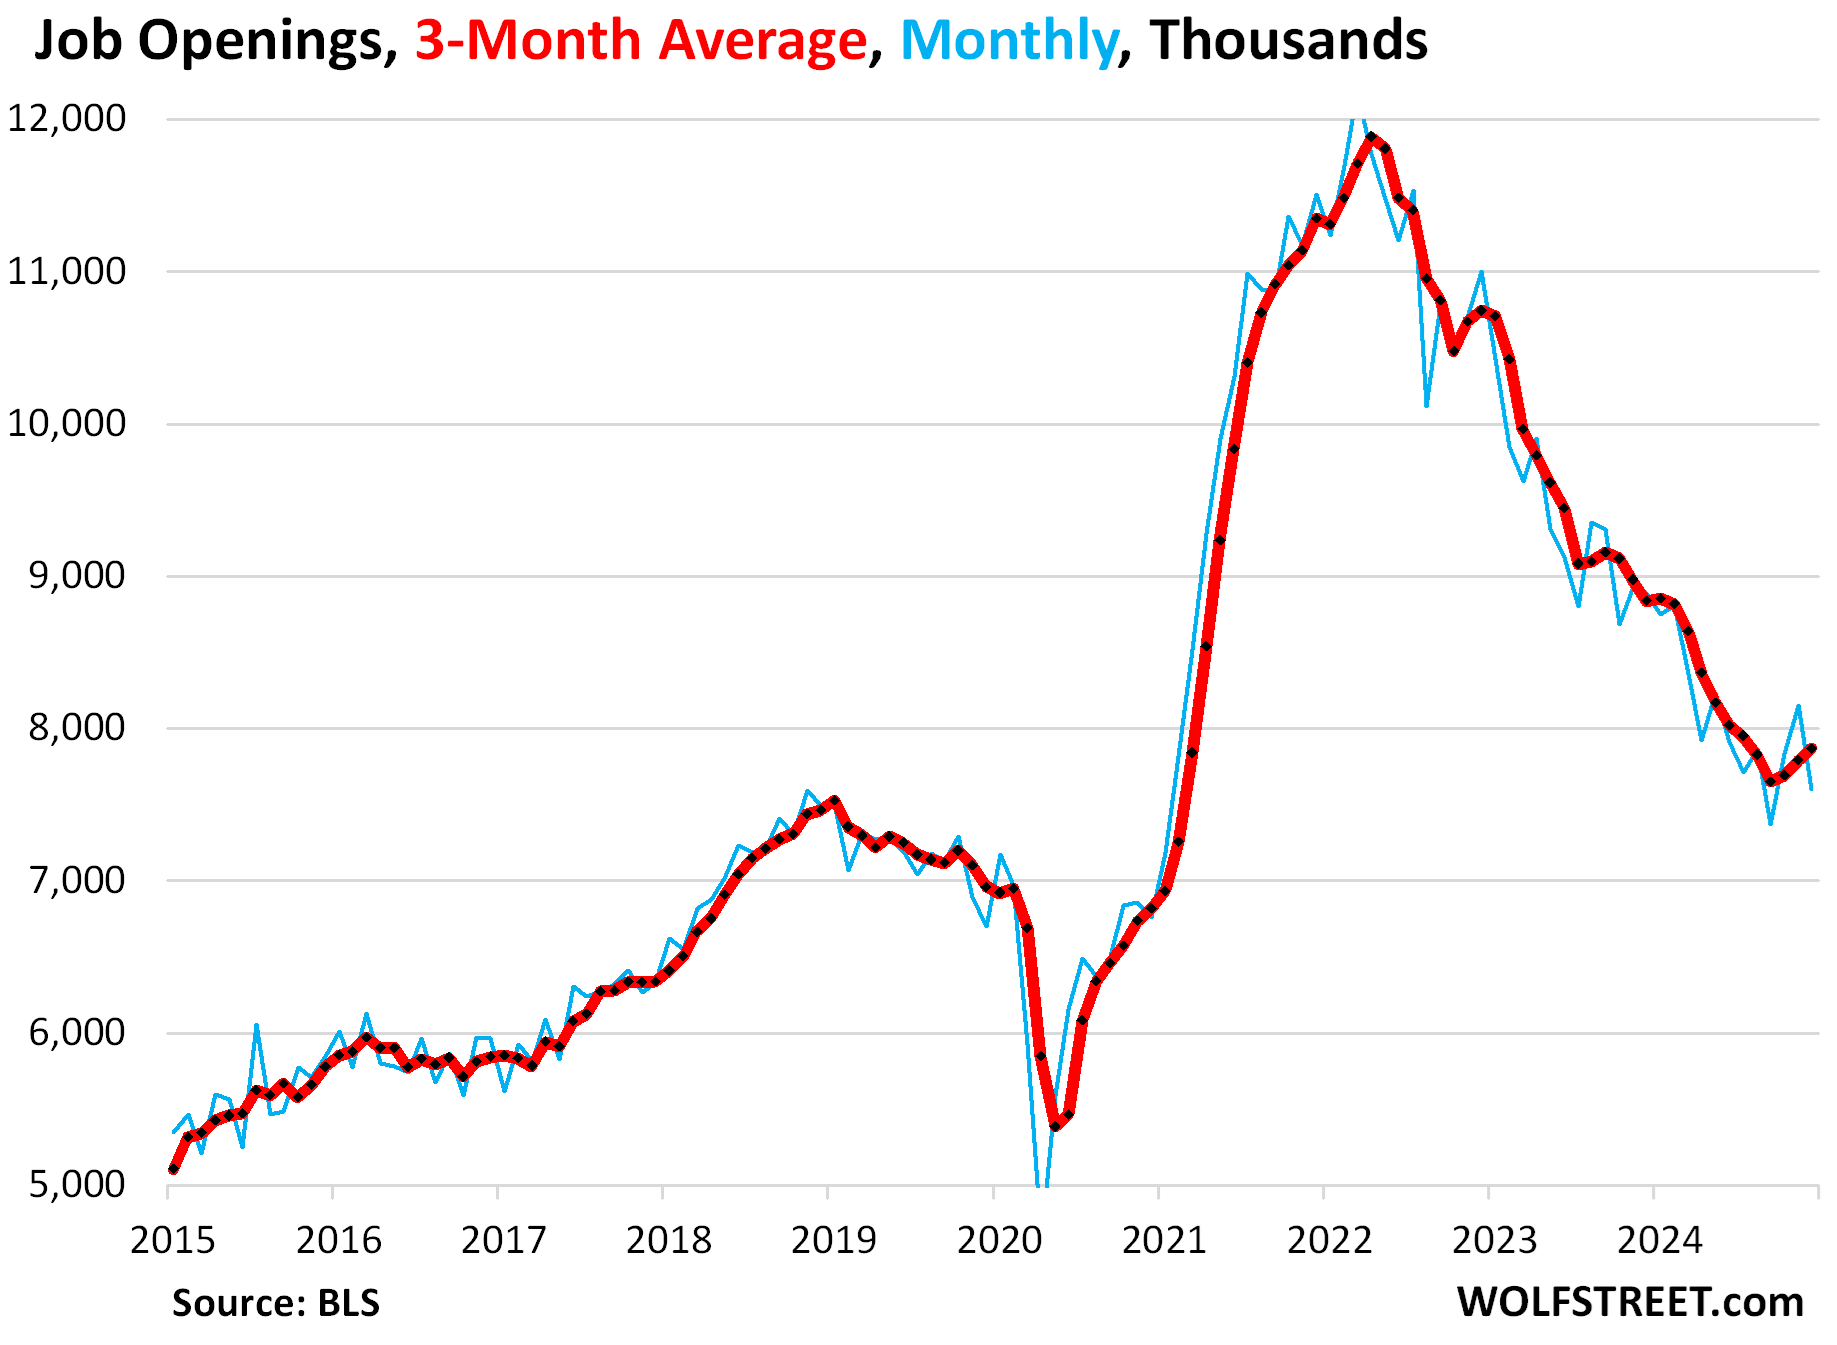
This date from the Job Openings and Labor Turnover Survey (JOLTS) from the Bureau of Labor Statistics today is based on surveys of about 21,000 work locations, and not on online job listings.
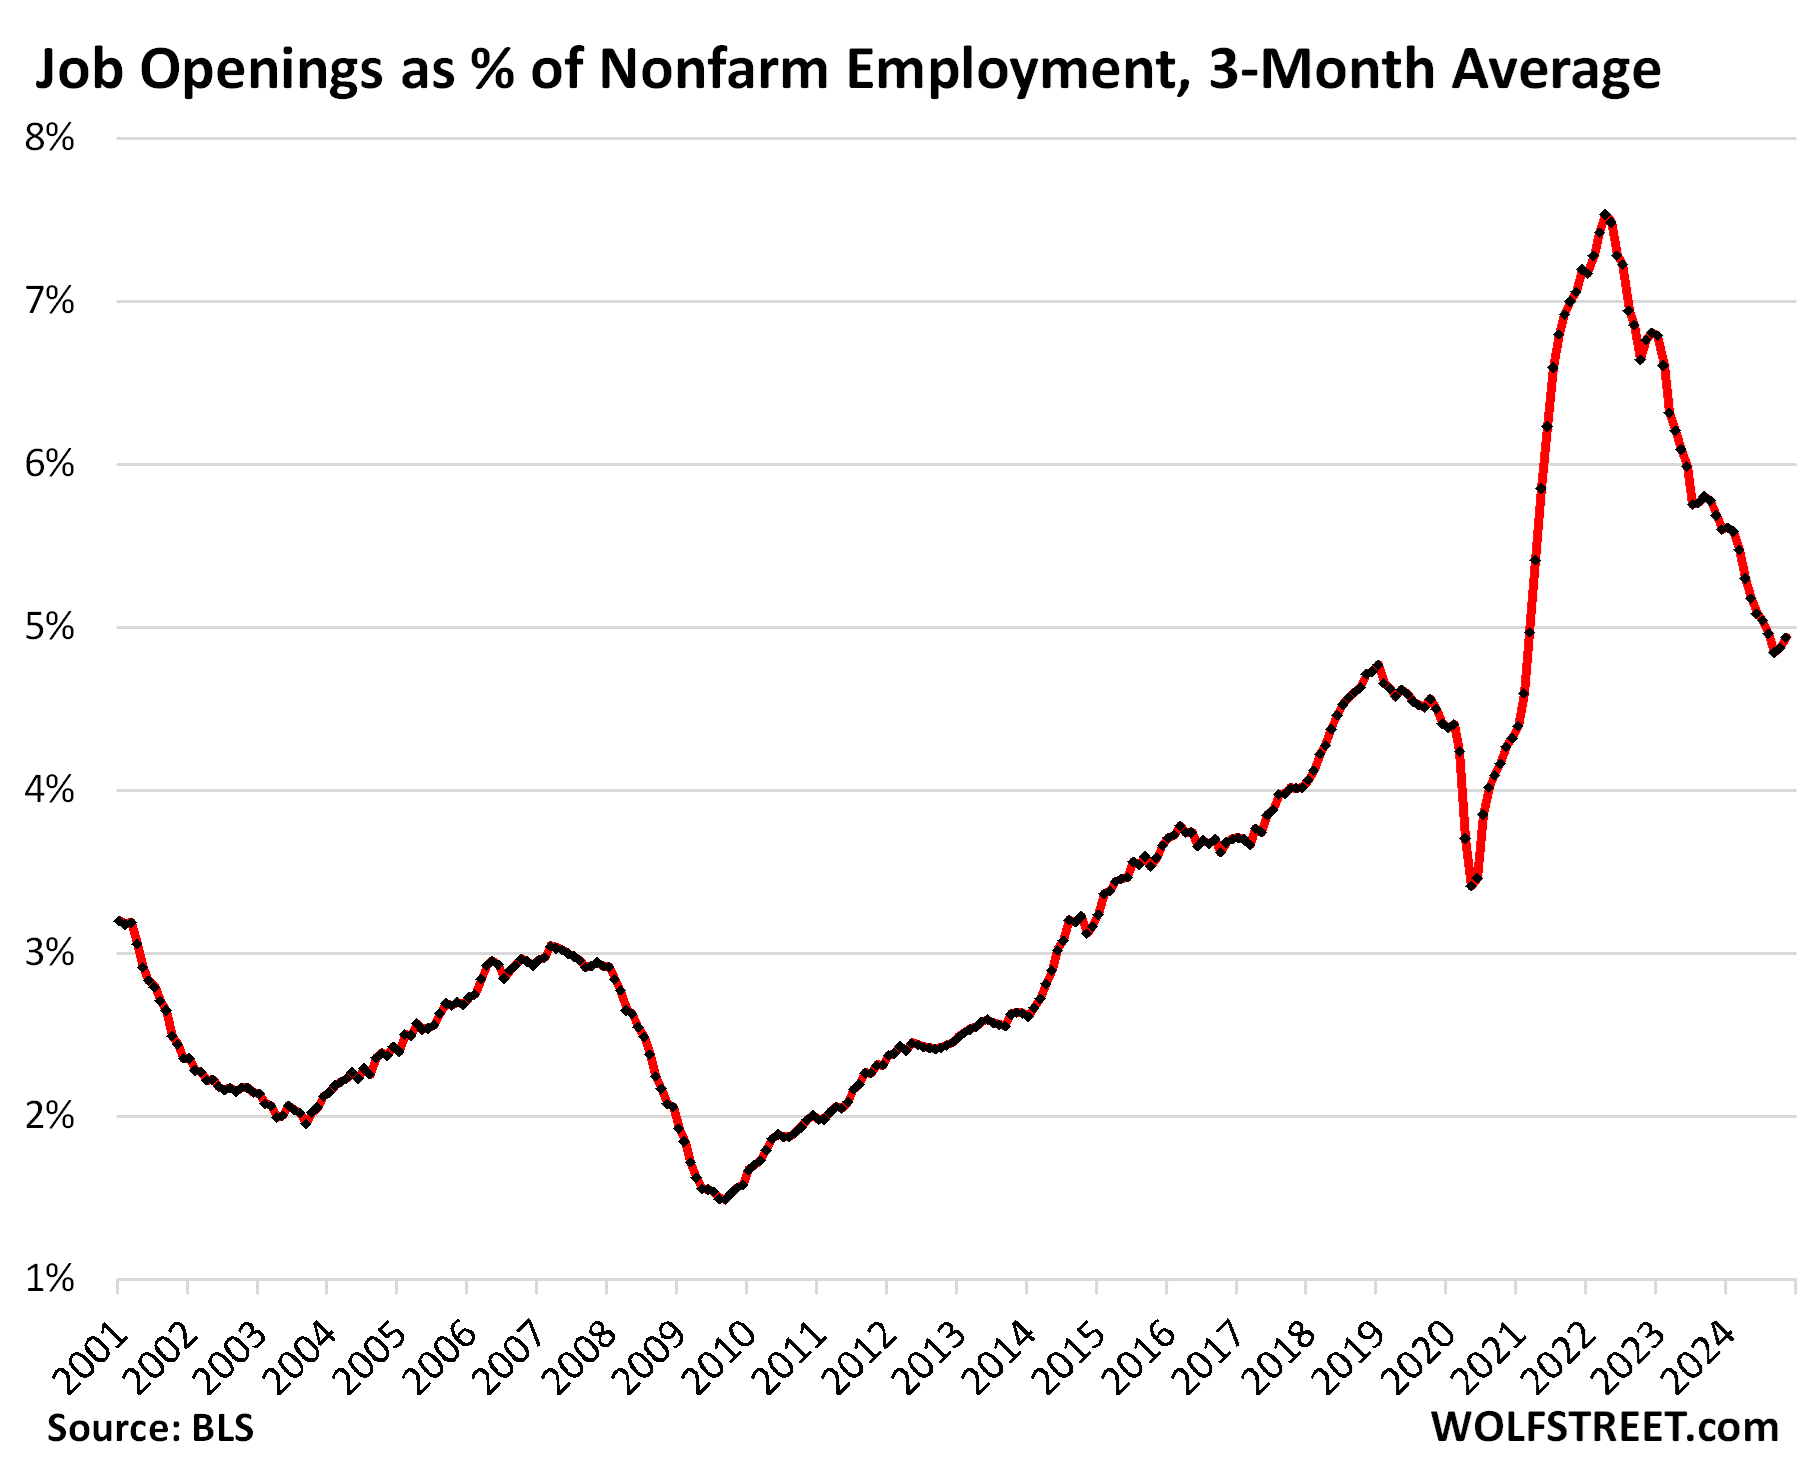
Job openings in relationship to nonfarm payrolls ticked up again and is still at levels that had never been seen before the pandemic. In December, job openings amounted to 4.9% of nonfarm payrolls, the third month in a row of increases. This shows that the labor market is still historically tight, though not nearly as tight as it had been during the labor shortages of the pandemic:
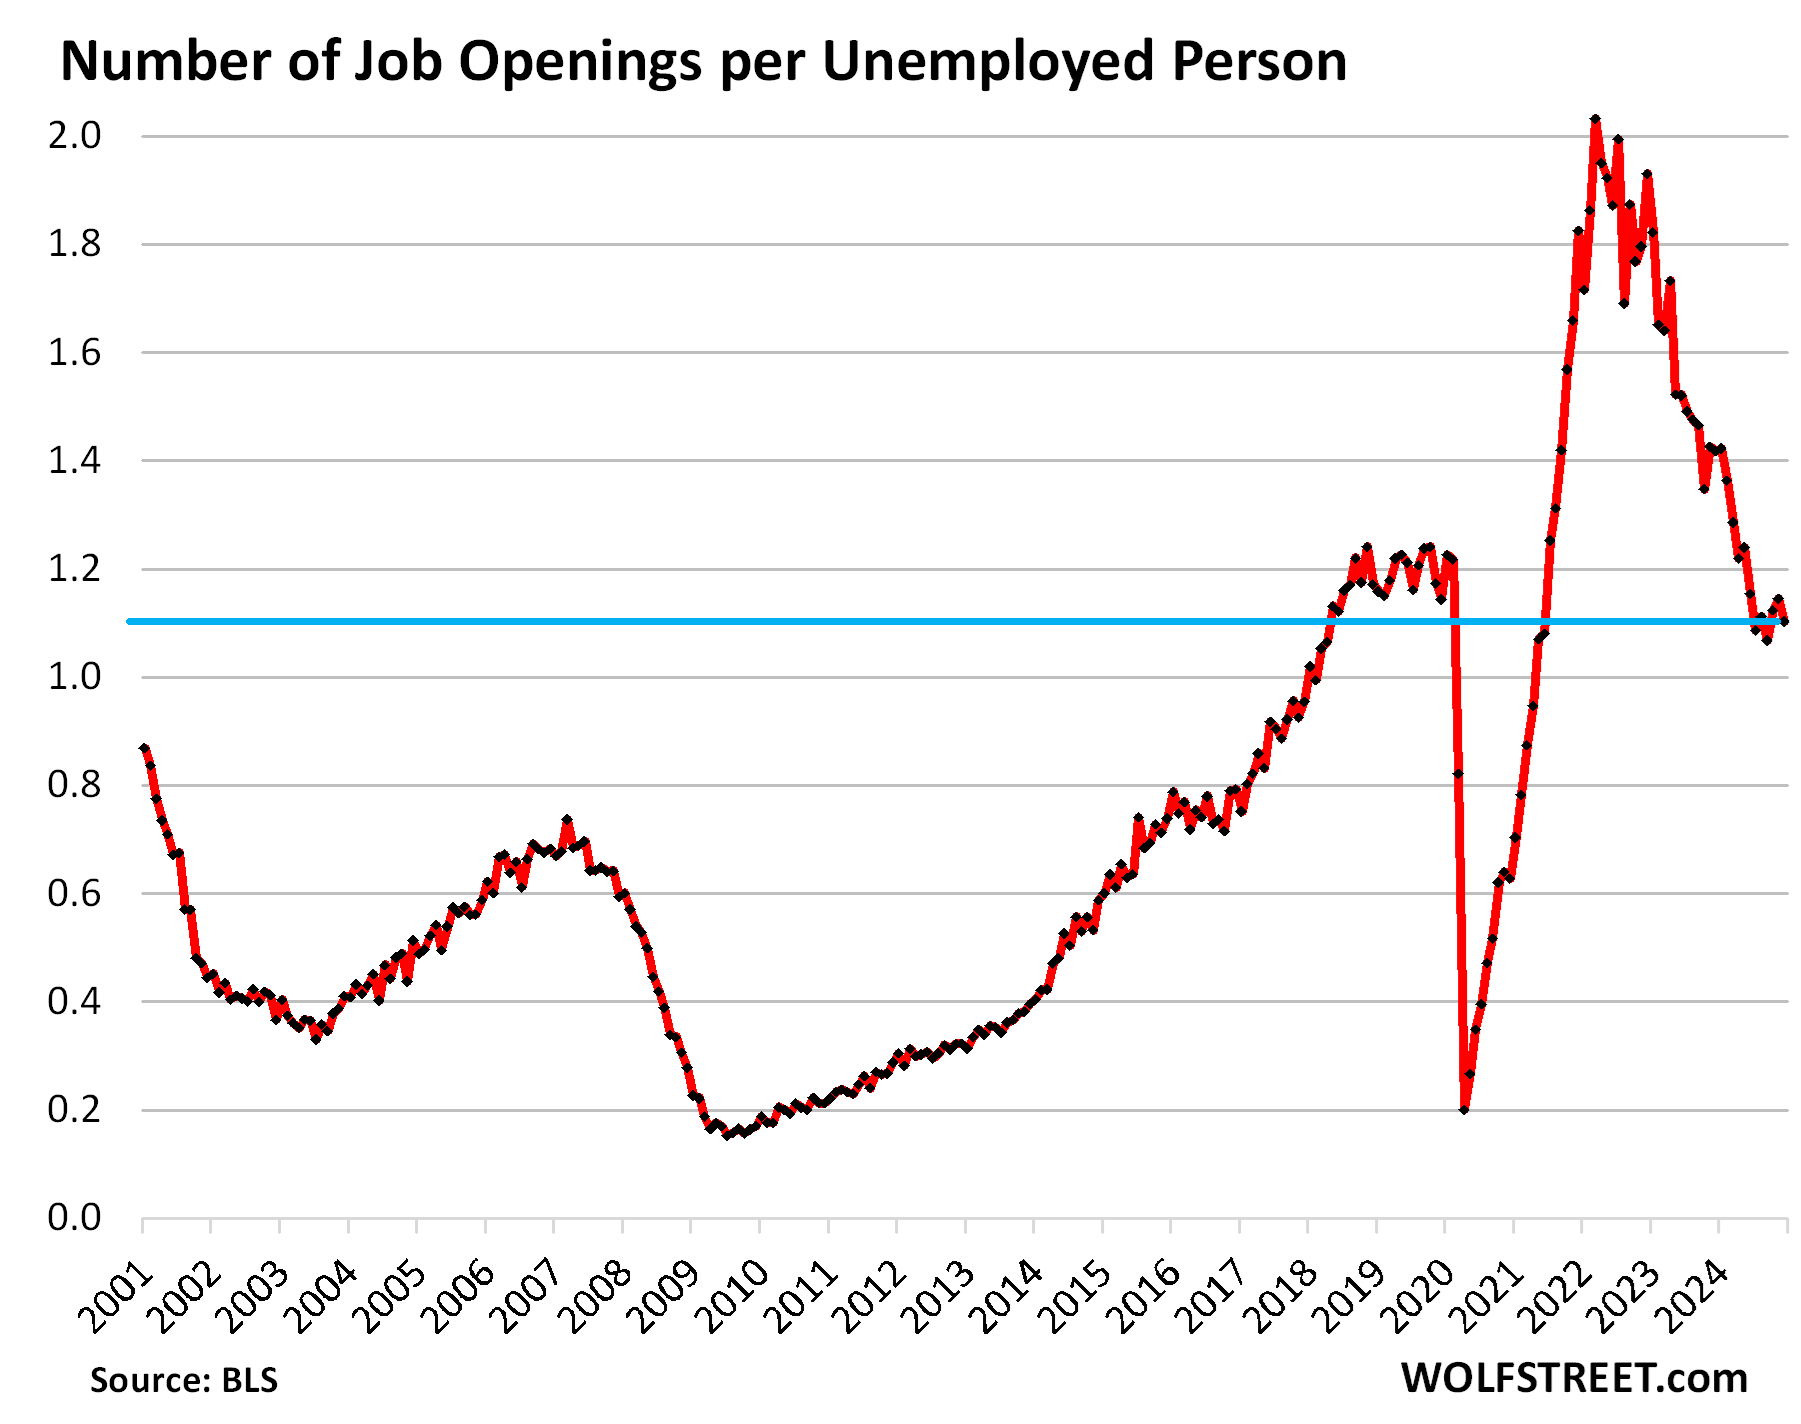
The figure Powell cites a lot: The number of job openings per unemployed person ticked down to 1.10 job openings for each person who was unemployed and looking for a job during the reference period (7.60 million job openings for 6.89 million unemployed people looking for work).
The ratio has remained in that range for the past six months, with a low point in September. It was in September that the Fed got spooked about further deterioration of the labor market. But that didn’t happen.
The ratio is relatively high – meaning a relatively tight labor market – compared to the prepandemic data going back to 2001, where only 2018 and 2019 had a higher ratio.
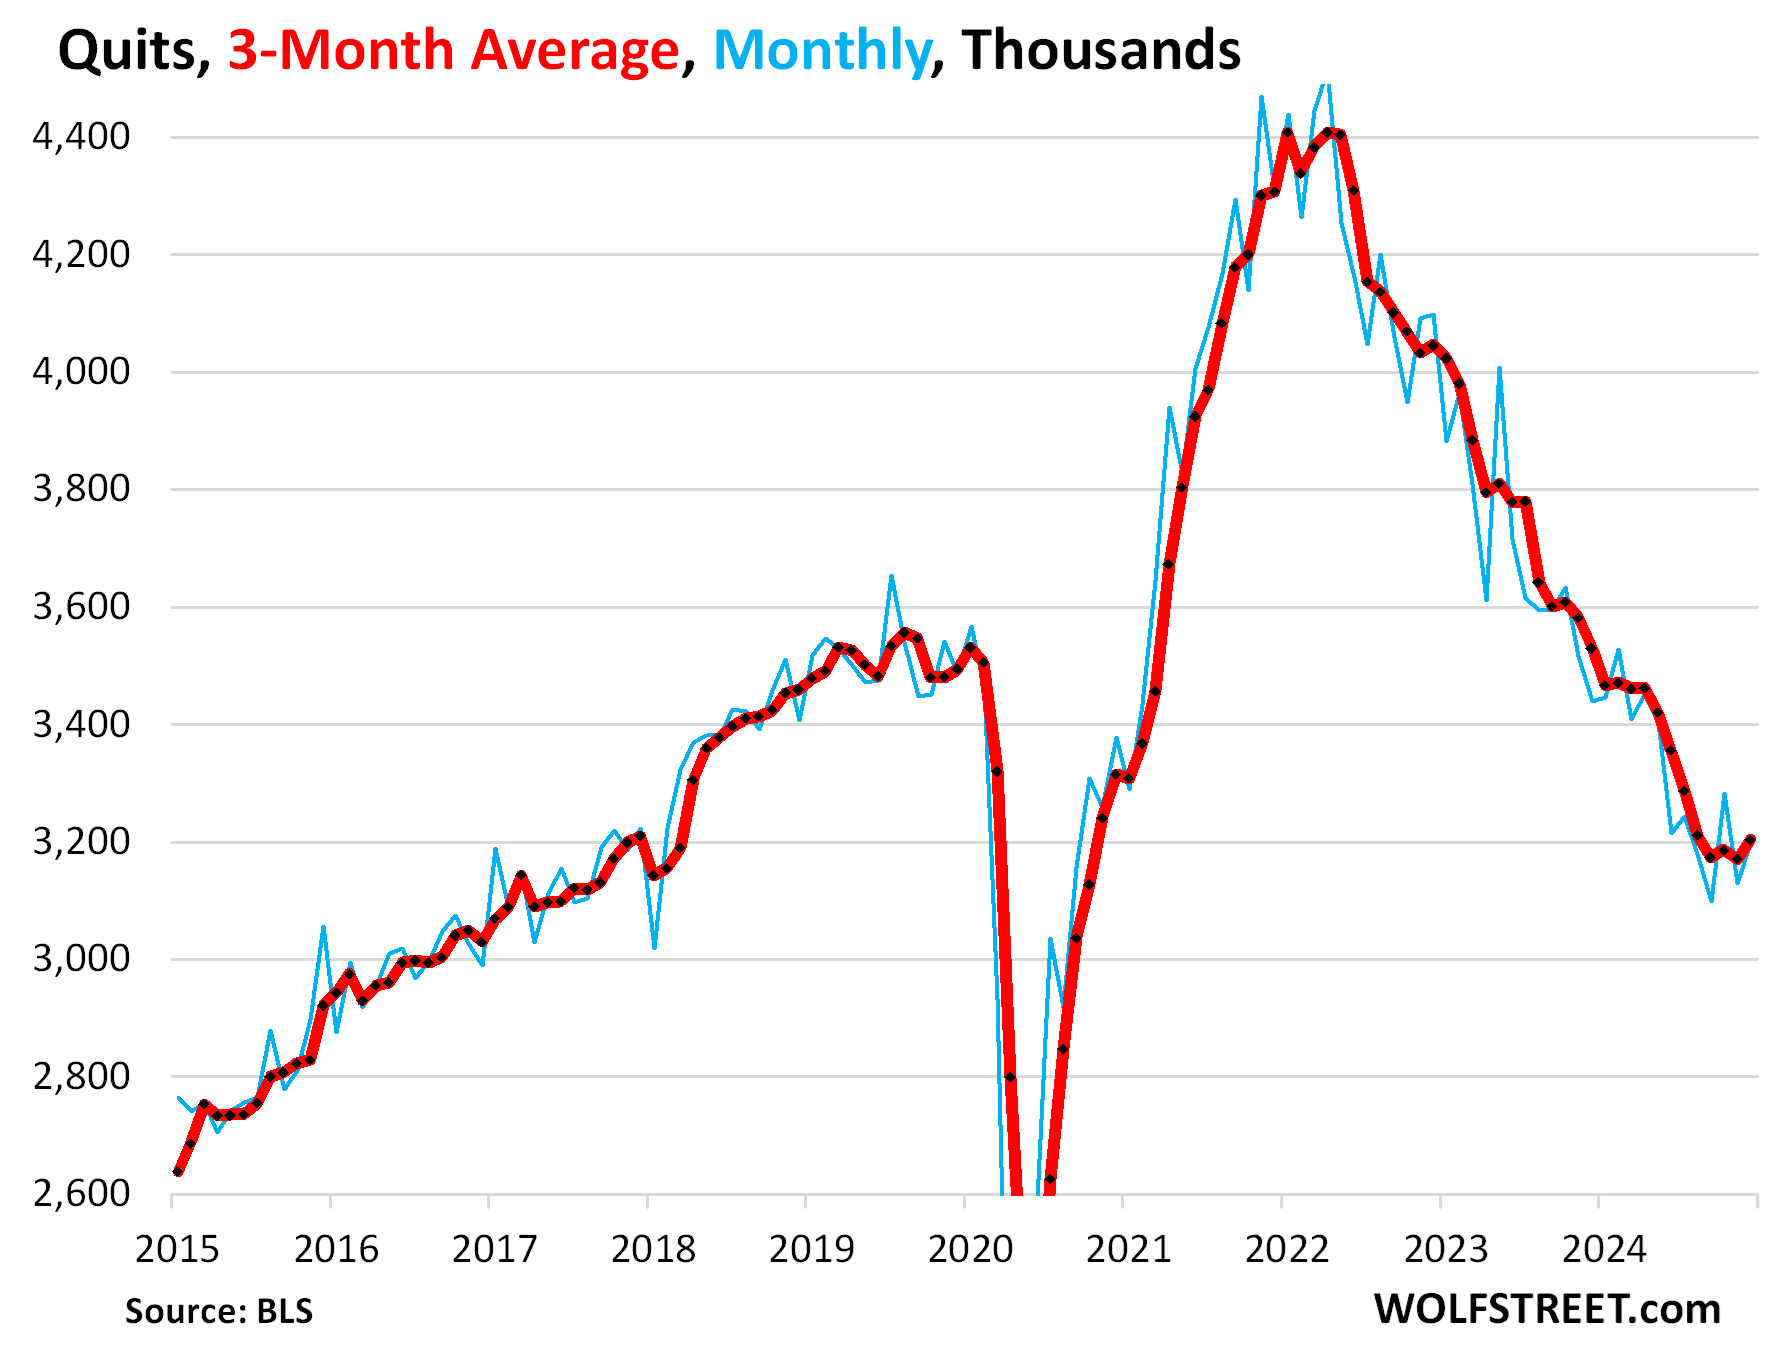
Voluntary quits have also turned the corner. The number of people who quit their jobs voluntarily in December rose to 3.20 million.
The three-month average, which irons out the month-to-month squiggles, rose to 3.20 million as well, the highest since August. This is the first time since the peak in mid-2022 that the three-month average is higher for a four-month period.
Quits are an indication of how emboldened employees feel to quit a job, such as to switch to a better job. Retirements, deaths, etc. are not considered “quits.” They’re categorized as “other discharges.”
The massive reshuffling in the workforce during the pandemic, when workers quit left and right to get better jobs, even in other industries, had triggered the biggest pay increases in decades as employers tried to retain their workers, or hire new workers to fill the slots that the quits had left behind.
Then the biggest employers cracked down, with huge layoff announcements that spiraled through the media, and some actual layoffs – while still hiring – which had knocked the confidence out of employees, and they put their nose to the corporate grindstone instead of quitting. And quits fell to relatively low levels, which created a lot of stability for companies, and productivity rose. But quits seem to have bottomed out now.
Quits directly impact job openings and hires. Fewer quits mean fewer newly open slots left behind that have to be filled, so fewer job openings, and fewer hires to fill those openings. The cycle of quits, job openings, and hires is just churn.
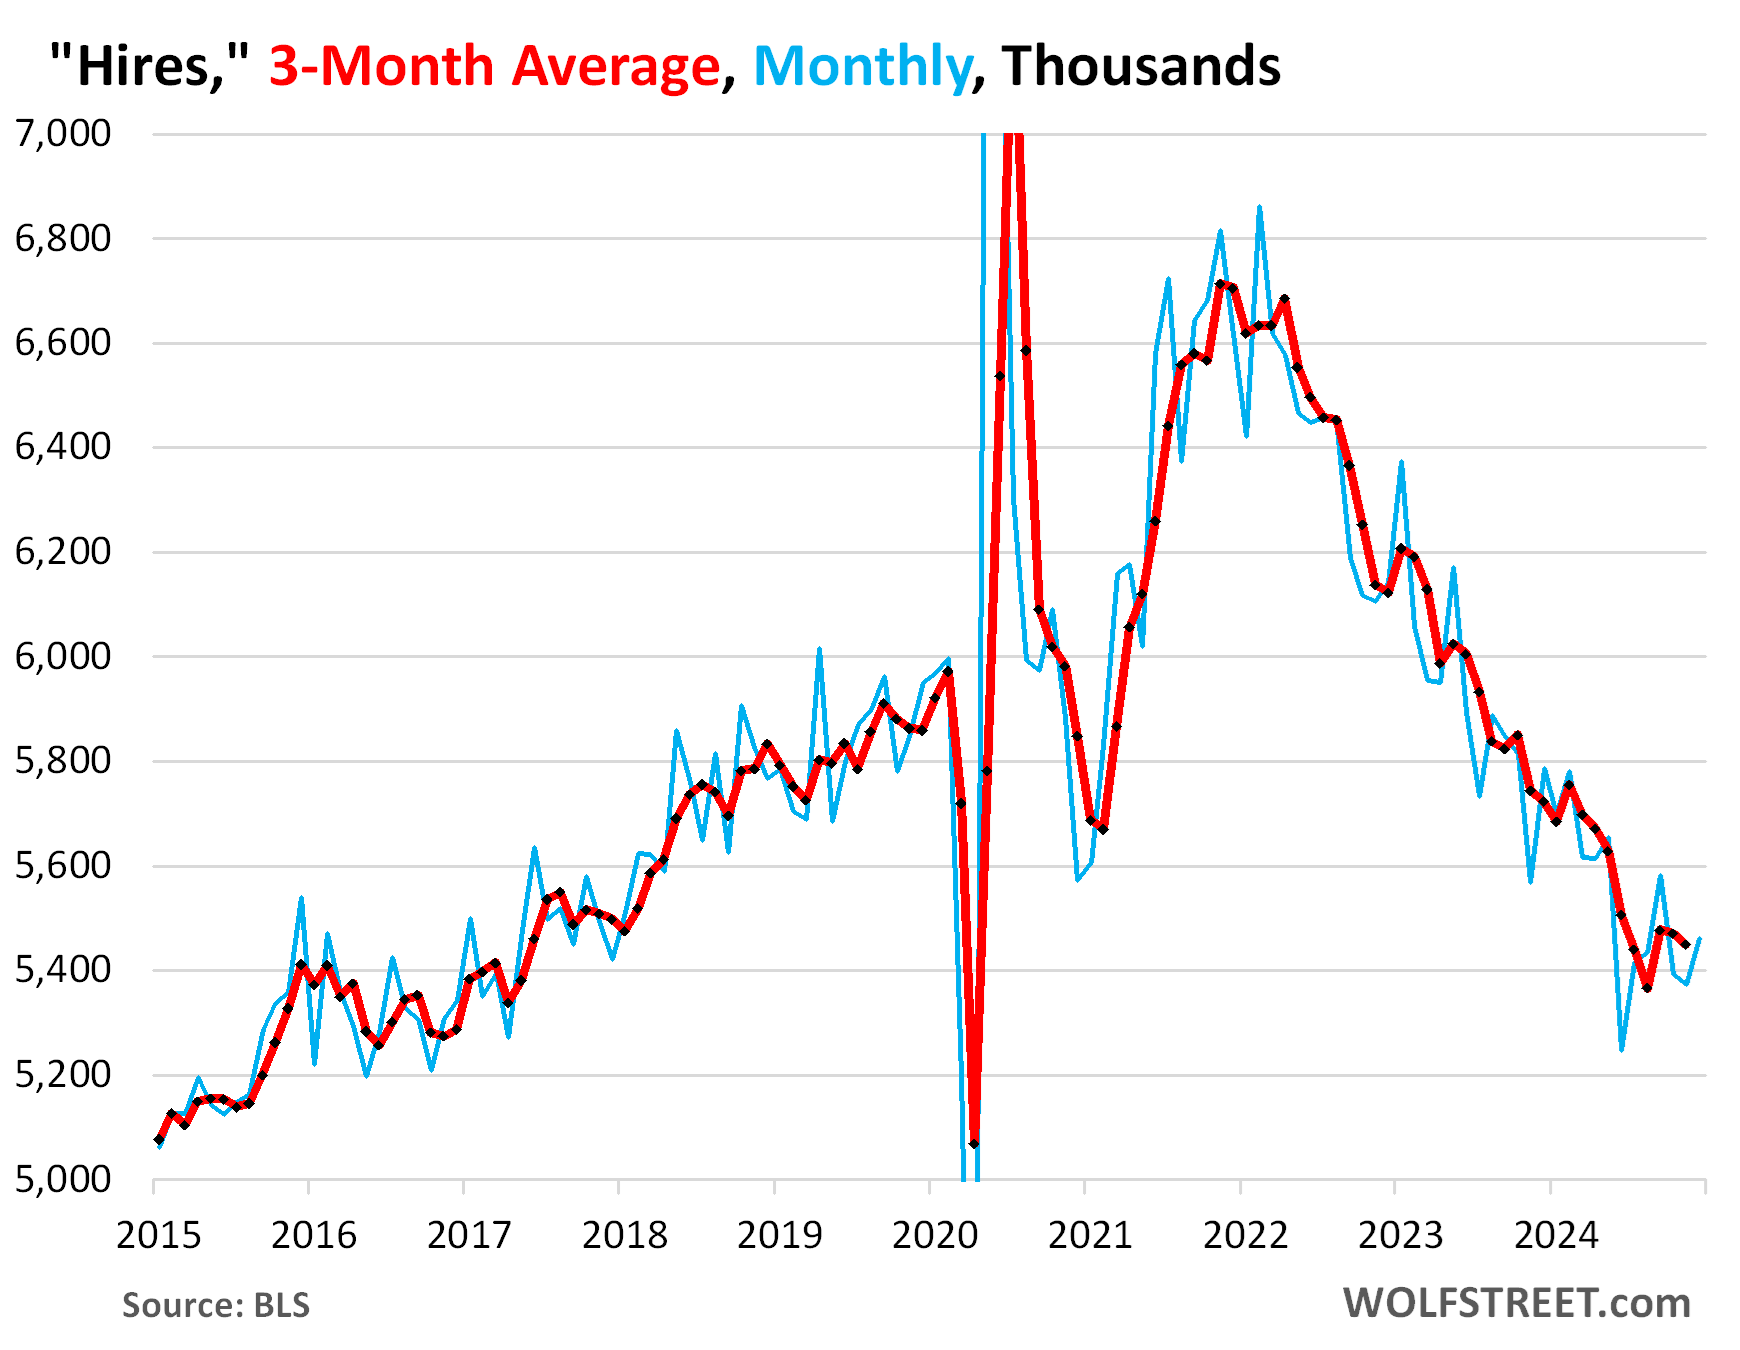
When the churn began to cool in the second half of 2022, fewer workers quit, so fewer jobs were left behind, and job openings plunged from the pandemic highs, and fewer people needed to be hired to fill those left-behind slots, and so hires plunged along with it. That was just churn, and it has cooled.
Hires to replace workers who quit or were laid off or discharged, and to fill new roles, rose in December after falling in the prior two months. The three-month average ticked down to 5.45 million. The low point was in August at 5.37 million.
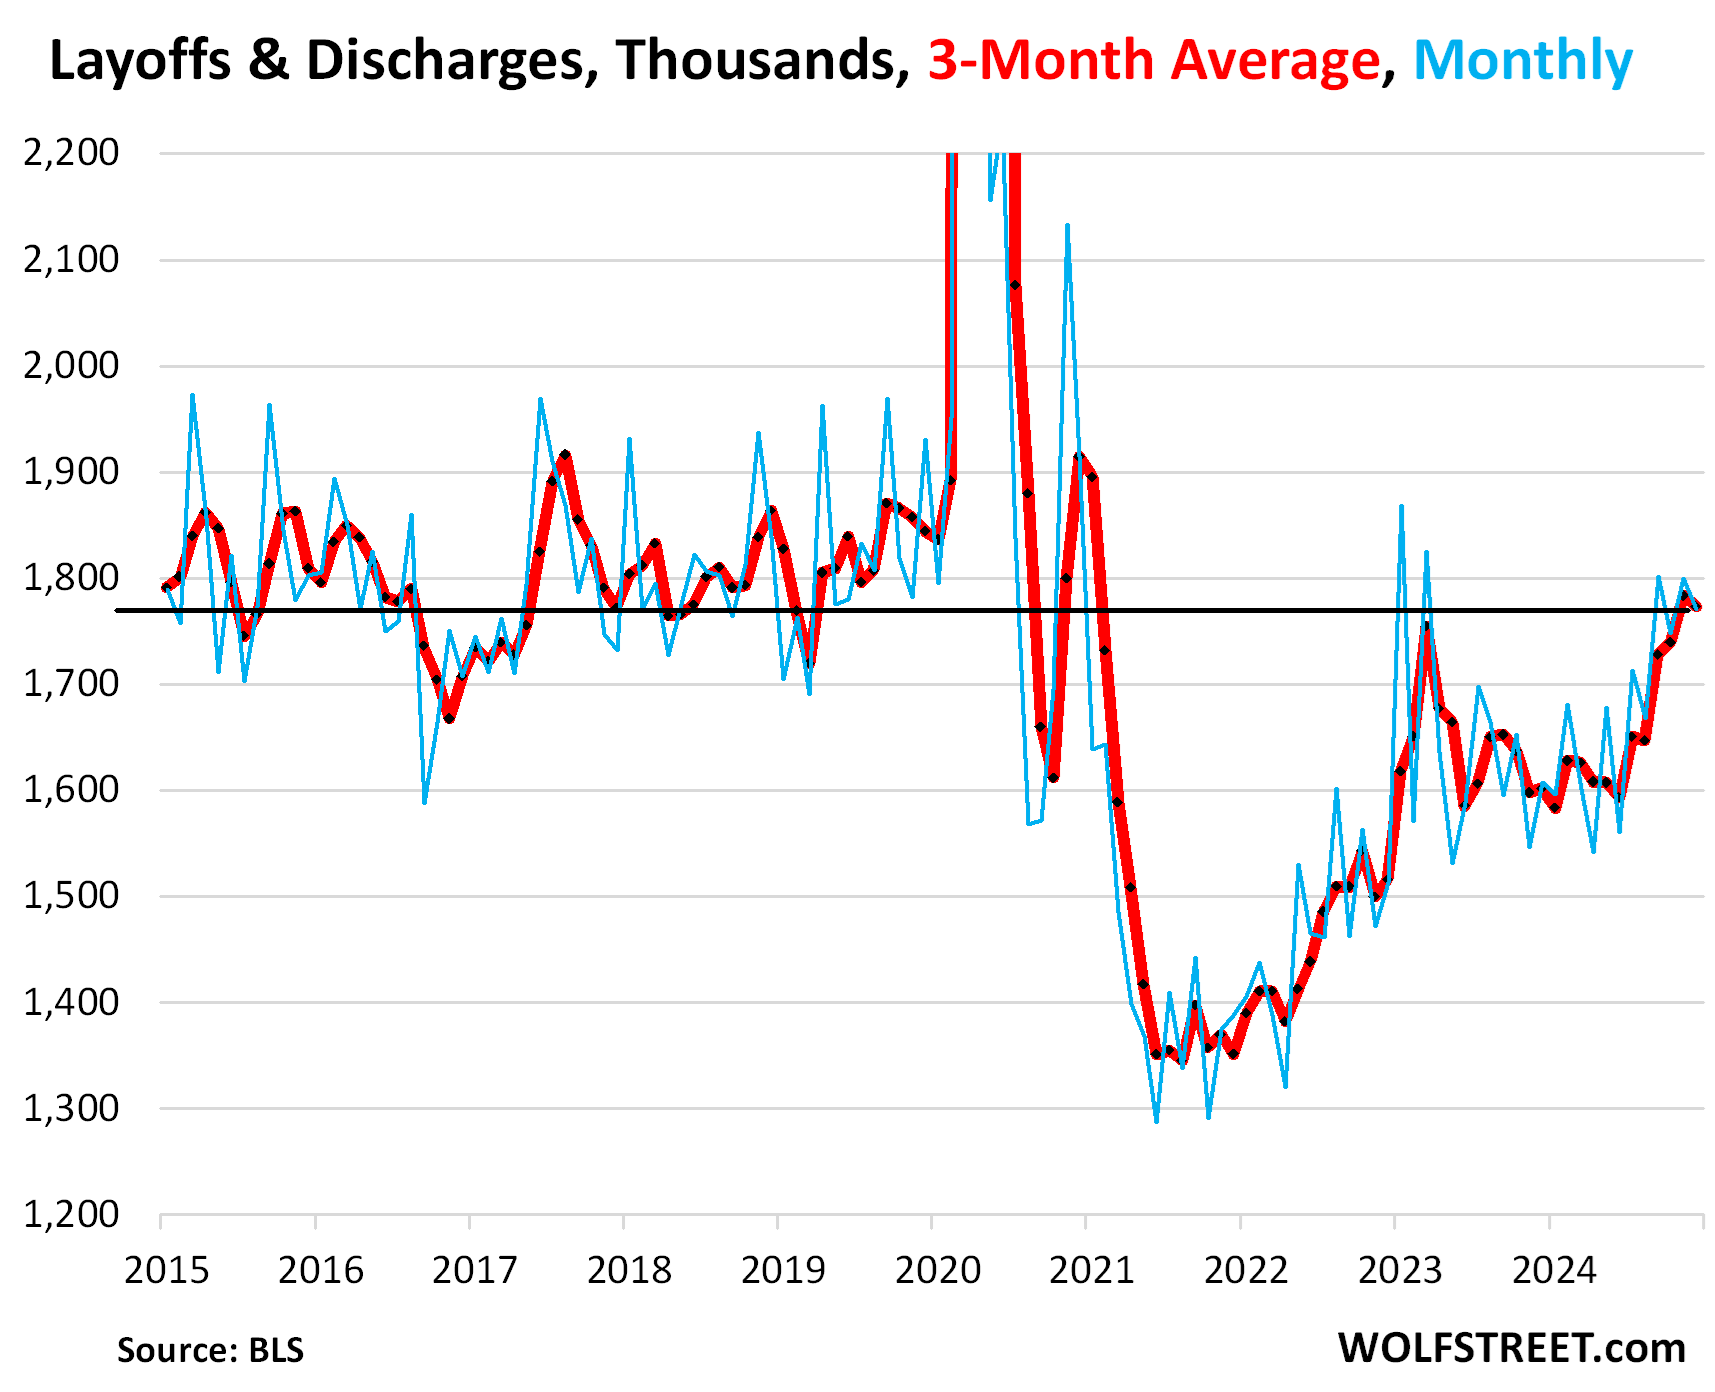
Layoffs and discharges fell to 1.77 million in December. The three-month average also dipped to 1.77 million. They have “normalized” to the low end of the range during the Good Times before the pandemic. Getting fired is a standard feature in the American workplace even during the best times.
Layoffs and involuntary discharges include people getting fired with or without cause. It does not include retirements, deaths, etc., which are in the category of “other discharges.”
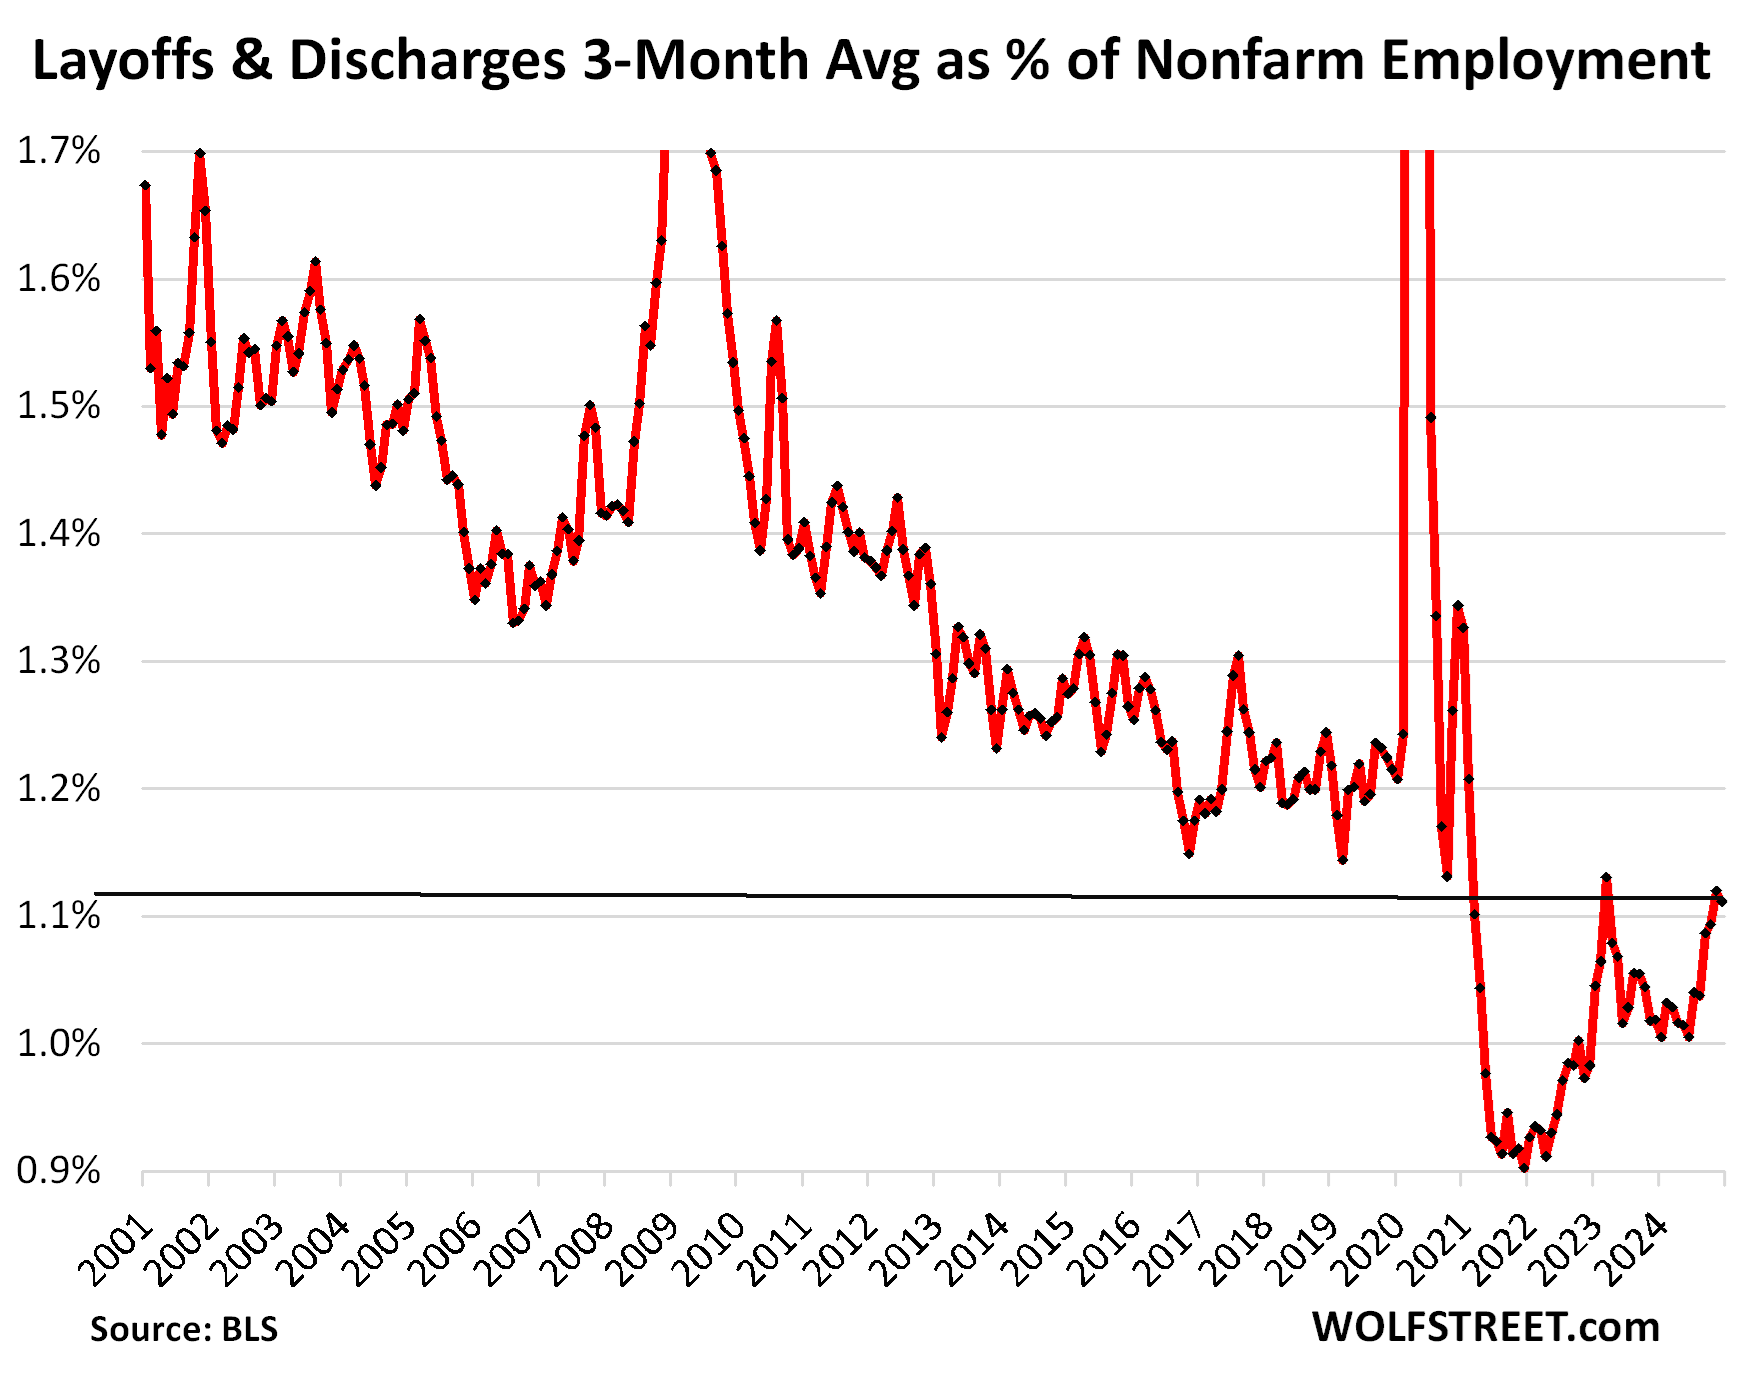
Layoffs and discharges as percentage of nonfarm payrolls, which accounts for growing employment over the years and for long-term views is the better metric to look at, dipped to 1.11%, well below any time during the pre-pandemic years in the JOLTS data going back to 2001.
So, compared to the size of nonfarm employment, layoffs and discharges are historically low, as employers are hanging on to their workers.
Enjoy reading WOLF STREET and want to support it? You can donate. I appreciate it immensely. Click on the beer and iced-tea mug to find out how:

Would you like to be notified via email when WOLF STREET publishes a new article? Sign up here.
![]()
Energy News Beat